1. Background
Liver cirrhosis represents a significant global cause of morbidity and mortality. In many regions, chronic hepatitis virus infection remains a primary etiological factor. The pathogenesis involves long-term injury that activates hepatic stellate cells (HSCs), prompting their transition to a profibrogenic phenotype through various pathways (e.g., Rho-kinase) (1) or cannabinoid receptors (2). This activation drives excessive synthesis and deposition of extracellular matrix (ECM), leading to dysfunctional tissue remodeling and progressive fibrosis (3).
The progression of cirrhosis typically evolves through compensated and decompensated phases. Portal hypertension is a key driver of decompensation, while systemic inflammation primarily propels organ failure. Portal hypertension induces intestinal congestion and barrier dysfunction, facilitating the translocation of gut-derived microbial products, such as lipopolysaccharide (LPS), into the portal circulation. These pathogen-associated molecular patterns (PAMPs) are recognized by hepatic immune cells (e.g., Kupffer cells and liver sinusoidal endothelial cells, LSECs), triggering a local inflammatory response and cytokine release, including tumor necrosis factor (TNF) and interleukin-6 (IL-6). This inflammation, partly mediated by sinusoidal contraction, further increases intrahepatic vascular resistance (IHVR), creating a vicious cycle that worsens portal hypertension (4). Concurrently, the inflammatory microenvironment activates HSCs, which then transdifferentiate into contractile myofibroblasts, thereby promoting liver fibrosis and hepatic sinusoidal capillarization. Inflammatory cells such as M1 macrophages promote angiogenesis (secretion of ROS, TNF, PDGF) and directly activate HSCs via TGFβ. Exosomes derived from M2 macrophages promote angiogenesis and inflammation control through the HIF1AN/HIF-1α/VEGFA pathway, stimulating their contractility and fibrogenesis, which ultimately drives portal hypertension progression (5, 6). Wang et al. (7) demonstrated that isoorientin reduces macrophage pyroptosis and atherosclerosis via the KDM4A/NLRP3 axis. By analogy, we extend this finding to liver cirrhosis and propose that early intervention may inhibit pyroptosis and alleviate liver fibrosis through the regulation of macrophage phenotypes.
Decompensated cirrhosis is characterized by a systemic pro-inflammatory and pro-oxidative state, largely triggered by gut-derived bacterial products and damage-associated molecular patterns (DAMPs) from the injured liver. This state leads to immune activation, release of inflammatory mediators, and multiple organ dysfunction. As cirrhosis progresses, systemic inflammation gradually worsens. Signs of inflammation are already present in the compensated stage, further intensify during the decompensated stage, and peak during acute-on-chronic liver failure (ACLF). The levels of inflammatory markers, such as C-reactive protein and cytokines, correlate with the severity of the disease (8).
Decompensated cirrhosis develops multiple complications; the most common clinical manifestations are acute esophageal and gastric variceal bleeding (AEVB) and ascites. AEVB from ruptured oesophagogastric varices is the second most common complication in patients with cirrhosis and is associated with a six-week mortality of 20% (9). Cirrhosis-associated mortality accounts for 2.4% of mortality worldwide, and is responsible for approximately two million deaths annually, ranking as the eleventh leading cause of death globally (10, 11).
The current standard initial therapy for AEVB, as per major guidelines, involves a combination of vasoactive drugs, prophylactic antibiotics, and endoscopic therapy (12). Despite the ability of endoscopy to identify the bleeding source and achieve immediate hemostasis, treatment failure occurs in 10-20% of patients, necessitating further intensive management (13). The transjugular intrahepatic portosystemic shunt (TIPS) procedure, which establishes a shunt between the hepatic and portal veins, is a key minimally invasive intervention for reducing portal pressure in cirrhosis (14). Studies indicate that the reduction in portal pressure achieved by TIPS not only decreases the incidence of further decompensation events and improves survival but is also associated with a concomitant reduction in the systemic inflammatory response (15, 16).
Both early TIPS and salvage TIPS can be used for the treatment of AEVB and serve as first-line strategies for secondary prevention, owing to their significant effect on reducing portal pressure and controlling acute bleeding. However, selecting the most appropriate treatment modality to reduce rebleeding risk, improve efficacy, and lower mortality remains a significant clinical challenge. This study retrospectively analyzes clinical data from cirrhotic patients with AEVB admitted to our hospital over the past three years. It aims to evaluate the efficacy and safety of early TIPS versus salvage TIPS.
2. Objectives
The aim of this study is to explore when patients can derive the maximum benefit from TIPS.
3. Methods
This study has been approved by the Ethics Committee of the General Hospital of Ningxia Medical University (Approval No: KYLL-2021-859; Approval Date: January 1, 2022).
3.1. Patients and Groups
Clinical data were collected from patients with liver cirrhosis and acute esophageal and gastric variceal bleeding (AEVB) who underwent TIPS placement at the General Hospital of Ningxia Medical University over the past 3 years. The cohort consisted of 134 males and 74 females, with a mean age of 54.78 ± 10.64 years. Patients were divided into two groups: An early TIPS group and a salvage TIPS group.
3.1.1. Inclusion Criteria
(1) Aged >18 years; (2) meets the diagnostic criteria for liver cirrhosis with portal hypertension complicated by AEVB; (3) all patients received TIPS treatment.
3.1.2. Exclusion Criteria
(1) Patients with gastrointestinal bleeding caused by other sites or reasons; (2) patients with severe cardiopulmonary diseases, multiple organ failure, and those unable to cooperate with endoscopy or TIPS.
Prior to the intervention, all patients underwent a standardized medical optimization protocol. This included essential supportive care such as blood transfusion for significant anemia, correction of coagulopathy with factors, albumin supplementation, and hepatoprotective therapy. The attending physicians thoroughly explained the respective differences in procedures, risks, and long-term prognoses between endoscopic therapy and TIPS to the patients and their families. The final choice between TIPS and endoscopic treatment was made collaboratively, based on this informed discussion and the family's consultation.
All TIPS procedures were performed by three interventional radiologists with more than 10 years of TIPS experience. One patient in the direct TIPS group died of sudden hemopneumothorax during the procedure, while no other patients experienced obvious active variceal bleeding during the operation. All TIPS procedures were conducted under local anesthesia (17, 18).
3.1.3. Early TIPS Group
Early TIPS is defined as being performed within 72 hours after the initial bleeding or admission to hospital.
3.1.4. Salvage TIPS Group
Salvage TIPS therapy is defined as TIPS surgery performed after the failure of one or more endoscopic treatments, with success defined as the absence of need for emergency endoscopic or interventional re-treatment within 24 hours post-procedure.
3.2. Data Collection and Follow Up
Demographic and clinical characteristics, including age, gender, presence of hypertension or diabetes mellitus, the etiology of liver cirrhosis, severity of ascites, variceal location, number of previous bleeding episodes, and presence of portal vein thrombosis, were collected for all patients upon admission. Laboratory parameters and radiological examinations were performed at admission. The laboratory indices included a complete blood count (white blood cell count, WBC; hemoglobin, Hb; and platelet count, PLT), liver function tests (alanine aminotransferase, ALT; aspartate aminotransferase, AST; total bilirubin, TBIL), coagulation profiles (prothrombin activity, PTA; international normalized ratio, INR), and renal function (creatinine, Cr). The length of hospital stay (LOS) was also recorded. The severity of liver disease was assessed using the Child-Pugh classification and the Model for End-Stage Liver Disease (MELD) score. The primary outcome measures were the occurrence of hepatic encephalopathy (HE) and rebleeding. Patients were followed up after discharge to document the timing of postoperative complications and treatment outcomes. The minimum follow-up duration was 6 months, and all follow-up activities were completed by May 2025.
3.3. Statistical Analysis
Data analysis and graphing were performed using IBM SPSS version 25.0 and GraphPad Prism version 10.0. Continuous variables were described using the mean ± standard deviation (SD) or median (interquartile ranges, IQR). For comparisons between groups, the student’s t test or Mann–Whitney U test was used. Categorical variables were presented as percentages and group comparisons were performed using Pearson’s chi-square test or Fisher’s exact test. Kaplan–Meier curves were plotted. All tests were two-sided tests, with P-value < 0.05 considered statistically significant.
4. Results
4.1. Baseline Characteristics
From January 2021 to December 2023, a total of 208 patients with acute esophageal and gastric variceal bleeding (AEVB) underwent TIPS placement. Among them, 100 patients received early TIPS, while the remaining 108 patients underwent salvage TIPS. The early TIPS group consisted of 69 males and 31 females, with a mean age of 55.49 ± 10.53 years. The salvage TIPS group included 66 males and 42 females, with a mean age of 54.13 ± 10.76 years; these patients had received an average of 1.81 ± 1.16 sessions of endoscopic treatment prior to TIPS. The mean postoperative follow-up duration was 430 days in the early TIPS group and 474 days in the salvage TIPS group. Significant differences were observed between the two groups in the incidence of concurrent infection and the length of hospital stay (LOS) (Table 1).
Table 1.
Demographic and Laboratory Data of the Study Population a
| Characteristics | Early TIPS Group = 100) | Salvage TIPS Group (n = 108) | X2/t | P-Value |
|---|---|---|---|---|
| Average age (y) | 55.49 ± 10.53 | 54.13 ± 10.76 | 921 | 358 |
| Gender | 1.419 | 0.234 | ||
| Male | 69 (69) | 66 (61.11) | ||
| Female | 31 (31) | 42 (38.89) | ||
| Cause | 7.312 | 0.120 | ||
| Post-hepatitis B/C cirrhosis | 73 (73) | 76 (70.37) | ||
| Autoimmune hepatitis | 7 (7) | 19 (17.59) | ||
| Alcoholic cirrhosis | 2 (2) | 1 (0.93) | ||
| Unknown etiology | 13 (13) | 10 (9.30) | ||
| Other | 5 (5) | 2 (1.85) | ||
| Degree of varicose veins | Fisher | 0.265 | ||
| Severe | 95 (95) | 106 (98.15) | ||
| Moderate | 5 (5) | 2 (1.85) | ||
| Bleeding location | 5.204 | 0.157 | ||
| Middle esophagus | 7 (7) | 1 (0.93) | ||
| Lower esophagus | 69 (69) | 80 (74.07) | ||
| Cardiac | 2 (2) | 25 (23.15) | ||
| Fundus | 22 (22) | 2 (1.85) | ||
| Infection | 4.065 | 0.044 | ||
| Coinfection | 61 (61) | 80 (74.07) | ||
| No coinfection | 39 (39) | 28 (25.93) | ||
| Ascites | 1.075 | 0.300 | ||
| With ascites | 68 (68) | 66 (61.11) | ||
| No ascites | 32 (32) | 42 (38.89) | ||
| Carcinoma | 0.028 | 0.867 | ||
| With carcinoma | 14 (14) | 16 (14.81) | ||
| No carcinoma | 86 (86) | 92 (85.19) | ||
| Thrombosis | 0.671 | 0.413 | ||
| With thrombosis | 33 (33) | 30 (27.78) | ||
| No thrombosis | 67 (67) | 78 (72.22) | ||
| Blood index | ||||
| Pre-Cr [M(P25~P75)]/umol. L-1 | 63.40 (51.08,76.30) | 58.10 (50.10,70.60) | -1.755 | 0.079 |
| Post-Cr [M(P25~P75)]/umol. L-1 | 55.05 (46.63,66.28) | 51.60 (44.13,63.25) | -1.086 | 0.278 |
| Pre-Ur [M(P25~P75)]/mmol. L-1 | 6.07 (3.90,8.69) | 5.36 (3.81,8.25) | -0.980 | 0.327 |
| Post-Ur [M(P25~P75)]/mmol. L-1 | 4.66 (3.39,6.19) | 4.21 (3.00,5.41) | -1.713 | 0.087 |
| Pre-TBIL [M(P25~P75)]/umol. L-1 | 22.79 (16.46,32.11) | 22.89 (14.73,34.58) | -0.157 | 0.875 |
| Post-TBIL [M(P25~P75)]/umol. L-1 | 30.24 (21.04,46.22) | 29.75 (22.47,43.37) | -0.180 | 0.857 |
| ALB (X ± S)/g. L-1 | 32.15 ± 4.64 | 31.64 ± 5.14 | 0.748 | 0.456 |
| PLT [M(P25~P75)] ×109.L-1 | 53 (39,79.75) | 54.00 (42.00,72.00) | -0.129 | 0.829 |
| PTA (X ± S)/% | 63.26 ± 13.91 | 64.06 ± 13.37 | -0.425 | 0.671 |
| INR [M(P25~P75)] | 1.38 (1.23,1.55) | 1.39 (1.25,1.49) | -0.216 | 0.429 |
| LOS [M(P25~P75)]/d | 12.00 (9.00,15.00) | 10.00 (8.00,13.75) | -2.821 | 0.005 |
| MELD score [M(P25~P75)] | 13.00 (10.00,14.25) | 11.50 (10.00,14.00) | -0.791 | 0.429 |
| Child-pugh class(A/B/C) | 24/56/20 | 35/55/18 | 1.860 | 0.395 |
| Active bleeding under endoscopy | 11 (11) | 6 (5.56) | 2.051 | 0.152 |
| Diabetes | 18 (18) | 19 (17.59) | 0.006 | 0.939 |
| Hypertension | 15 (15) | 13 (12.04) | 0.391 | 0.532 |
Abbreviation: TIPS, transjugular intrahepatic portosystemic shunt.
a Values are presented as mean ± SD or No. (%).
4.2 Survival Analysis
During a follow-up period extending until July 2025, the all-cause mortality rates were 13.0% (13/100) in the early TIPS group and 15.74% (17/108) in the salvage TIPS group, corresponding to overall survival rates of 87.0% and 84.26%, respectively. The Kaplan-Meier analysis revealed no statistically significant difference in long-term survival between the two treatment strategies (Log-rank test, P = 0.964; Figure 1). However, significant differences were observed in the incidence of major complications. The incidence of HE was significantly higher in the salvage TIPS group (35.19%, 38/108) compared to the early TIPS group (22.0%, 22/100). Similarly, the rebleeding rate was significantly higher in the salvage TIPS group (18.52%, 20/108) than in the early TIPS group (9.0%, 9/100) (both P < 0.05; Table 2). Furthermore, a comparative analysis of surviving and deceased patients across both groups indicated that mortality was associated with older age and poorer preoperative liver and renal function.
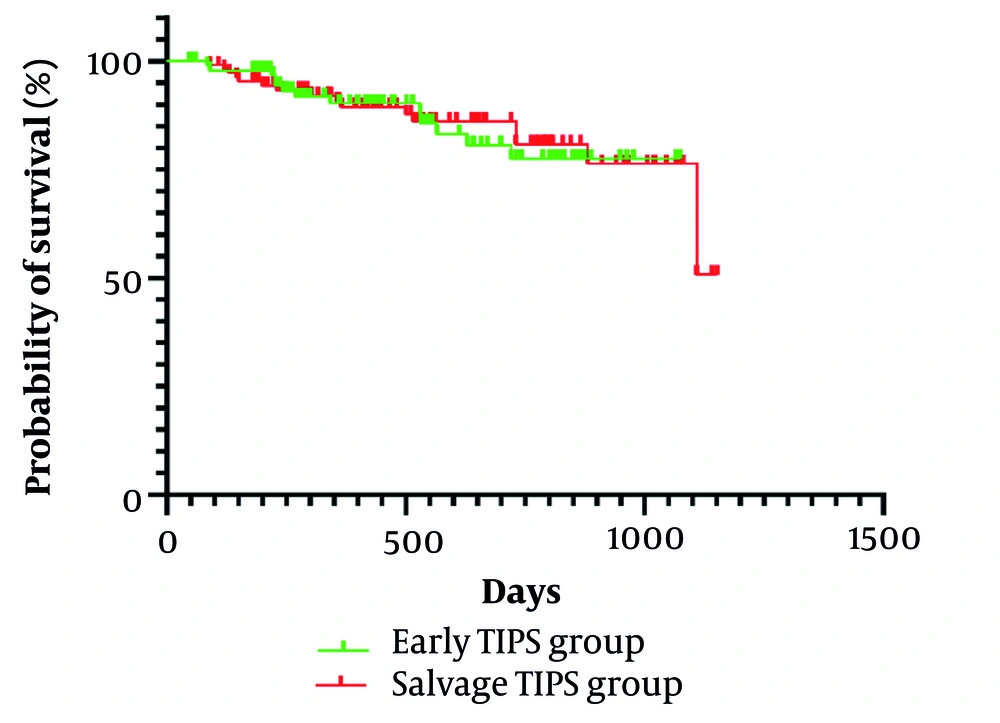
Figure 1.
The survival curves of the two groups
Table 2.
Primary and Secondary End Points a
| Outcome | Early TIPS Group (n = 100) | Salvage TIPS Group (n = 108) | X2/t | P-Value |
|---|---|---|---|---|
| Primary end point | ||||
| Death | 13 (13) | 17 (15.74) | 0.316 | 0.574 |
| Cause of death | 10.868 | 0.093 | ||
| Liver cancer | 4 | 4 | ||
| Liver failure | 4 | 5 | ||
| Rebleeding | 3 | 2 | ||
| HE | 0 | 0 | ||
| Hemopneumothorax | 1 | 0 | ||
| COVID-19 | 1 | 0 | ||
| Septic shock | 0 | 4 | ||
| Second end point | ||||
| Postoperative HE | 22 (22) | 38 (35.19) | 4.398 | 0.036 |
| Rebleeding | 9 (9) | 20 (18.52) | 3.921 | 0.048 |
Abbreviation: TIPS, transjugular intrahepatic portosystemic shunt.
a Values are presented as No. or No. (%).
These findings suggest that for patients with acute esophageal variceal bleeding, performing TIPS prior to the significant deterioration of liver and renal function may lead to improved outcomes (Tables 3 and 4).
Table 3.
Comparison of Baseline Characteristics Between Deceased and Survivors After Early Transjugular Intrahepatic Portosystemic Shunt
| Characteristics | Deceased | Survivors | X2/t | P-Value |
|---|---|---|---|---|
| Average age (y) | 58.68 ± 7.58 | 55.27 ± 10.95 | 0.167 | 0.603 |
| Pre-Ur [M(P25~P75)]/mmol. L-1 | 7.40 (4.82,10.92) | 4.52 (3.36,5.99) | -1.192 | 0.046 |
| Post-Ur [M(P25~P75)]/mmol. L-1 | 5.79 (4.69,9.06) | 62.65 (49.70,76.30) | -1.103 | 0.270 |
| Pre-Cr [M(P25~P75)]/umol. L-1 | 63.5 (56.55,93.50) | 54.10 (45.50,66.63) | -1.401 | 0.161 |
| Post-Cr [M(P25~P75)]/umol. L-1 | 59.7 (51.95,71.46) | 22.69 (16.27,31.44) | -1.187 | 0.235 |
| Pre-TBIL [M(P25~P75)]/umol. L-1 | 26.9 (27.44,33.65) | 29.98 (19.14,46.98) | -0.983 | 0.325 |
| Post-TBIL (X ± S)/umol. L-1 | 30.00 ± 3.82 | 32.50 ± 4.69 | 0.629 | 0.061 |
| ALB [M(P25~P75)]/g. L-1 | 29.50 (27.44,33.65) | 53.00 (38.00,78.25) | -0.825 | 0.410 |
| PLT (X ± S) ×109.L-1 | 60.93 ± 8.84 | 63.64 ± 14.57 | 0.081 | 0.502 |
| PTA [M(P25~P75)]/% | 59.00 (57.00,70.50) | 64.00 (53.00,74.00) | -0989 | 0.323 |
| INR (X ± S) | 1.41 ± 0.13 | 1.50 ± 0.29 | 0.017 | 0.301 |
| LOS [M(P25~P75)]/d | 14.00 (9.50,21.50) | 11.00 (8.75,15.00) | -1.346 | 0.178 |
| MELD-NA score [M(P25~P75)] | 13.0 (11.50,15.50) | 12.00 (10.00,14.50) | -1.456 | 0.145 |
Table 4.
Comparison of Baseline Characteristics Between Deceased and Survivors After Salvage Transjugular Intrahepatic Portosystemic Shunt
| Characteristics | Deceased | Survivors | X2/t | P-Value |
|---|---|---|---|---|
| Average age (y) | 61.71 ± 8.97 | 52.96 ± 10.63 | 2.927 | 0.004 |
| Pre-Ur [M(P25~P75)]/mmol. L-1 | 5.98 (4.50,9.07) | 5.17 (3.775,7.795) | -2.30 | 0.021 |
| Post-Ur [M(P25~P75)]/mmol. L-1 | 5.02 (3.07,5.815) | 4.21 (3.045,5.300) | -0.965 | 0.334 |
| Pre-Cr [M(P25~P75)]/umol. L-1 | 56.2 (46.00,73.45) | 58.10 (50.30,69.40) | -0.707 | 0.480 |
| Post-Cr [M(P25~P75)]/umol. L-1 | 48.0 (43.25,75.10) | 51.50 (44.25,61.45) | -0.942 | 0.356 |
| Pre-TBIL [M(P25~P75)]/umol. L-1 | 25.30 (19.72,41.50) | 22.50 (14.56,34.51) | -1.039 | 0.299 |
| Post-TBIL [M(P25~P75)]/umol. L-1 | 33.00 (28.48,70.80) | 28.91 (21.86,40.51) | -2.771 | 0.006 |
| ALB [M(P25~P75)]/g. L-1 | 31.00 (29.515,34.60) | 31.40 (28.53,35.80) | -0.559 | 0.576 |
| PLT (X ± S) ×109.L-1 | 46.0 (35.50,67.00) | 54.00 (42.00,71.50) | -0.125 | 0.901 |
| PTA (X ± S)/% | 65.5 ± 13.75 | 63.83 ± 13.45 | 0.432 | 0.666 |
| INR [M(P25~P75)] | 1.39 (1.26,1.47) | 1.38 (1.25,1.51) | -1.116 | 0.908 |
| LOS [M(P25~P75)]/d | 10.00 (8.00,14.50) | 10.00 (10.00,13.50) | -0.107 | 0.915 |
| MELD-NA score [M(P25~P75)] | 12.00 (12.00,15.50) | 11.00 (10.00,14.00) | -1.722 | 0.085 |
5. Discussion
This study aims to compare the efficacy and safety of early TIPS versus salvage TIPS in patients with liver cirrhosis complicated by AEVB, with a focus on their impacts on rebleeding, HE, and survival rate. The results indicated that although there was no significant difference in long-term survival rates between the two groups of patients, early TIPS significantly reduces the rebleeding rate (9% vs 18.52%) and the incidence of HE (22% vs 35.19%). Thereby, it prevents the further deterioration of liver function caused by recurrent bleeding and the medical burden associated with multiple hospitalizations. These findings suggest that for patients with liver cirrhosis and AEVB, early TIPS intervention at the time of the first bleeding episode may be more beneficial in reducing the risk of postoperative complications compared to salvage TIPS.
The findings of this study are partially consistent with the large randomized controlled trial by Lv et al. and Garcia-Pagán JC et al. (13, 19), which demonstrated that early TIPS improves survival in high-risk patients. Although our study did not show a significant difference in survival rates, the advantage of early TIPS in reducing rebleeding aligns with previous findings (20, 21). Notably, our research found a lower incidence of HE in the early TIPS group, which differs from some conventional perspectives (22). However, recent studies (23, 24) have shown that in the treatment of variceal bleeding, the incidence of HE is comparable between early preemptive TIPS and endoscopic therapy, and post-TIPS HE does not lead to an increase in mortality. This discrepancy may be attributed to the inclusion of a patient population with relatively better liver function in our study or may reflect advancements in intraoperative shunt pressure control techniques. Transjugular intrahepatic portosystemic shunt also improves prognosis by effectively treating the hemodynamic disorders associated with cirrhosis. Meanwhile, the higher incidence of HE in the salvage TIPS group is consistent with reports by Shalaby et al. (25), suggesting that recurrent bleeding and failed endoscopic therapy may exacerbate liver injury and systemic inflammation, thereby increasing the risk of post-TIPS encephalopathy.
The superiority of early TIPS may stem from its ability to address the fundamental issue of portal hypertension at the hemodynamic level at an earlier stage. Portal hypertension is not only the direct cause of bleeding but also the trigger for intestinal barrier dysfunction, endotoxemia, and systemic inflammation, which are core factors driving the progression of cirrhosis and multiple organ failure. By rapidly reducing portal pressure, early TIPS potentially interrupts this vicious cycle, thereby reducing subsequent complications. In contrast, patients receiving salvage TIPS experience a longer duration of active bleeding and sustained portal hypertension before endoscopic treatment fails. This may lead to a more severe systemic inflammatory response and exhaustion of functional reserve in multiple organs. This "second hit" model implies that even after receiving TIPS, their subsequent recovery is more challenging. Additionally, portal hypertension persisted, and new variceal branches might form again, resulting in recurrent bleeding. Krige et al. (26) demonstrated that after multiple failed endoscopic hemostasis attempts, liver function deteriorates, complications ensue, and outcomes are poor. This may explain why the control group had a higher mortality rate following repeated failed endoscopic treatments.
Transjugular intrahepatic portosystemic shunt achieves hemostasis by establishing a shunt between the portal vein and the hepatic vein, diverting part of the blood from the portal vein to the systemic circulation. This process helps reduce the portal vein pressure, thereby alleviating the severity of varicose veins (27, 28). Hepatic encephalopathy is the most common complication after TIPS. The main reason for HE occurrence after TIPS is that ammonia cannot be converted by the liver and directly enters the brain from the intestines. This leads to the excessive activation of astrocytes and astrocyte edema, followed by a decrease in their detoxification capacity, and ultimately results in HE (29). Relevant studies have shown that the incidence of overt hepatic encephalopathy (OHE) after TIPS in patients with liver cirrhosis is 30% - 35%, and up to 8% of these patients may progress to persistent overt hepatic encephalopathy (30). In our study, the incidence of HE in the early TIPS group was 22%, while that in the control group was 35.16%, which is consistent with the above-mentioned research results. A study by Nardelli et al. (24) has shown that HE after TIPS does not increase the mortality rate of patients with liver cirrhosis.
In this study, the general data and survival data of the early TIPS group and the TIPS group after repeated failed endoscopic therapy were compared. The results showed that early TIPS had significant advantages in reducing the degree of varices, decreasing rebleeding, and lowering the incidence of HE in patients. Relevant studies (31, 32) have indicated that early TIPS can effectively control gastrointestinal bleeding and further improve the survival rate of patients.
In conclusion, for patients with advanced liver cirrhosis and acute variceal bleeding, early TIPS is superior to salvage TIPS performed after repeated failed endoscopic therapy in terms of improving survival rate, reducing further bleeding, and not increasing the risk of severe HE. Therefore, for patients with decompensated liver cirrhosis and acute variceal bleeding, it is recommended to receive TIPS treatment as early as possible, rather than undergoing salvage TIPS treatment when they have experienced multiple episodes of bleeding, repeated failed endoscopic therapy, and decompensation of liver and kidney function. The findings of this study support the more proactive consideration of an early TIPS strategy for select patients with AEVB, particularly those at high risk of endoscopic treatment failure, rather than salvage TIPS. This approach may help avert further liver function impairment caused by recurrent bleeding and improve patients' quality of life.
However, this study has several limitations. First, as a single-center retrospective design, it carries a potential risk of selection bias. Second, although the definitions of "early TIPS" and "salvage TIPS" were clearly outlined, their distinction may blur in real-world clinical practice. Additionally, the analysis did not fully account for detailed factors such as post-TIPS antiplatelet/anticoagulation strategies or shunt flow velocity, which may influence rebleeding rates and stent patency. Future prospective, multicenter studies are needed to validate these findings and to explore biomarkers or clinical scoring systems capable of precisely predicting the optimal timing for TIPS intervention.
5.1. Conclusions
This study demonstrates that for patients with liver cirrhosis complicated by acute esophageal and gastric variceal bleeding (AEVB), the early TIPS strategy is more effective in preventing rebleeding and HE without increasing the risk of mortality compared with salvage TIPS. Therefore, for eligible patients, consideration should be given to advancing the timing of TIPS intervention.