1. Background
Metabolic dysfunction-associated fatty liver disease (MAFLD) has become one of the most common chronic liver diseases worldwide, and its prevalence has increased markedly alongside the epidemics of obesity and metabolic syndrome (1, 2). MAFLD encompasses a broad disease spectrum, ranging from simple hepatic steatosis to metabolic dysfunction-associated steatohepatitis (MASH), liver fibrosis, and cirrhosis (3), and severely impairs patients' quality of life and long-term prognosis. Therefore, early identification and accurate assessment of fatty liver severity, particularly the discrimination of severe cases, are of important clinical significance. Currently, liver biopsy remains the gold standard for the diagnosis and grading of fatty liver (3); however, its invasiveness, high cost, and sampling error limit its use in large-scale screening. Imaging examinations, such as FibroScan liver stiffness measurement, can be used to evaluate liver stiffness and the degree of steatosis, but their sensitivity and specificity are limited for early lesions and mild fatty liver (4). Thus, the development of noninvasive, simple, and accurate classification models has become an important research focus.
In recent years, multiple studies have attempted to develop fatty liver risk assessment tools based on routine clinical indicators, such as the Fatty Liver Index and NAFLD Fibrosis Score (5). However, most of these models focus on fatty liver screening or fibrosis risk evaluation, and discriminative models specifically for severe fatty liver remain scarce. Existing studies also suggest that obesity, as measured by BMI, and dyslipidemia, including CHOL, are closely associated with fatty liver severity. In addition, the TyG index, a simple surrogate marker of insulin resistance, has shown predictive value in some studies (6, 7).
2. Objectives
Based on these considerations, this study aimed to systematically analyze clinical indicators associated with severe fatty liver, identify independent predictors, and develop a nomogram-based classification model incorporating BMI and CHOL using a single-center retrospective cohort, thereby providing an intuitive and practical tool for assessing the risk of severe fatty liver in clinical practice.
3. Methods
3.1. Study Design, Duration, and Population
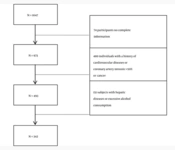
This was a single-center, retrospective cross-sectional study. A total of 217 patients with a clinical diagnosis of hepatic steatosis were screened. All patients underwent basic biochemical testing, abdominal ultrasound, and FibroScan examinations at the Department of Hepatology, Qinghai Fourth People's Hospital, between January 2021 and December 2023. The exclusion criteria were as follows: 1) viral hepatitis (hepatitis B or hepatitis C) in 8 cases; 2) autoimmune liver disease in 11 cases; 3) drug-induced liver injury in 9 cases; 4) alcohol abuse, defined as an average daily alcohol consumption ≥ 30 g for males and ≥ 20 g for females, in 12 cases; 5) malignant tumors in 7 cases; and 6) missing key clinical or laboratory data in 11 cases. The final sample consisted of 159 patients, including 119 patients with mild-to-moderate hepatic steatosis and 39 patients with severe hepatic steatosis. All patients completed clinical and laboratory examinations, with a 100% completeness rate for key indicators, including BMI, CHOL, liver function, blood lipids, and blood glucose.
3.2. Selection Criteria
The inclusion criteria were as follows: 1) a diagnosis of hepatic steatosis confirmed by both abdominal ultrasound and FibroScan; 2) concomitant obesity and/or type 2 diabetes mellitus, with obesity defined as BMI ≥ 24.0 kg/m2 and waist circumference ≥ 90 cm for males or ≥ 85 cm for females; and 3) metabolic syndrome according to the following criteria: fasting plasma glucose ≥ 6.1 mmol/L, 2-hour plasma glucose ≥ 7.8 mmol/L after glucose load, history of type 2 diabetes mellitus, homeostasis model assessment of insulin resistance ≥ 2.5, fasting serum triglycerides ≥ 1.7 mmol/L, serum high-density lipoprotein cholesterol ≤ 1.0 mmol/L in males or ≤ 1.3 mmol/L in females while receiving lipid-lowering therapy, receiving lipid-lowering therapy in the context of the preceding criterion, blood pressure ≥ 135/85 mmHg, or receiving antihypertensive therapy.
The exclusion criteria were as follows: 1) other chronic liver diseases, including viral hepatitis, autoimmune liver disease, cirrhosis, and Wilson disease; 2) excessive alcohol consumption or alcoholic liver disease; 3) severe cardiovascular, renal, or endocrine disorders, or malignant tumors; 4) pregnancy or lactation; and 5) missing key data that could not be supplemented.
3.3. Assessment of Hepatic Steatosis Severity
The severity of hepatic steatosis was jointly determined using ultrasound and FibroScan examinations. The results were independently interpreted by 2 radiologists with attending-physician qualifications or higher and experience in abdominal imaging diagnosis. Grading was considered valid only when the ultrasound findings were consistent with the FibroScan results. The following unified grading thresholds were adopted.
The ultrasound grading criteria were as follows: mild, slightly increased echogenicity of the hepatic parenchyma, no obvious far-field attenuation, and clear intrahepatic ductal structures; moderate, markedly increased echogenicity of the hepatic parenchyma, mild far-field attenuation, and slightly blurred intrahepatic ductal structures; and severe, significantly increased echogenicity of the hepatic parenchyma, pronounced far-field attenuation, and markedly blurred intrahepatic ductal structures.
The FibroScan grading criteria were as follows: mild-to-moderate, a controlled attenuation parameter between 238 and 292 dB/m, inclusive; and severe, a controlled attenuation parameter > 292 dB/m.
3.4. Data Collection and Variable Definition
Clinical data and laboratory parameters were collected from all patients, including demographic characteristics (age, sex, and ethnicity) and anthropometric measurements, including BMI (kg/m2). Biochemical parameters included CHOL, triglycerides (TG), low-density lipoprotein cholesterol (LDL-C), high-density lipoprotein cholesterol (HDL-C), total bilirubin (TBIL), direct bilirubin (DBIL), indirect bilirubin (IBIL), alanine aminotransferase (ALT), aspartate aminotransferase (AST), gamma-glutamyl transferase (GGT), alkaline phosphatase (ALP), and fasting plasma glucose (GLU). The insulin resistance index was represented by TyG, which was calculated from fasting plasma glucose and triglycerides. Liver stiffness measurement was obtained using FibroScan. Fatty liver severity was classified into mild-to-moderate and severe groups based on ultrasound imaging findings. Key variables in this study, including BMI, CHOL, age, sex, and imaging grade, had no missing data. The missing rate for secondary indicators, such as liver stiffness measurement and selected liver function parameters, was less than 5%. Given the very low proportion of missing data, complete-case analysis was performed without imputation.
3.5. Statistical Analysis
3.5.1. Univariate and Multivariate Logistic Regression Analysis
Continuous variables were compared between the 2 groups using the independent-samples t-test, whereas categorical variables were analyzed using the chi-square test or Fisher exact test, as appropriate. All statistical analyses were performed using SPSS version 26.0 or R version 4.1.0. Variables with P < 0.05 were considered statistically significant. A binary logistic regression model was constructed with the presence of severe fatty liver, coded as 1 for severe and 0 for nonsevere, as the dependent variable. Variables with P < 0.05 in the univariate analysis, including BMI, CHOL, and the TyG index, were entered into the model, and independent predictors were selected using a forward stepwise method. For each variable, the regression coefficient (β), standard error, Wald χ2 value, OR, and 95% CI were calculated. Model goodness of fit was assessed using McFadden R2, Cox and Snell R2, and Nagelkerke R2.
3.5.2. Construction of the Nomogram
Based on the significant variables identified in the multivariate logistic regression analysis, a nomogram model was constructed using the rms package in R software. The regression coefficient for each variable was converted into a corresponding score, and the total score was used to estimate the probability of severe fatty liver.
Based on the multivariate logistic regression results, the complete prediction equation for severe fatty liver was as follows: Logit(P) = -19.017 + 0.460 × (BMI) + 0.499 × (CHOL). Here, P is the predicted probability of severe fatty liver, calculated as:
To enhance clinical utility, the regression coefficients were converted into a point-based scoring system, with a range of 0 - 100 for each variable and a total of 200 points, based on the ratio of coefficients (BMI:CHOL ≈ 0.460:0.499 ≈ 1:1) and the observed ranges of BMI (18.5 - 38.0 kg/m2) and CHOL (2.5 - 8.5 mmol/L).
3.5.3. Model Performance Evaluation
Discriminative ability was evaluated by plotting the ROC curve and calculating the AUC to assess the model's ability to discriminate severe fatty liver. Calibration was evaluated by plotting a calibration curve using the bootstrap method with 1000 resamples to assess agreement between predicted probabilities and observed risks. Clinical utility was evaluated using DCA to assess the net clinical benefit of the model across different threshold probabilities.
4. Results
4.1. Patient Baseline Characteristics and Univariate Analysis
A total of 159 patients with fatty liver were enrolled in this study, including 119 patients in the mild-to-moderate group and 39 in the severe group. There were no significant differences in age, sex, or ethnic distribution between the 2 groups (P > 0.05). Univariate analysis (Table 1) showed that BMI (30.52 ± 3.14 vs 26.16 ± 3.00 kg/m2; t = -7.802; P < 0.01), serum CHOL level (4.92 ± 1.23 vs 4.39 ± 1.16 mmol/L; t = -2.420; P = 0.017), and the TyG index (8.85 ± 0.52 vs 8.64 ± 0.56; t = -2.033; P = 0.044) were significantly higher in the severe fatty liver group than in the mild-to-moderate group. Liver function indicators, including ALT, AST, and GGT; other lipid parameters, including TG, LDL-C, and HDL-C; and liver stiffness measurement showed no statistically significant differences between the 2 groups (P > 0.05).
Table 1.
Univariate Analysis Results of Severe Fatty Liver and Mild-to-Moderate Fatty Liver a
| Items | Group 1, Mild-to-Moderate Fatty Liver (n = 119) | Severe Fatty Liver (n = 39) | T/χ2 | P-Value |
|---|---|---|---|---|
| LSM, kPa | 9.94 ± 4.63 | 9.64 ± 3.89 | 0.362 | 0.718 |
| GLU, mmol/L | 5.54 ± 1.59 | 5.96 ± 1.55 | -1.412 | 0.160 |
| ALT, U/L | 55.06 ± 55.40 | 74.59 ± 73.23 | -1.758 | 0.081 |
| AST, U/L | 46.65 ± 45.62 | 46.33 ± 32.08 | 0.040 | 0.968 |
| GGT, U/L | 99.23 ± 175.51 | 89.92 ± 83.60 | 0.319 | 0.750 |
| TG, mmol/L | 1.52 ± 1.07 | 1.64 ± 0.72 | -0.670 | 0.504 |
| CHOL, mmol/L | 4.39 ± 1.16 | 4.92 ± 1.23 | -2.420 | 0.017 b |
| LDL-C, mmol/L | 2.82 ± 0.91 | 3.15 ± 1.14 | -1.649 | 0.105 |
| HDL-C, mmol/L | 1.21 ± 0.33 | 1.18 ± 0.41 | 0.446 | 0.656 |
| ALP, U/L | 103.96 ± 66.69 | 94.36 ± 54.11 | 0.815 | 0.416 |
| TyG | 8.64 ± 0.56 | 8.85 ± 0.52 | -2.033 | 0.044 b |
| Age, y | 48.32 ± 12.22 | 46.64 ± 14.41 | 0.711 | 0.478 |
| BMI, kg/m2 | 26.16 ± 3.00 | 30.52 ± 3.14 | -7.802 | 0.000 c |
| TBIL, μmol/L | 26.87 ± 71.81 | 16.90 ± 8.52 | 0.863 | 0.389 |
| DBIL, μmol/L | 12.18 ± 51.46 | 4.33 ± 2.55 | 0.949 | 0.344 |
| IBIL, μmol/L | 14.62 ± 21.60 | 13.01 ± 6.78 | 0.458 | 0.647 |
| Gender | 0.137 | 0.711 | ||
| Female | 31 (26.05) | 9 (23.08) | ||
| Male | 88 (73.95) | 30 (76.92) | ||
| Ethnicity | 2.437 | 0.487 | ||
| Tibetan | 60 (50.42) | 24 (61.54) | ||
| Han | 50 (42.02) | 12 (30.77) | ||
| Hui | 7 (5.88) | 3 (7.69) | ||
| Mongol | 2 (1.68) | 0 (0.00) |
a Values are expressed as mean ± SD or No. (%). Abbreviations: ALP, alkaline phosphatase; ALT, alanine aminotransferase; AST, aspartate aminotransferase; BMI, body mass index; CHOL, total cholesterol; DBIL, direct bilirubin; GGT, gamma-glutamyl transferase; GLU, fasting blood glucose; HDL-C, high-density lipoprotein cholesterol; IBIL, indirect bilirubin; LDL-C, low-density lipoprotein cholesterol; LSM, liver stiffness measurement; TBIL, total bilirubin; TG, triglyceride; TyG, Triglyceride-Glucose Index.
b P < 0.05 was considered statistically significant.
c P < 0.01 was considered statistically significant.
4.2. Multivariate Logistic Regression Analysis
Variables showing significant differences in univariate analysis, including BMI, CHOL, and the TyG index, were included in the binary logistic regression model. The results (Table 2) showed that BMI (OR = 1.585; 95% CI, 1.342 - 1.871; P < 0.001) and CHOL (OR = 1.647; 95% CI, 1.081 - 2.509; P = 0.020) were independent risk factors for severe fatty liver. Although the TyG index showed a positive association trend, it did not reach statistical significance (OR = 1.348; 95% CI, 0.558 - 3.259; P = 0.507). The McFadden R2, Cox and Snell R2, and Nagelkerke R2 values of the regression model were 0.317, 0.298, and 0.443, respectively, indicating satisfactory goodness of fit.
Table 2.
Summary of Binary Logit Regression Analysis Results for Severe Fatty Liver a
| Item | Regression Coefficient | Standard Error | z value | Wald χ2 | P-Value | OR value | OR 95% CI |
|---|---|---|---|---|---|---|---|
| TyG | 0.299 | 0.450 | 0.663 | 0.440 | 0.507 | 1.348 | 0.558 - 3.259 |
| BMI, kg/m2 | 0.460 | 0.085 | 5.433 | 29.515 | 0.000 | 1.585 | 1.342 - 1.871 |
| CHOL, mmol/L | 0.499 | 0.215 | 2.324 | 5.402 | 0.020 | 1.647 | 1.081 - 2.509 |
| Intercept | -19.017 | 4.497 | -4.229 | 17.884 | 0.000 | 0.000 | 0.000 - 0.000 |
a The dependent variable was the presence of severe fatty liver. McFadden R2 = 0.317; Cox and Snell R2 = 0.298; Nagelkerke R2 = 0.443.
Table 2 summarizes the binary logit regression results. In logistic regression, “pseudo-R-squared” is used to represent the proportion of variance in the dependent variable (severe fatty liver or not) explained by the independent variables in the model. McFadden R² = 0.317: a value greater than 0.2 is generally considered indicative of good model fit. Cox & Snell / Nagelkerke R²: these are also pseudo-R-squared measures; Nagelkerke R² ranges from 0 to 1 and is easier to interpret. In this model, 0.443 indicates that the model explains approximately 44.3% of the variance, suggesting good fit. OR of BMI = 1.585: each 1 kg/m² increase in BMI is associated with a 58.5% increase in the risk of severe fatty liver. OR of CHOL = 1.647: each 1 mmol/L increase in total cholesterol is associated with a 64.7% increase in the risk of severe fatty liver.
4.3. Construction and Validation of the Nomogram Classification Model
Based on the results of multivariate analysis, 2 independent risk factors, BMI and CHOL, were selected to construct a risk-discriminative nomogram for severe fatty liver (Figure 1). The model converts a patient’s BMI and CHOL levels into scores, which are summed to obtain the individual estimated probability of developing severe fatty liver.
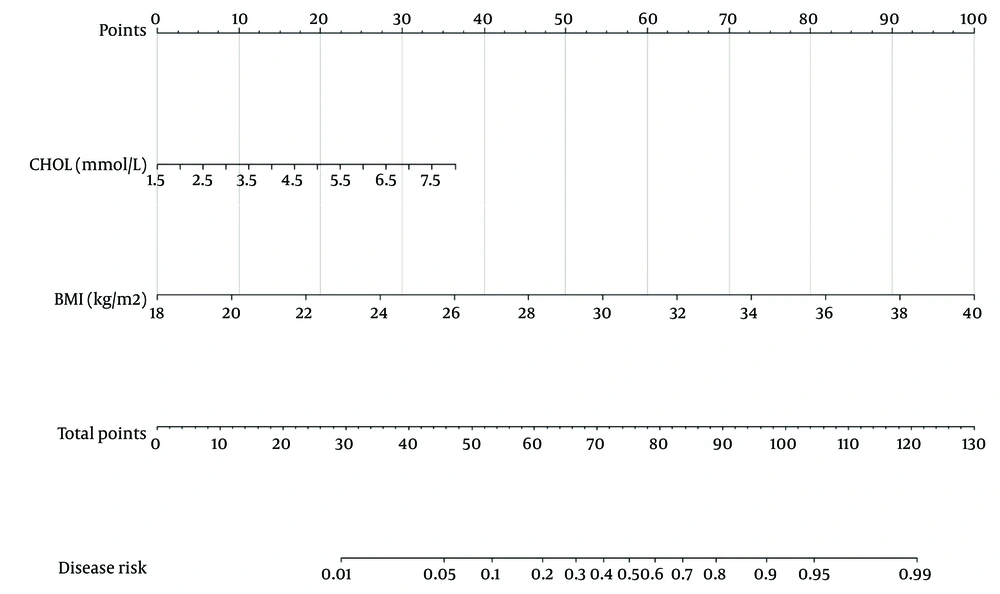
Figure 1.
Nomogram of the diagnostic model for MAFLD. Score axis: the top axis for calculating the corresponding “points” of each variable. Variable axes: the middle two axes corresponding to each predictor in the model. Total score axis: the fourth axis for summing the scores of all variables. Risk probability axis: the rightmost axis for converting the total score into the final disease risk probability.
A practical score table (Table 3) is also provided. Clinicians can directly look up the scores corresponding to a patient’s BMI and CHOL values, sum the scores, and identify the corresponding risk category. For example, a patient with a BMI of 28 kg/m2 (approximately 55 points) and a CHOL level of 5.5 mmol/L (approximately 60 points) has a total score of 115 points, corresponding to a predicted severe fatty liver risk of approximately 40%-50%.
Table 3.
Practical Score Table for Assessing Severe Fatty Liver Risk Using BMI and CHOL
| BMI, kg/m2 | Points | CHOL, mmol/L | Points | Total Points | Predicted Risk, % |
|---|---|---|---|---|---|
| 20 | 10 | 3.0 | 5 | 15 | < 5 |
| 22 | 20 | 3.5 | 10 | 30 | 5 - 10 |
| 24 | 30 | 4.0 | 20 | 50 | 10 - 20 |
| 26 | 40 | 4.5 | 30 | 80 | 20 - 30 |
| 28 | 55 | 5.0 | 40 | 95 | 30 - 40 |
| 30 | 70 | 5.5 | 60 | 130 | 50 - 60 |
| 32 | 85 | 6.0 | 80 | 165 | 70 - 80 |
| 34 | 100 | 6.5 | 100 | 200 | > 90 |
4.3.1. Discrimination Evaluation
The apparent AUC of the nomogram model in the original dataset was 0.888 (95% CI, 0.830 - 0.946), indicating good preliminary discriminatory ability (Figure 2). Given the modest sample size, particularly the 39 patients with severe fatty liver, internal validation was further performed using bootstrap resampling with 1000 replicates to calculate the optimism-corrected AUC. The mean optimism-corrected AUC was 0.861 (95% CI, 0.798 - 0.915), representing a downward correction of approximately 0.027 from the apparent AUC. This finding suggests mild optimism bias; however, the corrected AUC remained within an acceptable range for discriminative performance.
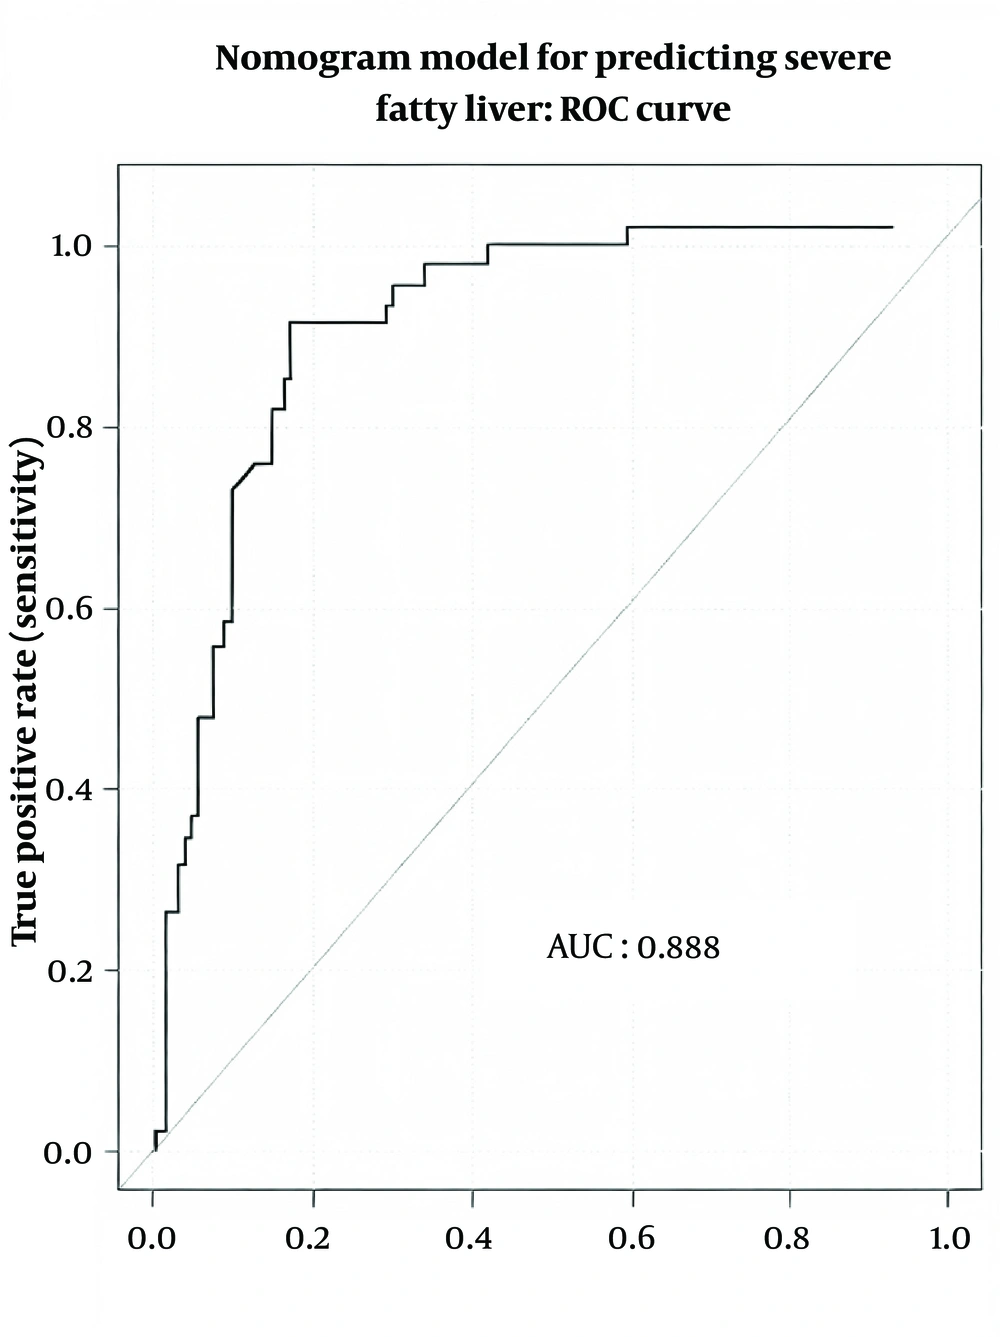
Figure 2.
ROC curve for evaluating the diagnostic efficacy of the CHOL-BMI model in MAFLD. The horizontal axis represents specificity (false positive rate), and the vertical axis represents sensitivity (true positive rate). The gray diagonal line represents the random guess line. Each point on the ROC curve corresponds to a specific “diagnostic threshold”. At the optimal cutoff point (maximum Youden index), the false positive rate is approximately 0.20 and the true positive rate is approximately 0.82. The optimal cutoff is located at the point closest to the upper left corner of the curve, representing the ideal combination of high sensitivity and low false positive rate.
4.3.2. Calibration Evaluation
Internal validation was performed using the bootstrap method with 1000 resamplings, and calibration curves were plotted (Figure 3). The results showed that the bias-corrected calibration curve closely coincided with the ideal reference line, representing predicted probability = actual probability, especially in the medium-risk interval of 0.3 - 0.6, suggesting good consistency between the model-estimated risk probability and the observed risk.
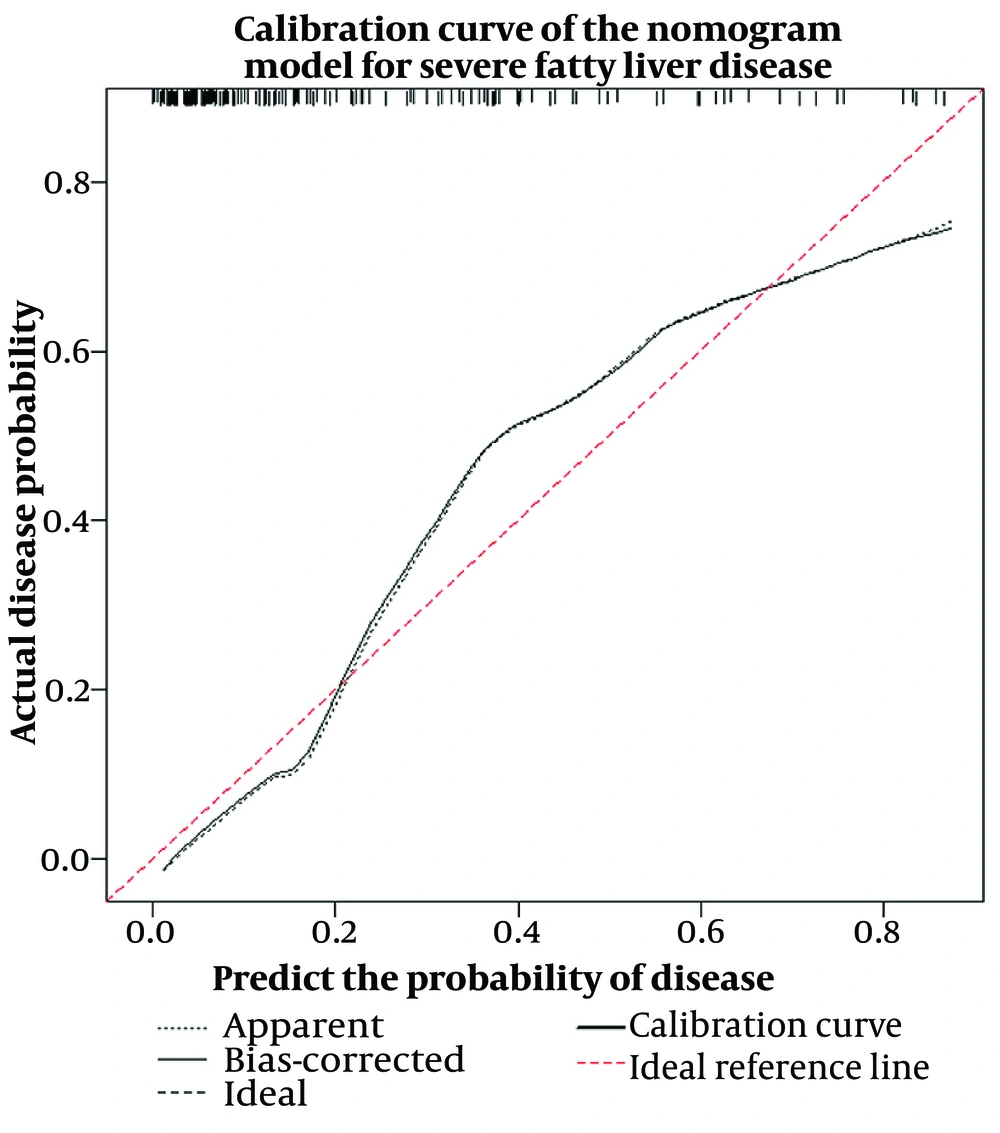
Figure 3.
Calibration curve for evaluating the accuracy of the CHOL-BMI diagnostic model. The x axis represents the predicted risk probability of the model, and the y axis represents the observed risk probability. The red dashed line denotes the ideal reference line, indicating perfect calibration. The black solid line (bias corrected) represents the model performance curve corrected using the bootstrap method with 1,000 resamples, reflecting the most likely and robust performance of the model on unseen data. The dash dot line represents the apparent curve, showing the model’s performance on the original data.
4.3.3. Clinical Utility Evaluation
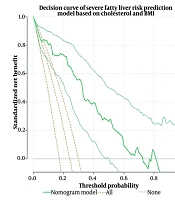
Decision curve analysis (Figure 4) showed that within a wide threshold probability range of 5%-80%, the net benefit of clinical decision-making using this nomogram model was higher than that of the treat-all and treat-none strategies. This indicates that the model has important clinical application value and can effectively assist physicians in individualized risk assessment and intervention decision-making.
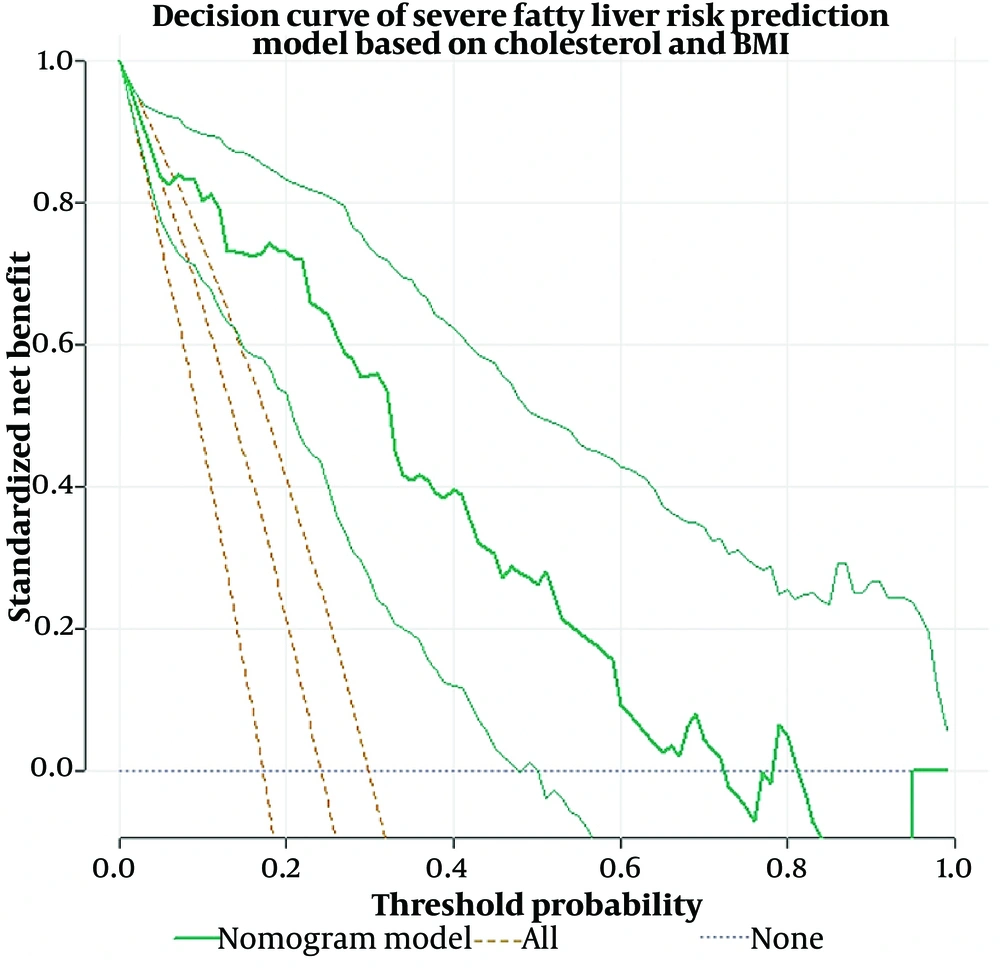
Figure 4.
DCA curve for evaluating the clinical benefit of the model. The horizontal axis represents the threshold probability, defined as the minimum risk threshold at which physicians or patients decide to take interventions (e.g., further examination, initiation of treatment). The vertical axis represents the standardized net benefit, a comprehensive indicator integrating “true positives” (benefits) and “false positives” (harms), quantifying the “net gain” of using the model strategy compared with simple strategies. The thick green solid line represents the nomogram model, showing the net benefit of decision-making using our constructed nomogram model at different threshold probabilities. The orange solid line represents the treat-all strategy, an extreme strategy of intervening in all patients regardless of risk level. The blue dash-dotted line represents the treat-none strategy, the opposite extreme of no intervention in all patients.
5. Discussion
Through systematic univariate and multivariate analyses, this study identified BMI and CHOL as independent risk factors for severe fatty liver and constructed an intuitive, simple nomogram classification model. This model requires only 2 routine clinical indicators to effectively assess an individual’s risk of severe fatty liver and has demonstrated favorable discrimination, calibration, and clinical utility.
The most important finding of this study is the central role of BMI in predicting fatty liver severity. Previous studies consistently indicate that obesity is the main driving force for the occurrence and progression of MAFLD (8). Pathophysiologically, excess body fat, especially visceral fat, has high lipolytic activity and releases large amounts of free fatty acids (9, 10), which enter the liver via the portal vein and serve as substrates for triglyceride synthesis and accumulation in hepatocytes. In addition, obesity is often accompanied by insulin resistance, which further activates the transcription factors SREBP-1c and ChREBP, thereby promoting de novo lipogenesis and triglyceride synthesis and accumulation in the liver (11). Meanwhile, chronic low-grade inflammation in obesity exacerbates hepatocyte injury and disease progression by releasing large amounts of proinflammatory adipokines, including tumor necrosis factor α and interleukin 6, and reducing anti-inflammatory adipokines, such as adiponectin (12, 13). Therefore, using BMI as a core variable in the predictive model has a solid pathophysiological basis.
Another key predictor is serum CHOL. In addition to well-recognized triglyceride metabolic disorders, cholesterol dysmetabolism has received increasing attention in MAFLD. Excessive cholesterol in hepatocytes can promote oxidative stress and inflammatory responses by inducing endoplasmic reticulum stress, mitochondrial dysfunction (14), and Kupffer cell activation (15), thereby aggravating liver injury (16, 17). Studies have shown that cholesterol crystal formation in hepatocytes is one of the key events driving the transition from simple fatty liver to MASH (18). Therefore, controlling serum cholesterol levels is important not only for managing cardiovascular risk but also for delaying fatty liver progression.
Notably, although univariate analysis showed a higher TyG index in the severe group, this association became nonsignificant after adjustment for BMI and CHOL. This may be related to the limited sample size of this study and to the strong collinearity between the TyG index, a surrogate marker of insulin resistance (19, 20), and BMI/CHOL. In addition, TyG may be more sensitive to early insulin resistance and mild fatty liver (21, 22), whereas its discriminative value may be relatively attenuated after progression to severe stages. This result suggests that, when assessing the risk of severe fatty liver, macroscopic obesity indicators and basic lipid levels may have more direct and robust utility than complex insulin resistance markers.
Current commonly used noninvasive fatty liver assessment tools in clinical practice include the Fatty Liver Index and Hepatic Steatosis Index. The Fatty Liver Index, based on BMI, waist circumference, GGT, and triglycerides, achieves an AUC of approximately 0.80 - 0.85 for screening fatty liver in the general population, with sensitivity and specificity mostly ranging from 70% to 80% (23). The Hepatic Steatosis Index, based on the ALT/AST ratio, BMI, and sex, has an AUC of approximately 0.80 - 0.82 (24). The BMI-CHOL nomogram model constructed in this study achieved an AUC of 0.888 (95% CI, 0.830 - 0.946), with 82% sensitivity and 80% specificity, showing numerically superior or comparable performance to the above models. However, direct cross-study comparisons should be interpreted cautiously because of differences in sample characteristics, fatty liver diagnostic criteria, including ultrasound vs biopsy, and outcome definitions, including the presence vs severity of fatty liver, across studies. A major advantage of this model is that it requires only 2 basic clinical indicators, BMI and CHOL, whereas the Fatty Liver Index and Hepatic Steatosis Index require 3 - 6 variables, including waist circumference and GGT, which may not be routinely available in some primary medical institutions. Thus, this model has clear value in simplifying implementation and reducing data requirements. Nevertheless, head-to-head comparison data for the Fatty Liver Index, Hepatic Steatosis Index, and this model within the same cohort are currently lacking, and future studies should perform such direct comparisons in independent external validation cohorts to clarify the incremental discriminative value of this model.
5.1. Conclusions
The nomogram classification model for severe fatty liver constructed in this study based on BMI and serum CHOL showed favorable discriminative performance and clinical applicability. It provides clinicians with a simple, intuitive tool for rapidly identifying high-risk individuals with severe fatty liver, enabling early intervention and stratified management. However, because of the cross-sectional design and small sample size, the model’s stability should be interpreted with caution. Future multicenter, large-sample prospective studies are needed for external validation and to continuously optimize the model.
5.2. Limitations
This model has not undergone external validation, and its generalizability across different medical settings and populations remains unclear. Furthermore, the model was constructed using cross-sectional data, which can discriminate only the current severity of fatty liver and cannot assess causal associations or predict future disease progression. Clinical decisions should be combined with other examination methods, and results should be interpreted cautiously. In addition, this study included only 39 patients with severe fatty liver, and the relatively small sample size may result in limited statistical power and require further validation of model stability, as regression coefficients may change because of sampling fluctuations. Therefore, this model should be regarded as a preliminary exploratory tool rather than a mature substitute for clinical decision-making.