
Introduction
Experimental
Result
Discussion
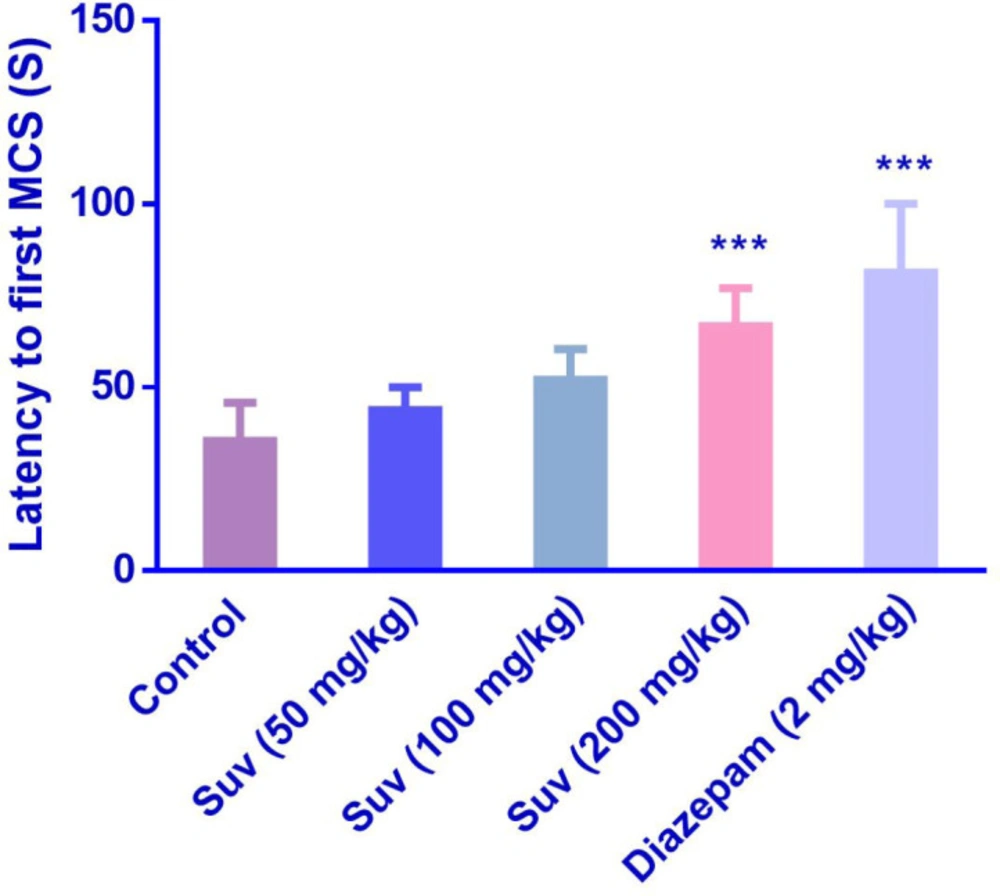
Effect of suvorexant on the latency to the first minimal clonic seizure (MCS) in PTZ-induced seizure in mice. Data are presented as mean ± SEM. Tukey Kramer, ***p < 0.001 vs control, n = 6
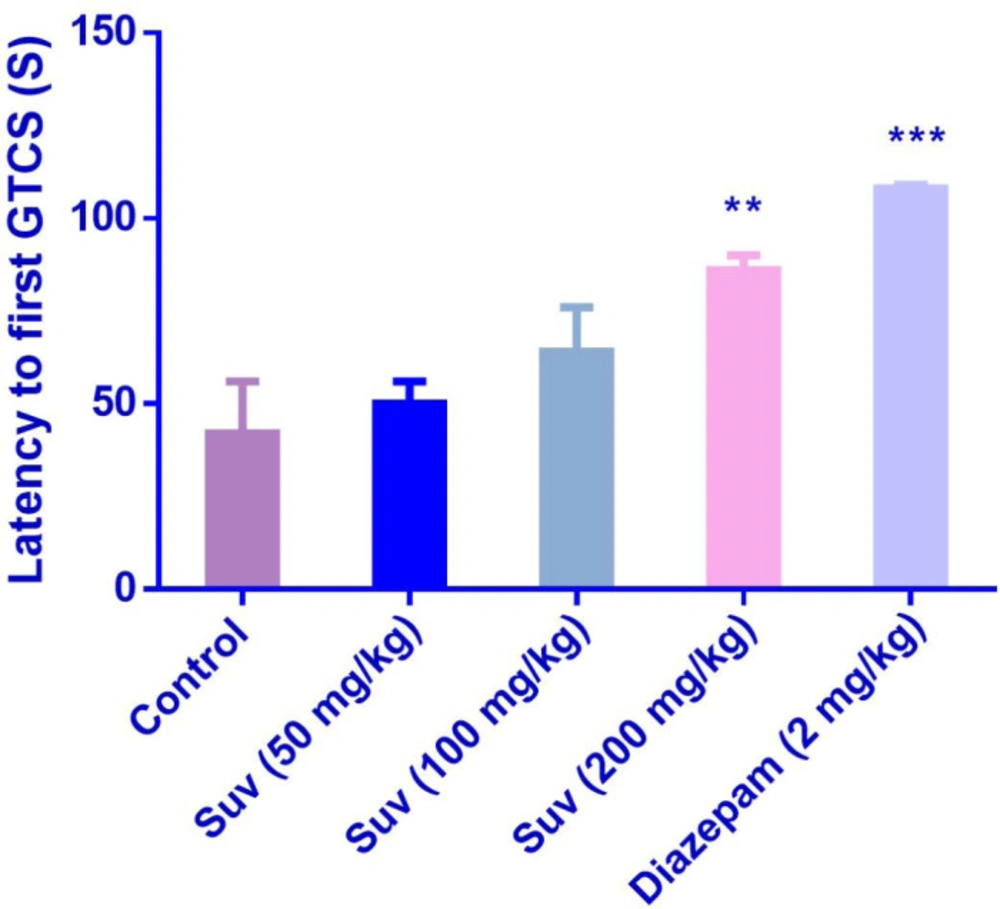
Effect of suvorexant on the latency to first generalized tonic-clonic seizure (GTCS) in PTZ-induced seizure in mice. Data are presented as mean ± SEM. Tukey Kramer, **p < 0.01 and ***p < 0.001 vs control, n = 6
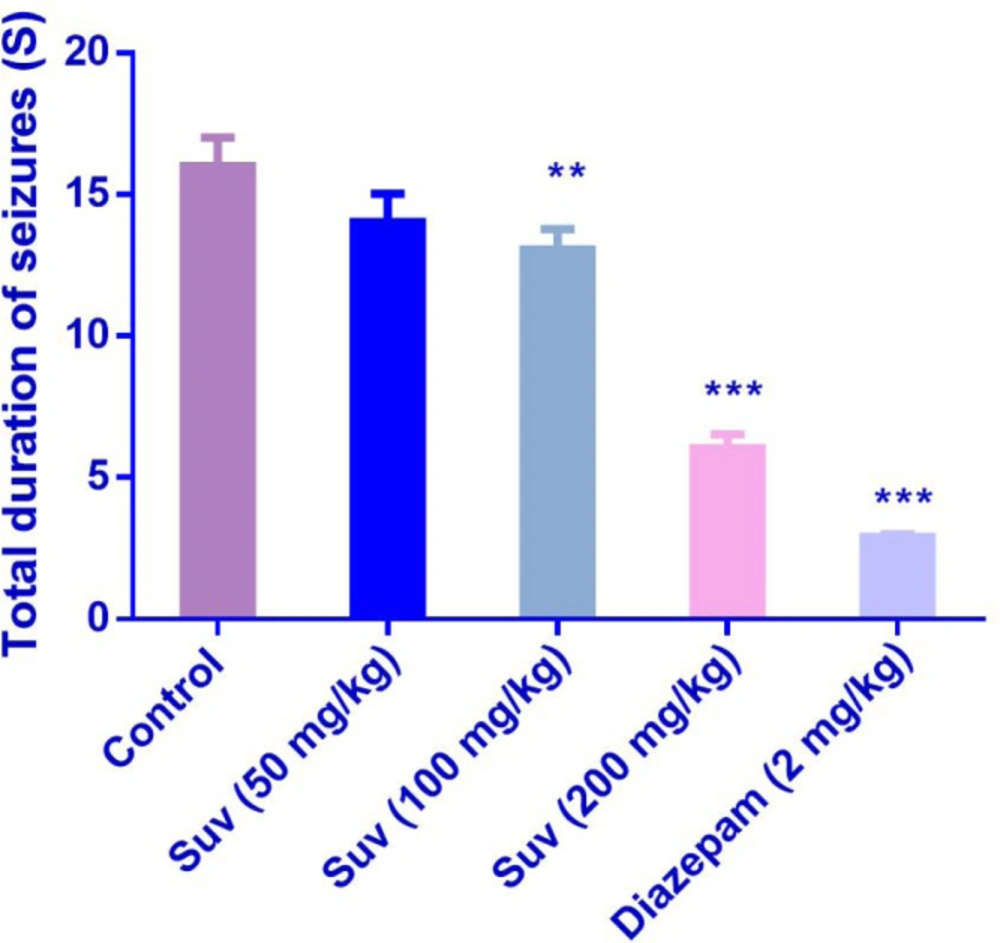
Effect of suvorexant on total duration of seizures in PTZ-induced seizure in mice. Data are presented as mean ± SEM. Tukey Kramer, **p < 0.01 and ***p <0.001vs control, n = 6
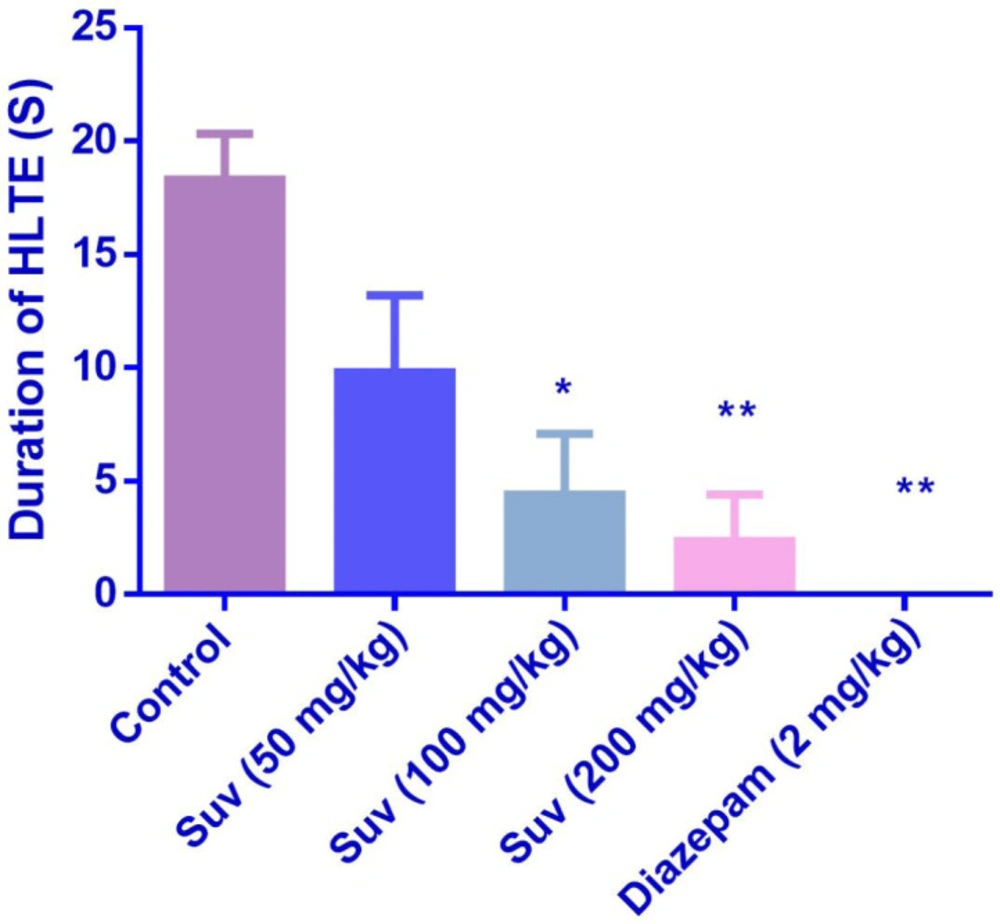
Effect of suvorexant on duration of hind limb tonic extension (HLTE) in MES-induced seizure in mice. Data are presented as mean ± SEM. Tukey Kramer, *p < 0.05 and **p <0.01 vs control, n=6
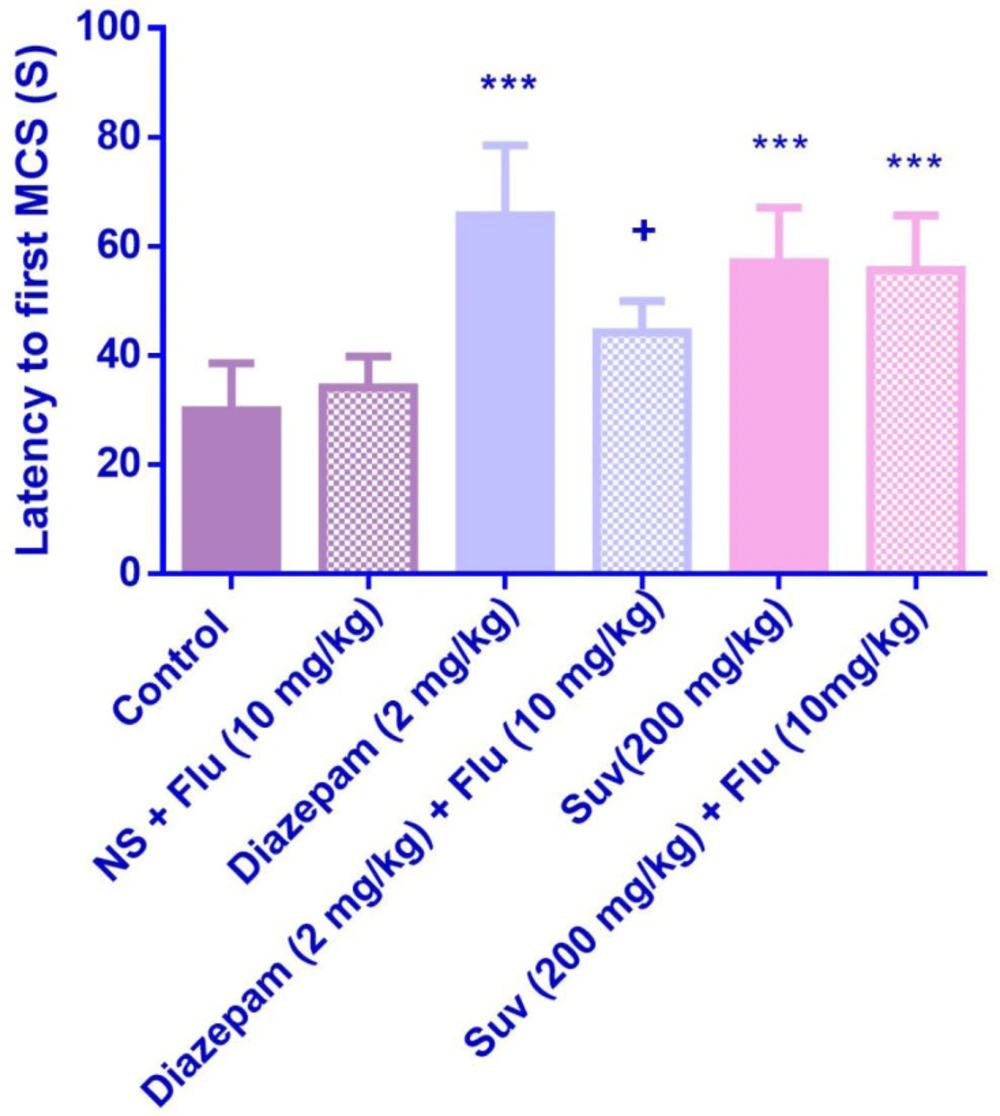
Effect of suvorexant on the latency to first minimal clonic seizure (MCS) in PTZ-induced seizure in the presence and absence of flumazenil in mice. Data are presented as mean ± SEM. Tukey Kramer, ***p < 0.001 vs normal saline, + p < 0.05 vs agent received flumazenil. n=6. (N.S=normal saline, Flu= flumazenil).
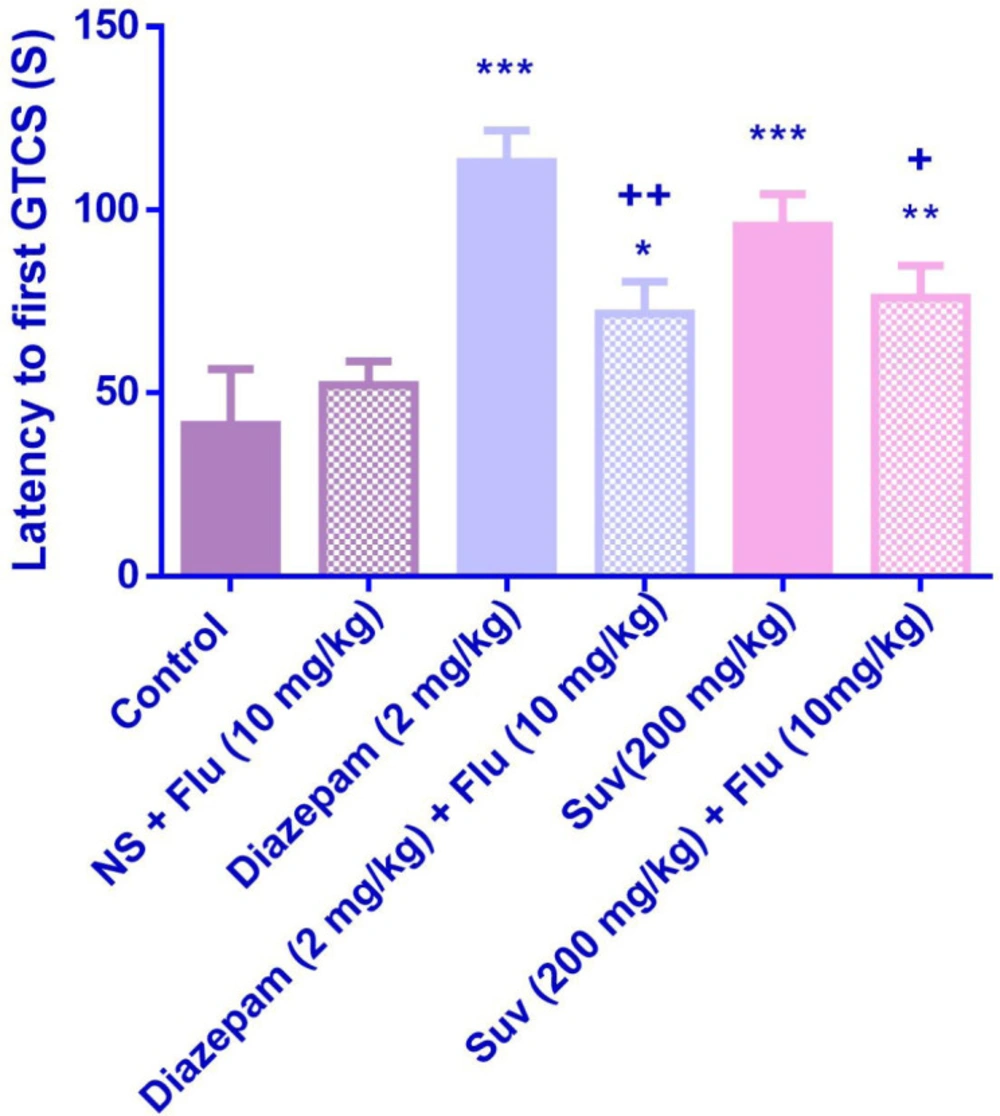
Effect of suvorexant on the latency to first generalized tonic-clonic seizure (GTCS) in PTZ-induced seizure in the presence and absence of flumazenil in mice. Data are presented as mean ± SEM. Tukey Kramer, *p < 0.05, **p < 0.01 and ***p < 0.001 vs normal saline, +p <0.05 and ++p < 0.01vs agent received flumazenil. N = 6. (N.S=normal saline, Flu= flumazenil).
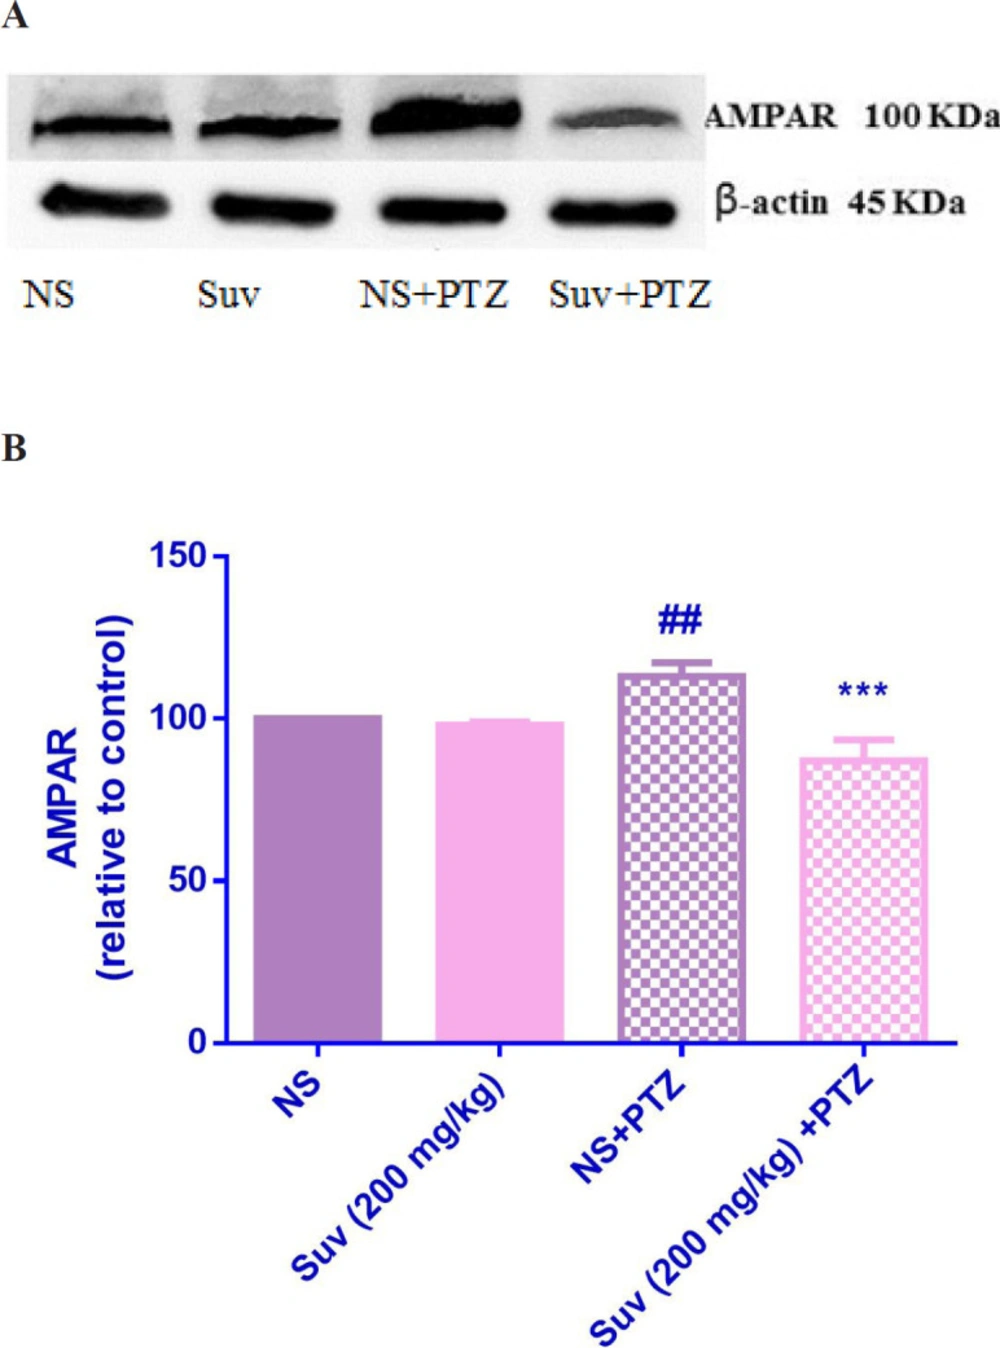
Effect of suvorexant on the protein level of AMPAR in the mice hippocampus. Suvorexant was administrated for seven days. After seizure induction by PTZ, hippocampus was dissected. Representative western blots showing specific bands for AMPAR and b-actin as an internal control. Equal amounts of protein sample (50 µg) obtained from whole hippocampus homogenate were applied in each lane. These bands are representative of four separate experiments. (B) Densitometric data of protein analysis. Data are expressed as the mean ± SEM. ##p < 0.01 vs normal saline, ***p < 0.001 vs PTZ+ normal saline. NS (normal saline), SUV(suvorexant), PTZ(pentylenetetrazol).
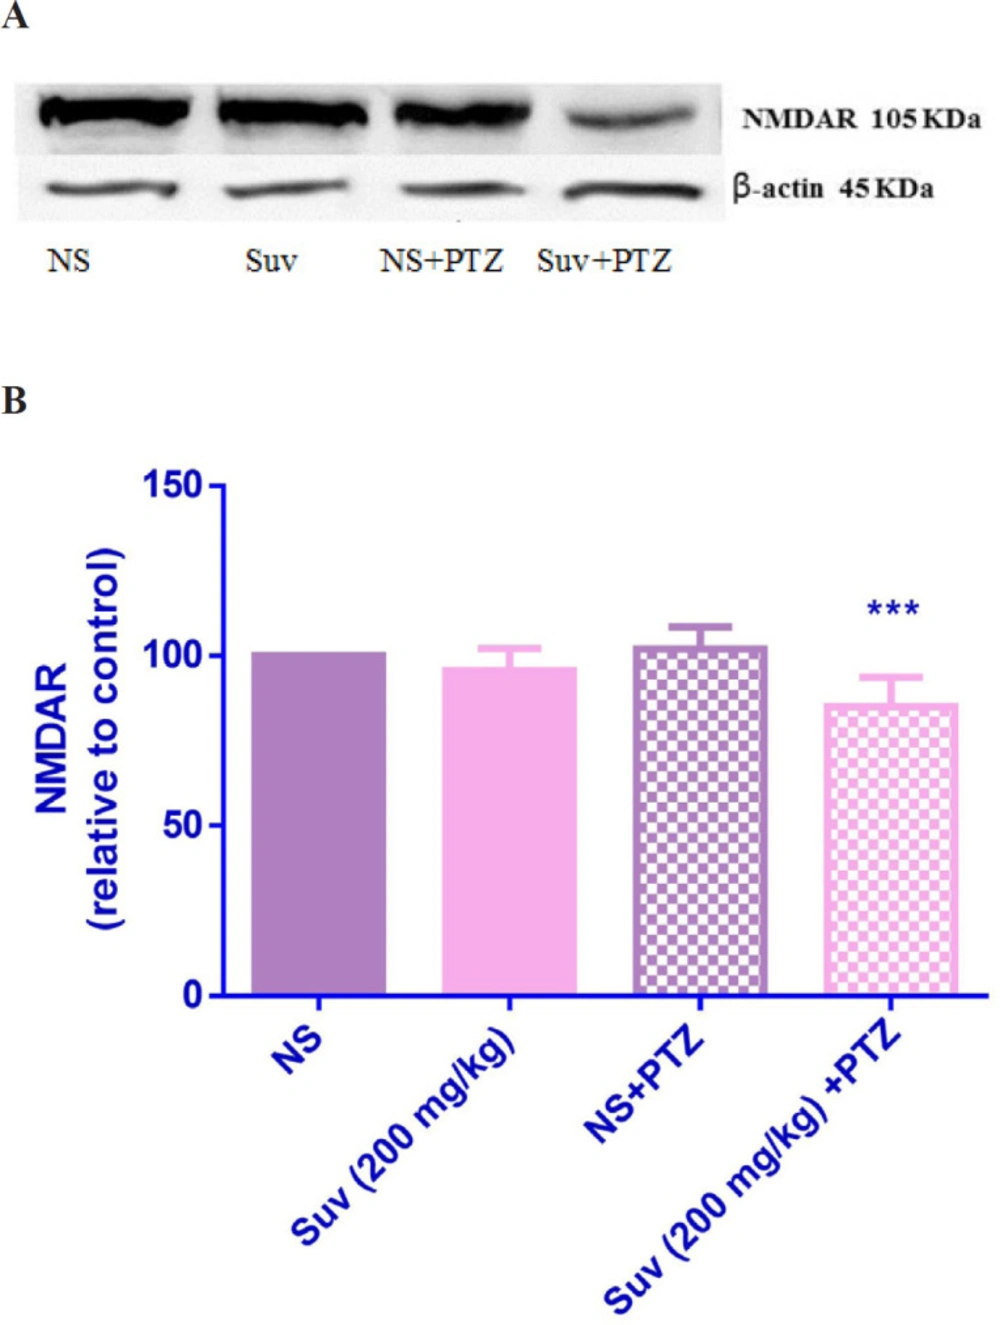
Effect of suvorexant on the protein level of NMDAR in the mice hippocampus. Suvorexant was administrated for seven days. After seizure induction by PTZ, hippocampus was dissected. Representative western blots showing specific bands for NMDAR and β-actin as an internal control. The equal amounts of protein sample (50 µg) obtained from whole hippocampus homogenate were applied in each lane. These bands are representative of four separate experiments. (B) Densitometric data of protein analysis. Data are expressed as the mean ± SEM. ***p < 0.001 vs PTZ+ normal saline. NS (normal saline), SUV (suvorexant), PTZ (pentylenetetrazol).
| Group | Protection |
|---|---|
| Control | 33.3 |
| Suvorexant 50 mg/kg | 66.6 |
| Suvorexant 100 mg/kg | 83.3 |
| Suvorexant 200 mg/kg | 83.3 |
| Diazepam 2 mg/kg | 100 |
| Group | Protection |
|---|---|
| Control | 33.3 |
| Suvorexant 50 mg/kg | 66.6 |
| Suvorexant 100 mg/kg | 83.3 |
| Suvorexant 200 mg/kg | 83.3 |
| Diazepam 2 mg/kg | 83.3 |

