Collection of Macroalgal Material
Marine macroalgal species were collected from coastlines of Izmir Gulf. All macroalgal specimens belong to Chlorophyta, Rhodophyta and Phaeophyceae were placed in the labelled plastic bags (approximately 0.5-1 kg wet weight) and immediately transported to the laboratory in cooled containers. To remove sand and epiphytes, algal thalli were gently rinsed in seawater. Taxonomic identification was done in terms of their morphology. Specimens had been stored at -20 °C until experiments begun. The voucher specimens are preserved in the Herbarium of Ege University.
Preparation of Macroalgal Extracts
Wet tissues from each species were lyophilized. One gram of powder was extracted with 10 mL of methanol (Labscan, TH) by shaking in an orbital shaker at 300 rpm overnight at +4 °C. Extracts were then centrifuged at 4000 rpm for 10 min and supernatants were collected. Collected supernatants were placed in orbital shaker and extraction was initiated again. This procedure had been repeated for 10 days. After 10 days of extraction/centrifugation cycle, the collected solvent was removed by rotary evaporation and powders of the crude extracts were dissolved in methanol for Thin Layer Chromatography (1 mg mL-1) and DMSO (dimethyl sulfoxide, Sigma-Aldrich, USA; 10 mg crude extract per mL) for further experiments. All sample stored at -20 °C.
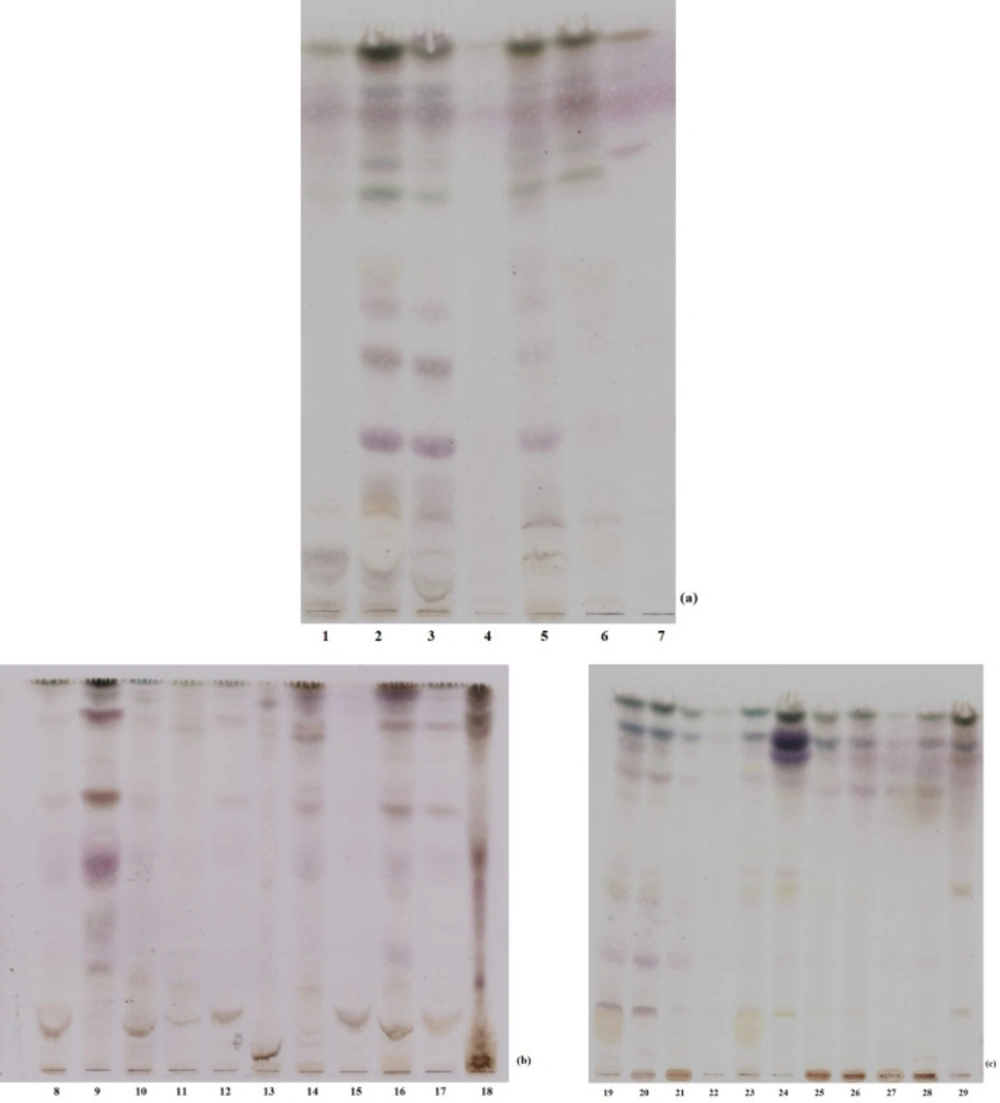
Thin Layer Chromatography
Extraction efficiency was roughly evaluated by thin layer chromatography. Crude macroalgal methanol extracts were dissolved in methanol (1 mg mL-1). Individual samples were loaded four times on silica coated aluminum TLC (Merck, DE) plate as a dash. The solvent system was chloroform: ethyl acetate: methanol (5: 5: 1, v/v; Sigma-Aldrich, USA, Riedel- del Hansen, DE; Labscan, TH, respectively). As the solvent slowly migrated up the plate, the components of the extract migrated up at different rates. Individual extracts were separated into different coloured dashes. The TLC profiles of plates were visualized after dipping into hydrochloric acid/methanol (1: 9, v/v; Sigma-Aldrich, USA; Merck, DE) and heating until getting dark. All the coloured or invisible dashes were observed as dark dashes on plates.
Antioxidant Assay with β-carotene/linoleic acid system
The β-carotene/linoleic acid activities of samples were evaluated by β-caroten bleaching system with the minor modifications for 96-well plate (
37)gallic acid (GA. Eight microliter of linoleic acid (Sigma-Aldrich, USA) were pipetted into eppendorf containing 800 µl of β-carotene (Sigma-Aldrich, USA; 1 mg mL
-1) in chloroform (Sigma-Aldrich, USA; 1 mg mL
-1) and added 80 µL of Tween 40 (Sigma-Aldrich, USA). The chloroform was blown away by nitrogen flow. This mixture was pipetted slowly in 20 mL of distilled water with vigorous agitation to form an emulsion. Twenty microliter of blank (ethanol), positive control (BHA: Buthyl-4-hydroxyanisole, 30 mg mL
-1) or samples (5 mg mL
-1) were loaded 96-well plate and added 200 µL of the emulsion and the absorbance was measured immediately at 450 nm. The plate was placed in a dark room for 90 min. The absorbance was measured again. All measurements were carried out in triplicate. The antioxidant activity of extracts was evaluated using the following Equation:
AA (%) = [1 - (A0 - A90)/(A’0 - A’90)] × 100
Where the A0 and A’0 are the absorbance values measured at zero time of the sample and the control, respectively, and A90 and A’90 are the absorbance values measured at 90 min of the sample and the control.
Cell Culture and Microscopy
All studied cell lines were kindly provided by Ege University Medical School Department of Medical Oncology. Breast cancer cell line MCF-7 was cultured in RPMI medium (Lonza, CH) with 10% fetal bovine serum (Biological Industries, USA) and penicillin-streptomycin (100 U mL-1; Sigma-Aldrich, USA) supplement. Cultures were maintained in CO2 incubator with standard incubation conditions. Cells were treated with different concentrations of macroalgal methanol extracts reconstituted in dimethyl sulphoxide (DMSO; Sigma-Aldrich, USA) and diluted with proper media for viability experiments. For each experimental procedure, appropriate concentration of vehicle (DMSO) was used as a carrier control. Human colon adenocarcinoma cell line HT29 was cultured in McCoy’s 5A Medium (Biochrom, UK) with 10% fetal bovine serum (Biological Industries, USA), penicillin-streptomycin (100 U mL-1; Sigma-Aldrich, USA) and 1% L-glutamine (Gibco, USA) supplement. Cultures were maintained in CO2 incubator with standard incubation conditions in 96-well plates.
Enzyme Inhibition Tests
α-glucosidase enzyme inhibition test
The enzyme inhibition activity of extracts for α-glucosidase was assessed using the PNG (4-nitrophenil-α-D-glucopyranoside; Sigma-Aldrich, USA) as substrate and Saccharomyces cerevisiae α-glucosidase as enzyme (Sigma-Aldrich, USA) with 96-well plates. Fifty microliter of PBS (100 mM; pH 7.5) were loaded into wells and 2 µL of samples (1 mg mL-1), acarbose (250 mg mL-1; as positive control) or PBS (for enzyme reaction) were added. Fifteen microliter of α-glucosidase was added, except for blank. The plate was pre- incubated at 37 °C for 10 min. Fifteen microliter of PNG (3 mM) was added into wells and the plate was incubated at 37 °C for 30 min. The enzymatic hydrolysis of substrate was monitored by the amount of ρ-nitro phenol released in the reaction mixture at 410 nm where the enzymes were replaced buffer. The inhibition percentage of α-glucosidase was assessed by following Equation:
Inhibition (%) = [1 - (Ae - As)] × 100
Where the Ae is the absorbance value of enzyme reaction and As is the absorbance value of extract added reaction.
Pancreatic lipase enzyme inhibition test
Pancreatic lipase enzyme inhibition test was designed as fluorometric assay for 96-well plates (black flat bottom). Fifty microliter phosphate buffer with CaCl2 (Ca-PBS; 0.1 mM CaCl2, pH 7.5), 50 µL of pancreatic lipase (Sigma-Aldrich, USA; 2 mg mL-1) were loaded into wells. Twenty microliter of sample (5 µg mL-1), orlistate (Sigma-Aldrich, USA; positive control, 15 mg mL-1) or Ca-PBS (for enzyme reaction) were added and then the plate was pre-incubated at 37 °C for 10 min. After the pre-incubation, 100 µL of 4-methylumbelliferyl oleate (4-MU; Sigma-Aldrich, USA; 0.1 mM) was pipetted into wells and the plate was incubated 37 °C for 30 min. The amount of 4-MU released by the lipase measured using a fluorescence spectrometer at an excitation wavelength of 320 nm and an emission wavelength of 450 nm. The inhibition percentage of pancreatic lipase was assessed by following Equation:
Inhibition (%) = 100 - (As × 100)/Ac
Where As is the absorbance value of extract added reaction, Ac is the absorbance value of enzyme reaction.
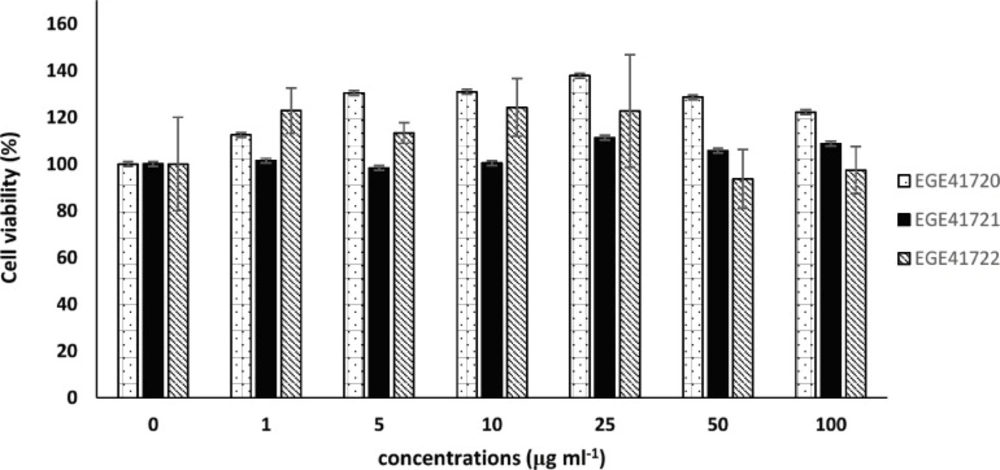
Inhibition of Cell Viability
Growth inhibitory effects of extracts were investigated via mitochondrial dehydrogenase activity by WST-8 colorimetric assay kit (Sigma-Aldrich, USA). Briefly, MCF7 cells were seeded in 96-well plate 10 × 103 cells per well and incubated overnight for both cell attachment and growth. Macroalgal extracts were added to wells in different final concentrations (0, 1, 5, 10, 25, 50 and 100 µg mL-1) with six repeats. Maximum DMSO concentration was 1%. After 72 h of incubation, 10 μL of WST-8 reagent was added to wells and plates were incubated at 37 °C for 15 min for the formation of color. Absorbance was measured at 450 nm on multi-well spectrophotometer. Untreated cell viability was considered as 100% and extract-treated cell viabilities were calculated accordingly. IC50 (inhibitory concentration 50) values were calculated using CalcuSyn v2.0.
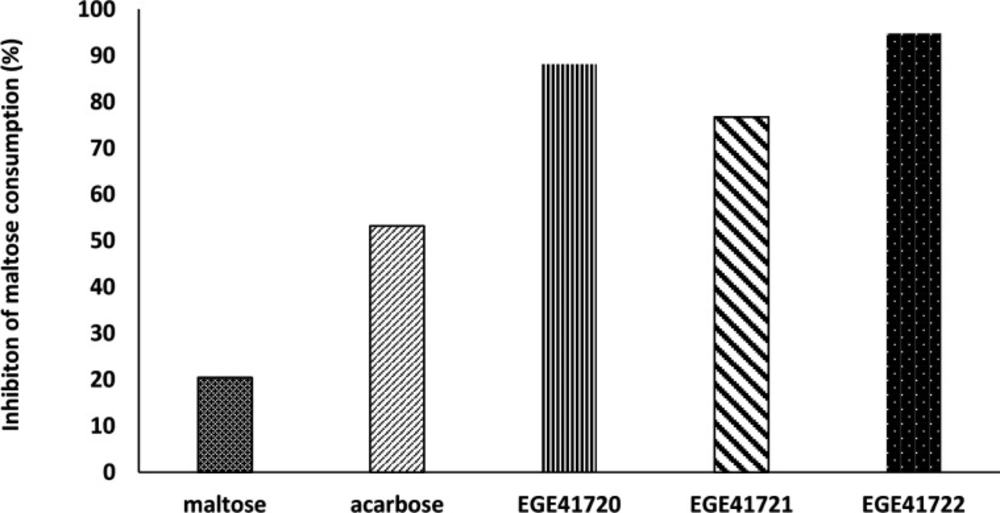
Determining of Maltose Consumption
α-glucosidases is a glucosidase which breaks down the 1,4-α bonds in starch or disaccharides to produces glucose (
38) Maltose disaccharide was used as sole carbon source in experimental media to observe α-glucosidase activity and effects of extracts on it. Maltose concentrations were adjusted to glucose concentration of McCoy’s 5A medium. Acarbose was positive control for inhibition. The decrease of maltose level in experimental media showed us maltose consumption, indirectly. Stable maltose levels were considered as indicator for inhibition activity of acarbose or extracts.
After confluence of HT29 cells, McCoy’s 5A- based media was removed and wells were gently washed with PBS, then 200 µL of three experimental media were added to the wells, individually: (i) PBS with maltose (28 mM), (ii) PBS with maltose (28 mM) and acarbose (250 mg mL-1), (iii) PBS with maltose (28 mM) and extract (10 mg mL-1). After 37 °C for 6 h incubation period, 100 µL of experimental media were transferred clean Eppendorf tubes. Maltose- Glucose Assay Kit (Abcam, UK) was used to determine and calculate the decrease of maltose concentrations.
Statistical Analysis
Standard deviations of enzyme inhibition tests were calculated using Microsoft Office Excel and IC50 values were determined by CalcuSyn 2.0 software.