Chemicals
Aluminium hydroxide (Al(OH)3) (Alum), ovalbumin, AM1241, AM630, dimethyl sulfoxide (DMSO), glacial acetic acid, gentian violet solution, giemsa stain, trichloroacetic acid (TCA), thiobarbituric acid (TBA), Na2HPO4, 5,5′-Dithiobis(2-nitrobenzoic acid) (DTBN), and sodium citrate were purchased from Sigma-Aldrich (St. Louis, MO, USA).
Animals
Male Wistar rats weighing 180-250 g were used in this study. The animals were provided from the Experimental Research Center of Adiyaman University. The ethical permission for the study were taken from the Adiyaman University Animal Experiments local ethics committee (Ethics Committee decision no. 2018/15) and the study was conducted in Adiyaman University. Animals housed at 22±1 °C under 12:12 h light-dark cycle. The animals were allowed free access to standard laboratory chow and water. All procedures complied with the standards for the care and use of animals as stated in Guide for the Care and Use of Laboratory Animals. Before experiment, in each group, six rats were randomly divided into 5 groups.
Experimental Design
Animal Sensitization and Challenged
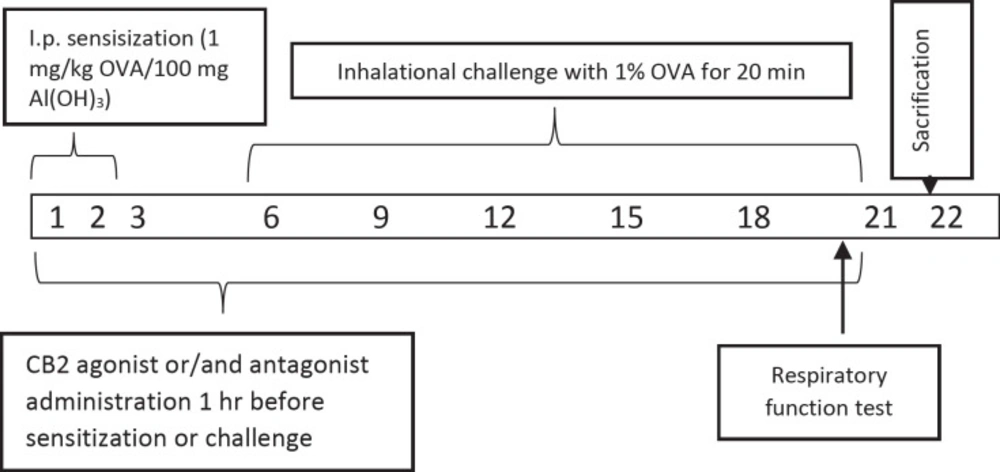
In previous studies the rats were used successfully to set the allergic airway inflammation model (
22–
24). Briefly, all rats in the group except saline control group were given 100 mg of Alum in 0.9% sterile saline with 1 mg / kg of OVA per day intraperitoneally for 3 days (
23). Alum was given as adjuvant due to boost the immune response to produce more antibodies and long-lasting immunity. All animals in groups from, but saline control group, the 6th, 9th, 12th, 15th, 18th, and 21th days of the experiment were challenged to inhalation with 1% OVA whole-body nebulizer for 20 min a day for 0.8 m
3 (n = 6). All the animals were sacrificed on day 22 (
Figure 1). Doses of CB2 agonists and antagonists have been referenced from the previous studies (
25).
Experimental groups
Experimental groups are Group 1. Saline Control, Group 2. Ovalbumin (OVA), Group 3. Ovalbumin + CB2 agonist (OVAA), Group 4. Ovalbumin + CB2 antagonist + agonist (OVAA+A) and Group 5. DMSO (2% v/v in saline) (OVA + Vehicle).
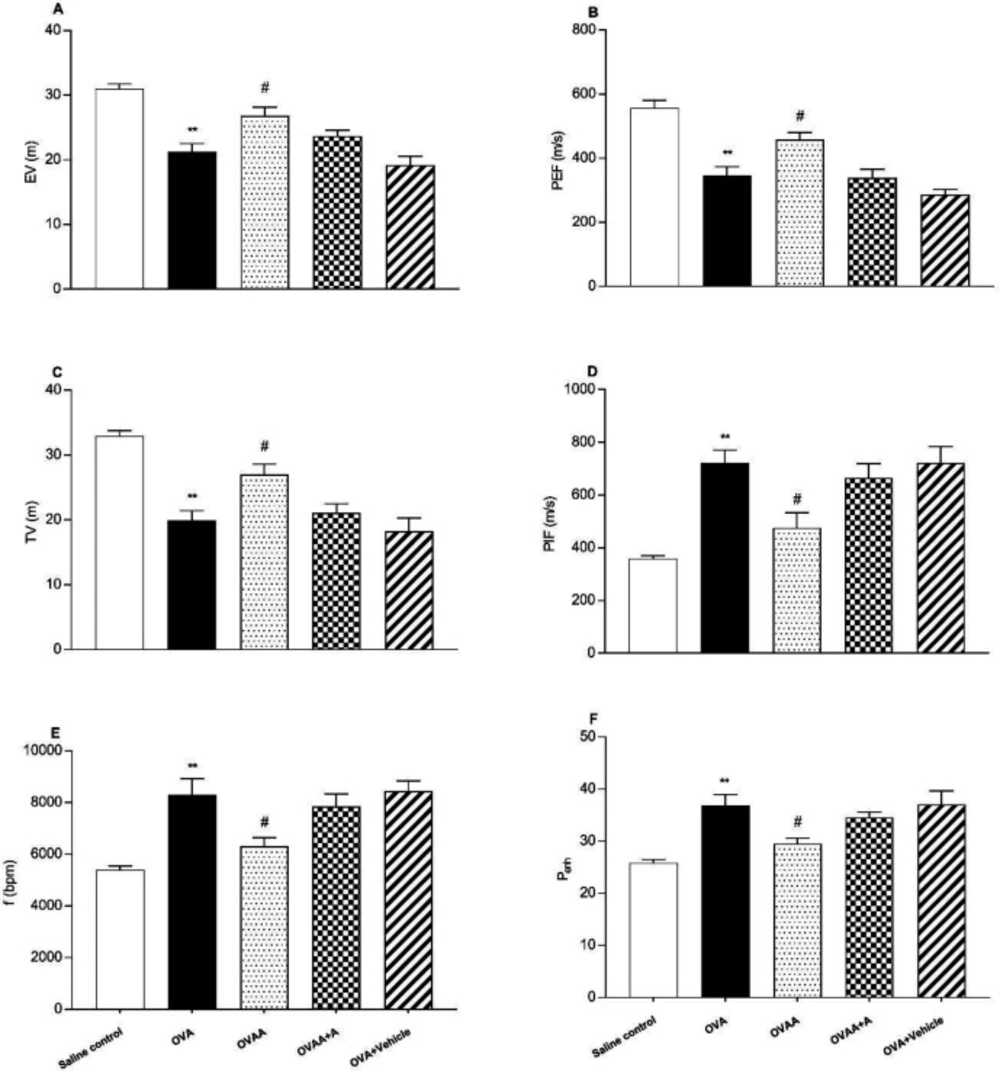
Measurement of Pulmonary Function Tests
Pulmonary function tests (PFT) were recorded on the 22st day of the experiment using whole body plethysmography (Emka Technologies, Paris, France) as in the previous studies (
26–
28). In the present study, Peak inspiratory flow (PIF), Peak expiratory flow (PEF), expiratory volume (EV), tidal volume (TV), the frequency of breathing (f), and enhanced pause (P
enh) value were measured. The rats were allowed to enter the room for 15 min without recording. The recordings were performed for 10 min to form the baseline values.
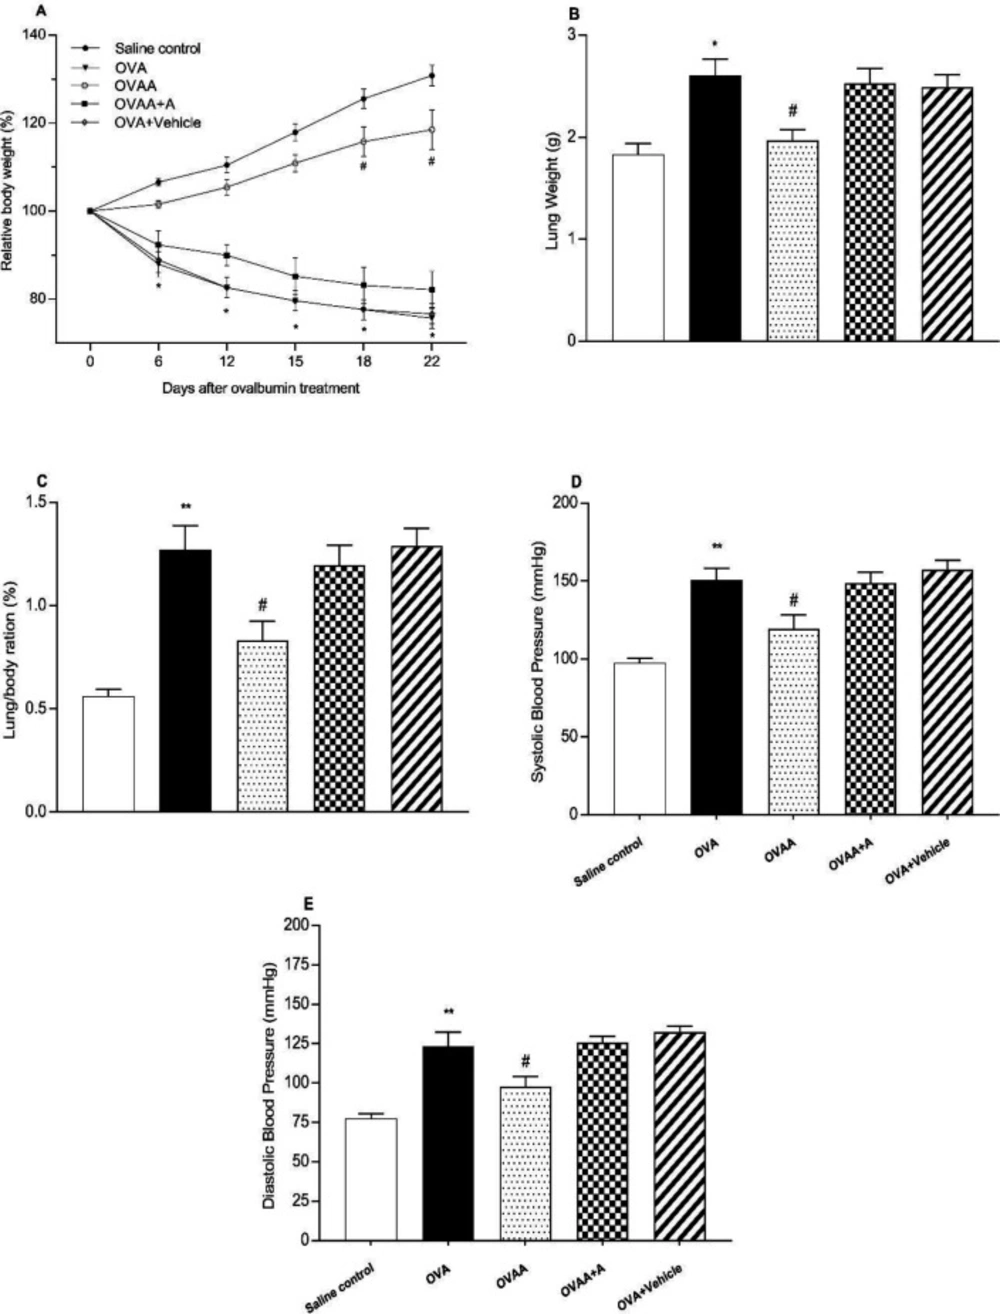
Determination of RAT weights
The Weights of the animals which are in group of 22th day were recorded by being measured periodically for all application groups during the experiment. The ratio of lung weight to body weight was calculated according to formula (lung/body weight) * 100.
Measurement of systolic and diastolic blood pressure
Systolic (S) and diastolic (D) blood pressures of the animals which are in group of 22th day was recorded by being measured for all application groups during the experiment by using Noninvasive Blood Pressure Measurement System (May, NIBP250).
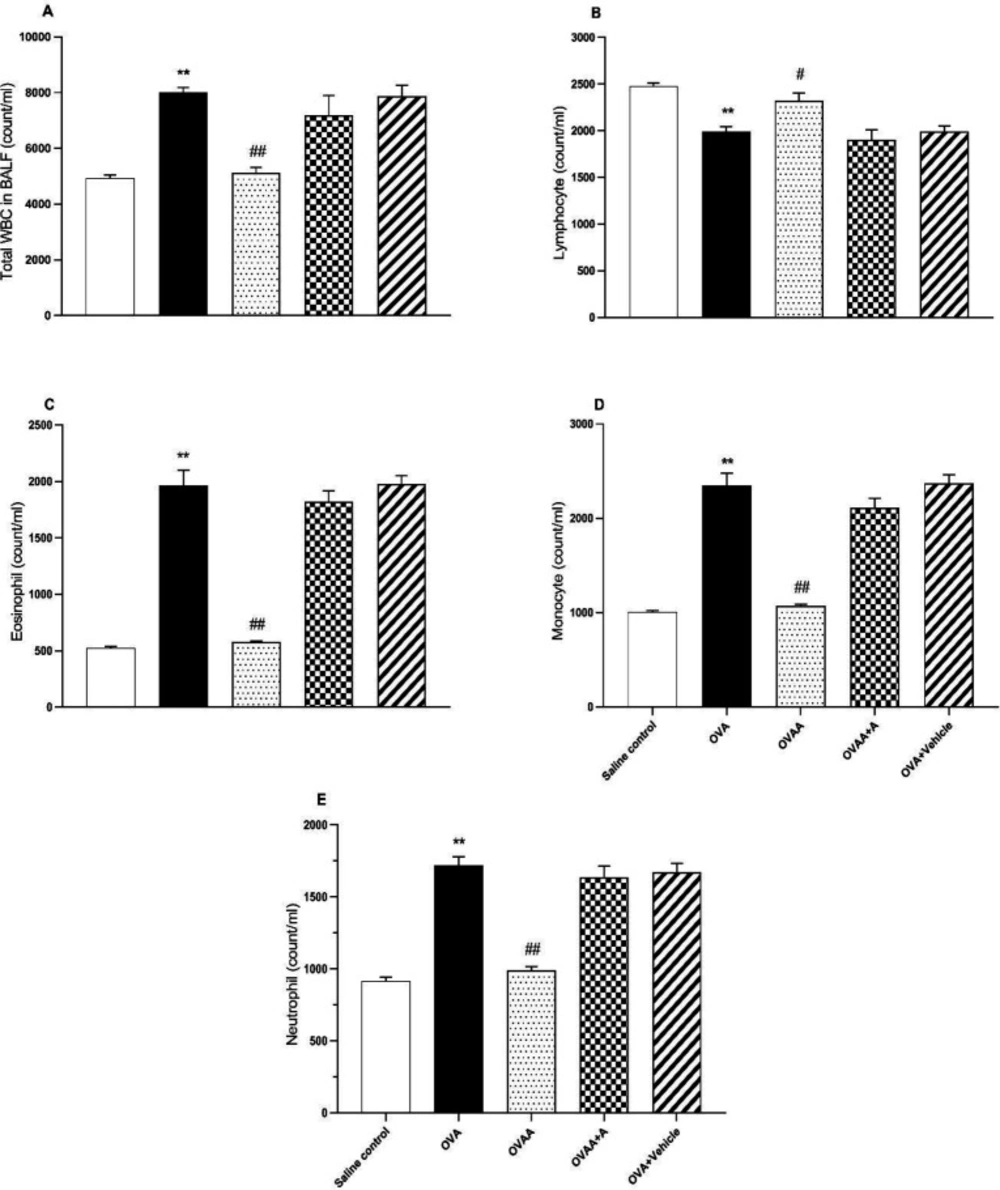
Collection of bronchoalveolar lavage fluid and its determination
On the 22
th day after 24 h of the last treatment, the rats were anesthetized with ketamine (100 mg kg-1, I.P) and harvested 3 ml blood samples from vena jugularis and sacrificed. Thorax was opened by a median incision and trachea was cannulated with a plastic catheter attached to 10 mL syringe. After bronchoalveolar lavage (BALF) was performed with a total volume 25 mL sterile saline in 5 mL portions, with gentle massage of lungs they were combined. To determine total leukocyte count, 1 mL of BALF was stained by Turk solution (1 mL glacial acetic acid, 1 mL gentian violet solution 1% and 100 mL pure water) and total White blood cells (WBC) were determined in duplicate using a hemocytometer (
22,
29). The rest of BALF centrifuged at 300 g for 10 min at 4 °C to obtain the supernatant for oxidant studies (
7) and cells were collected for cell counts from cell pellet. The cell samples from the cell pellet were diluted with 200 µL saline, followed by rubbing onto a 20 µL sterile slide and allowed to dry. The cells were stained with Giemsa to analyze cellular differentiation of macrophages, neutrophils, and lymphocytes. To determine the ratio of cells to WBC, 100 cells were counted under light microscopy and cell types were determined as percentage (
30).
Preparation of lung tissue
The lungs were gently separated from the bronchi and the lungs were weighed, washed with cold saline and homogenized in isotonic saline. The homogenates were transferred to tubes and stored at -20 °C until the experiments were performed.
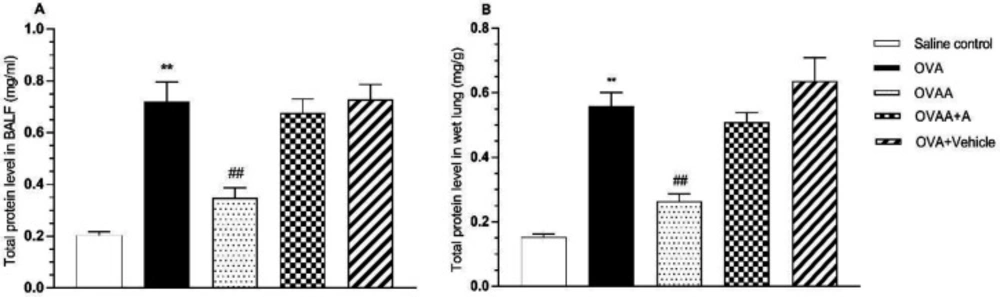
Determination of Total Protein
ELISA procedures were used to determine marker levels as biochemical. Piercetm BCA Protein Assay Kit (Thermo Scientific) was used for the determination of total protein in tissue and BALF.
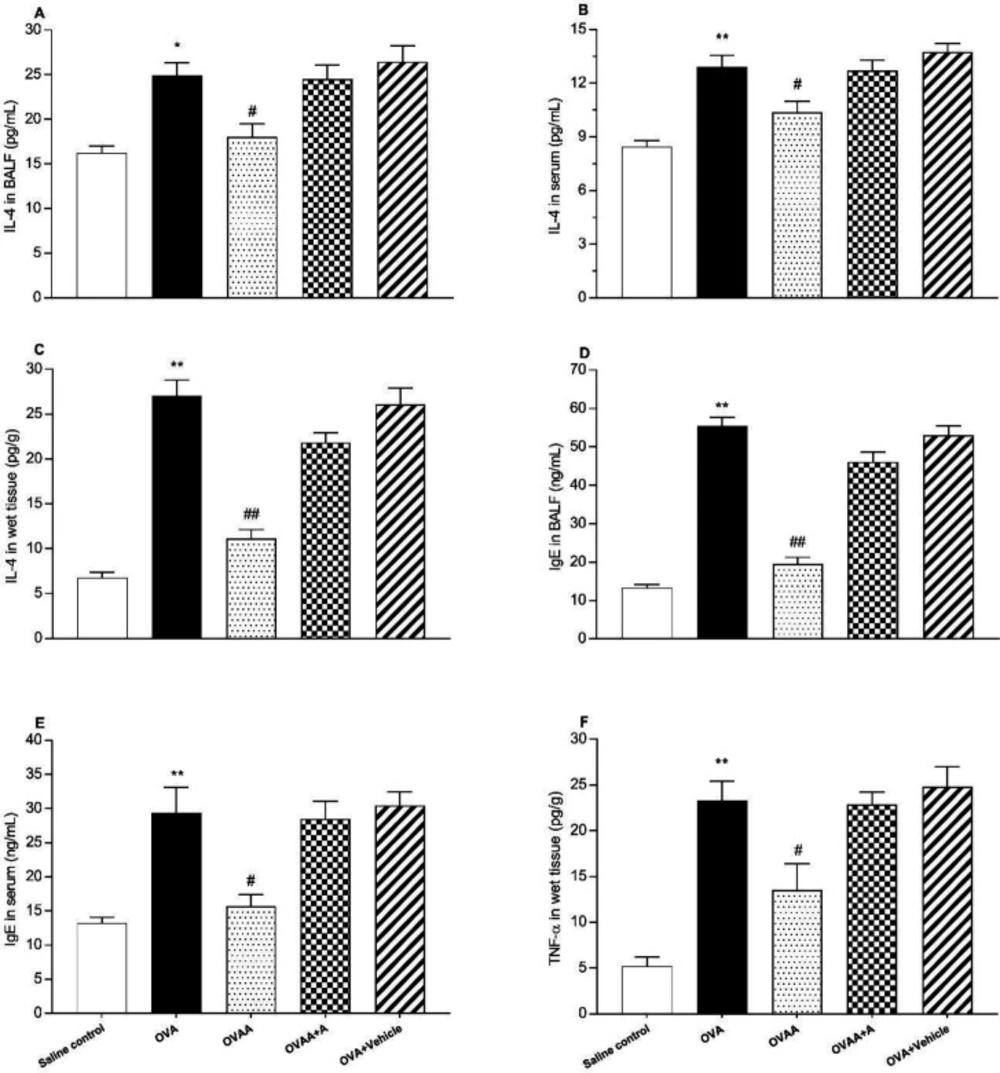
Determination of IL-4, TNF-α, and IgE levels
IL-4, TNF-α and IgE were measured in lung homogenate, serum and BALF using ELISA kits for rat (Abcam ab100770, ab46070 and ab157736, Istanbul/Turkey, respectively) and this process was performed 2 times, as described by the manufacturer (
31,
32) and the results expressed as pg/g wet tissue, pg/mL of serum or BALF.
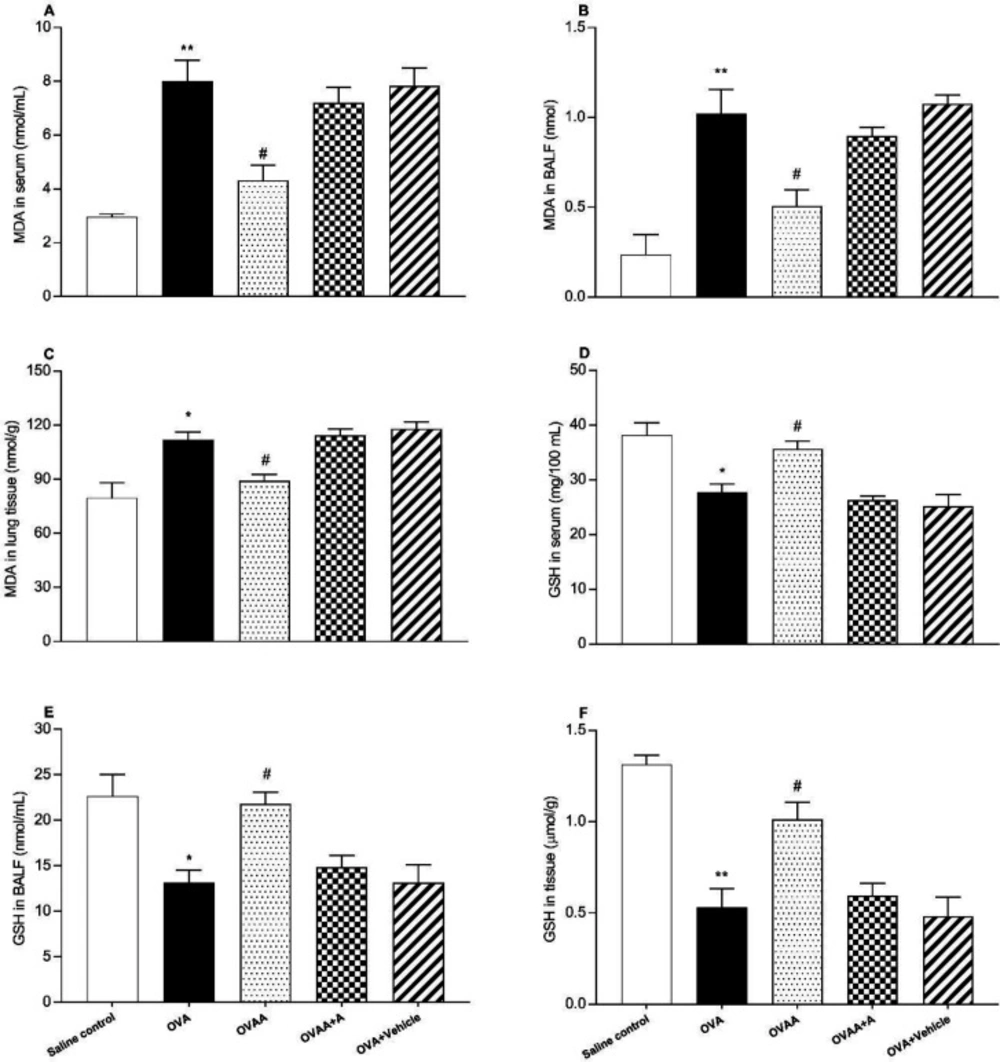
Evaluation of MDA content
Malondialdehyde (MDA) measurements in lung tissue, serum and BALF. The lipid peroxide levels, as MDA concentrations, in the lung tissues were according to the method previously described (
33). Briefly the tissue samples were homogenized in an ice bath, ice-cold TCA by adding 10 mL of 10% TCA per g of tissue, with an ultrasonic tissue homogenizer. After two consecutive centrifugations at 3,000 g for 15 min, 500 µL supernatant was mixed with equal volume of 0.67% TBA and heated to 100 °C for 15 min. The absorbance of the samples was then measured by using spectrophotometry at 535 nm. Each assay was performed in duplicate.
Determination of GSH level
Glutathione (GSH) levels in lung tissue, serum and BALF were measured by a modified Elman method (
34). Briefly, lung tissues were homogenized in 10 mL TCA which is at the rate of 10%. It was then centrifuged at + 4 °C for 15 min. Afterwards, 0.5 ml of supernatant was taken, and mixed with 0.3 M 2 mL Na
2HPO
4. The mixture was thoroughly vortexed. This mixture was vortexed by the addition of 0.2 ml DTBN (prepared by dissolving in 1% sodium citrate). Finally, it was measured at 412 nm by using spectrophotometry.
Statistical analyses
Average values of ventilatory variables were obtained on a minute by minute basis using data analysis software (DataAnalyst; EMKA). All values are reported as mean ± standard deviation. Statistical analysis was performed using one-way analysis of ANOVA. Statistical significance was set at p< 0.05. Data analysis was performed by using GraphPad Prism 7.0 software (GraphPad, San Diego,USA).