
Introduction
Experimental
Results
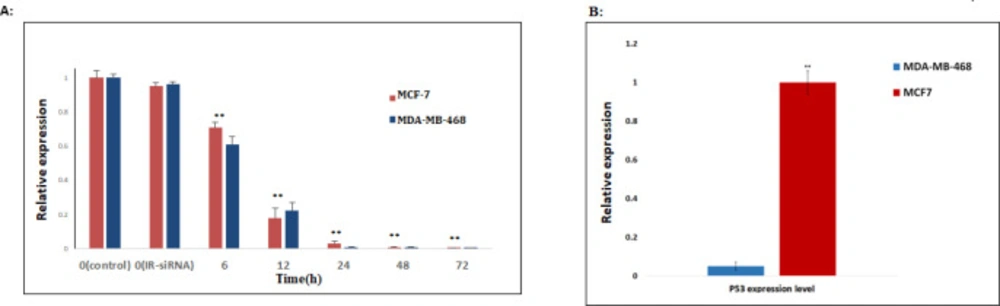
NS-siRNA reduced NS expression in MCF-7 and MDA-MB-468 human breast cancer cells. (A) NS expression levels in MCF-7 and MDA-MB-468 cells transfected by NS-siRNAs were assessed by real-time quantitative PCR at 6, 12, 24, 48, and 72 h after transfection. Also, the expression level of NS was assessed in the cells transfected by irrelevant-siRNA (IR-siRNA) and not transfected (control). The results were normalized to GAPDH and presented as the mean ± SD of three independent experiments. (B): The expression level of TP53 in MDA-MB-468 cells significantly was down-regulated compared to MCF-7 cells. ** p-value < 0.05 compared to the untreated cells and cells treated with irrelevant (IR)-siRNA
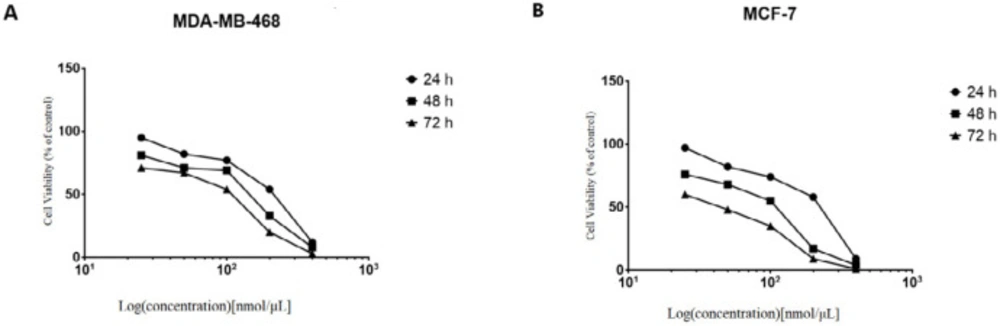
NS-siRNAs inhibited the viability of cells in a dose-dependent and time-dependent manner, which assessed by the MTT assay in (A) MCF-7 and (B) MDA-MB-468 cells. The percentage of living cells was reduced after treatment with NS-siRNAs (25 to 400 nmol/µL) at 24, 48, and 72 h. The data are presented as means ± SD
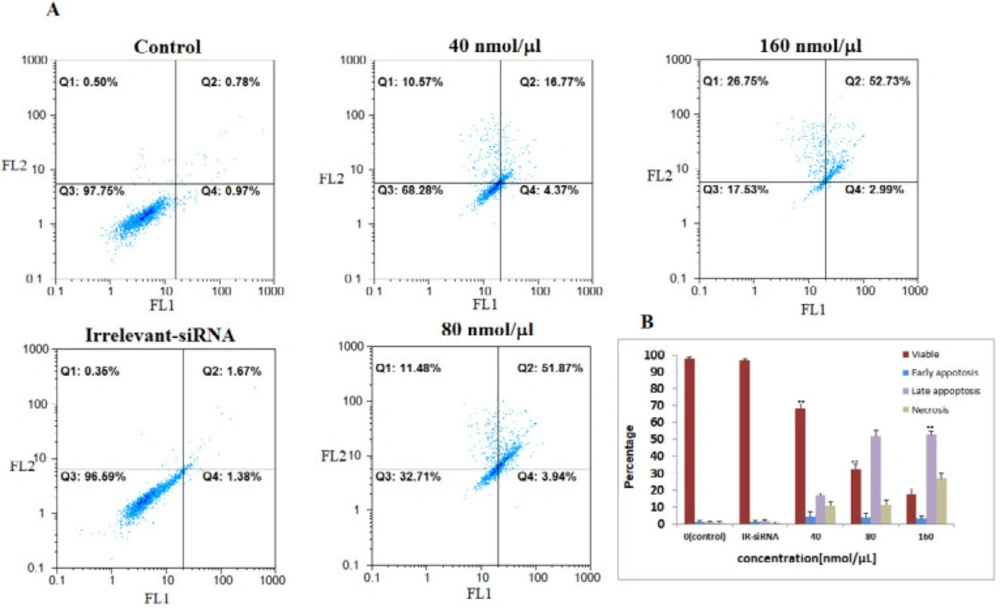
The four NS-siRNAs induced apoptosis in MCF-7 cells. A: NS-siRNAs treatment resulted in the significant apoptosis in MCF-7 cells at 40, 80, and 160 nmol/μL concentrations detected using a double-staining method with fluorescein thiocyanate-conjugated annexin V and propidium iodide. The percentage of the living cells transfected by irrelevant-siRNA was 95.69%. Also, 97.75% of non-transfected (control) cells were viable. B: A statistical graph of annexin V-FITC/PI staining in MCF-7 is shown. The data averages for each time point were calculated using the results from three independent experiments. The results are expressed as the mean ± SD. Apoptotic cells included the Annexin V+/PI− cells and the Annexin V+/PI+ cells. **: p-Value<0.05 compared to the control group
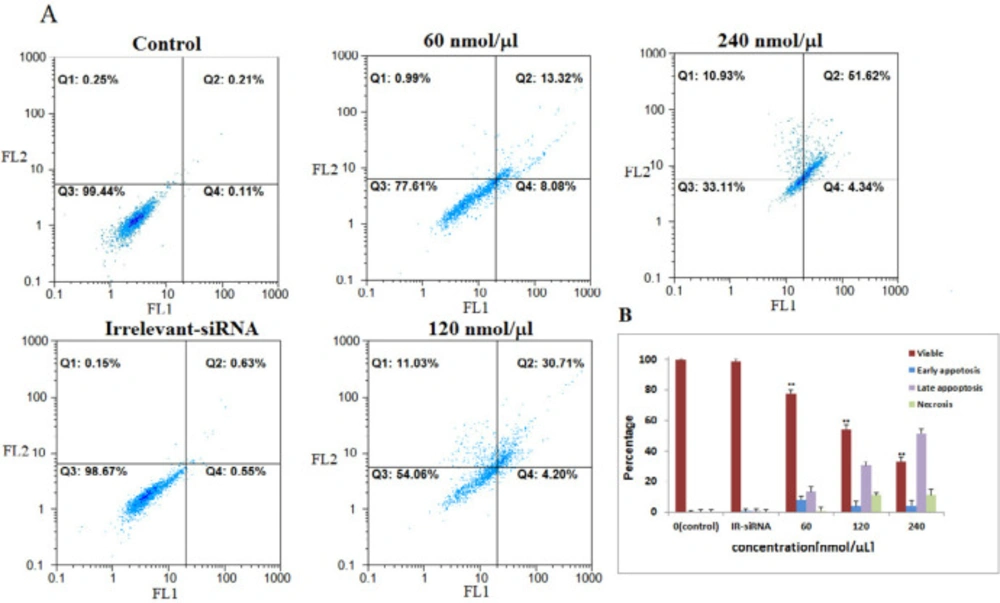
The four siRNAs targeting NS mRNA induced apoptosis in MDA-MB-468 cells. A: NS-siRNAs treatment induced apoptosis in MDA-MB-468 cells at 60-120-240 nmol/µL concentrations detected via annexin V/PI staining method. B: A statistical graph of flow-cytometry results in MDA-MB-468 cells is shown. These data are the average results of three independent experiments. The results are expressed as the mean ± SD. The data are presented as the mean ± SD. **: p-Value<0.05 compared to the control group
| Genes | Sequence | Product length (bp) |
|---|---|---|
| TP53 (Forward) | CAGCACATGACGGAGGTTGT | 67 |
| TP53 (Reverse) | CCAGACCATCGCTATCTGAGC | |
| NS (Reverse) | AAAGCCATTCGGGTTGGAGT | 200 |
| NS (Forward) | ACCACAGCAGTTTGGCAGCAC | |
| GAPDH (Forward) | CATGTAGTTGAGGTCAATGAAGG | 150 |
| GAPDH (Reverse) | GAGCCACATCGCTCAGACAC |


