Materials and methods
Cell lines and culture conditions
Human breast cancer cell line MDA-MB-453 (NCBI # C214) was obtained from Pasteur Institute of Iran (Tehran, Iran). Breast cancer cells were grown in Roswell Park Memorial Institute (RPMI) 1640 medium (Bioidea, Iran) containing 10% fetal bovine serum (Gibco, UK), and 1% Penicillin–Streptomycin (Gibco, UK). Cultures were split 1 in 3 twice weekly unless otherwise specified for transfection assays. Cells were maintained at 37°C in the presence of 5% CO2. The cell viability was determined by standard Trypan blue dye exclusion method.
Designing siRNA
An siRNA duplex specifically targeting the promoter region of human DNMT3B gene (HGNC: 2979) at -415 to -396 bases upstream of the transcription start site was designed using siDESIGN Center tool (Dharmacon, USA). A blast search indicated that the designed siRNA specifically targeted the DNMT3B gene but not the DNMT3B mRNA variants. The sequence of DNMT3B-siRNA duplex was as follows: sense strand (siDNMT-S1): 5’- GGG UUA AAG CGG AGA CUC UTT-3’, antisense strand (siDNMT-AS1): 5’- AGA GUC UCC GCU UUA ACC CTT -3’. The siRNA duplex against DNMT3B gene promoter (siDNMT) and also a random negative control siRNA duplex (siNC) were commercially synthesized (Synthesisgene, China).
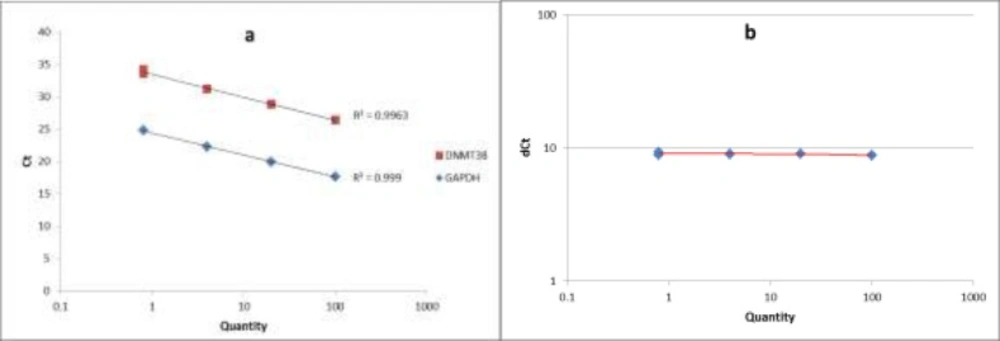
The standard curve and the validation experiment for relative quantitation of DNMT3B transcript to GAPDH (a) Relative standard curve was generated via amplifying serial five-fold dilutions (i.e. 100, 20, 4 and 0.8) of an unknown sample as the PCR template; (b) Validation experiment was performed by graphing ∆CT values against relative quantities
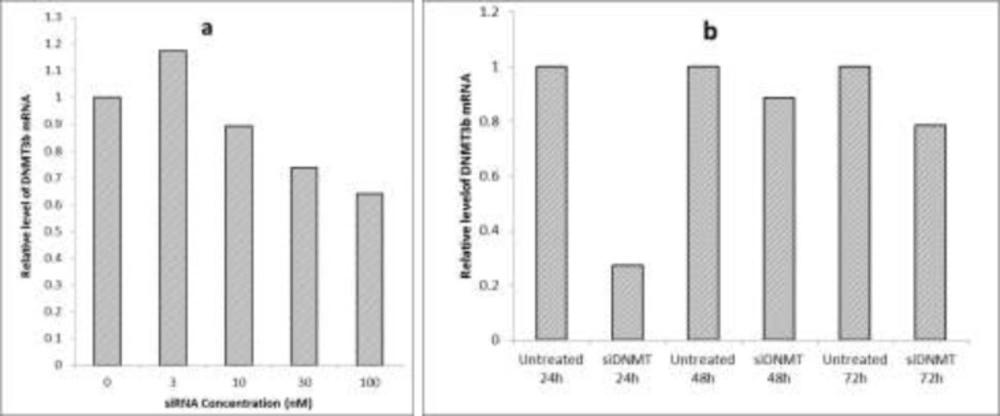
Optimization of siRNA transfection conditions (a) The effect of different concentrations of siDNMT on DNMT3B mRNA expression in MDA-MB-453 cell line after 72 h; (b) The effect of 30 nM siDNMT on DNMT3B mRNA expression in MDA-MB-453 cell line at different time points. Optimization experiments were performed once
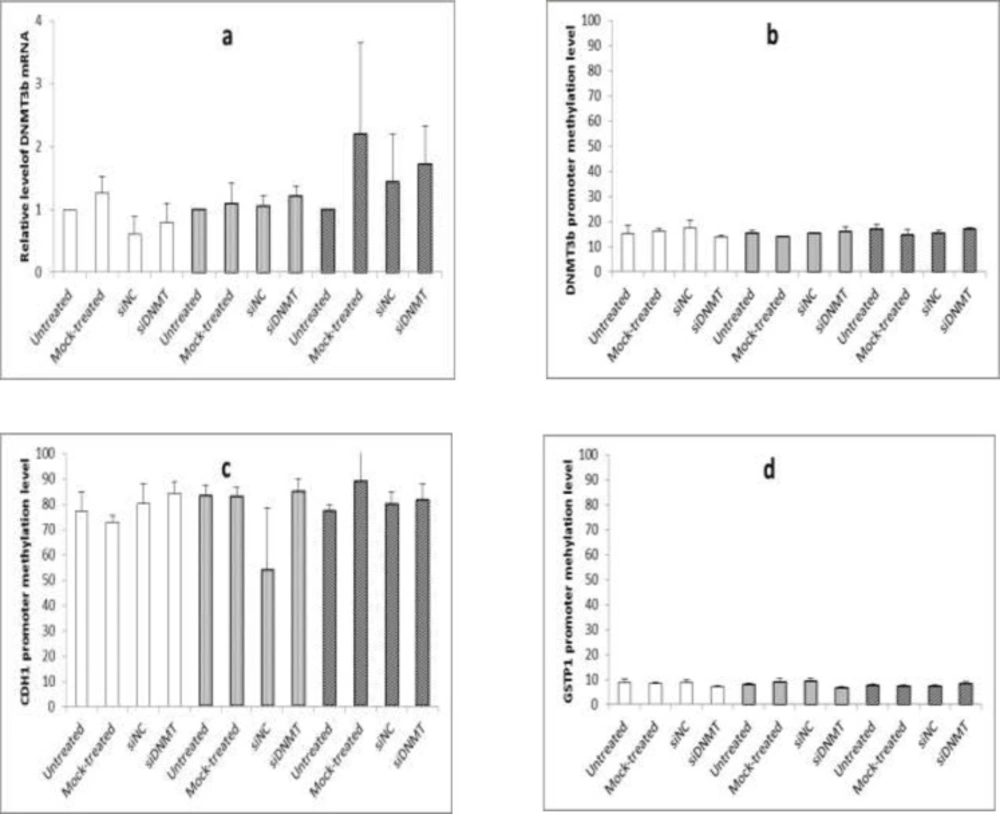
The effect of long term siDNMT transfection on the expression level of DNMT3B mRNA after 24 h (a) and the promoter methylation level of DNMT3B (b), CDH1 (c) and GSTP1 (d) after 48 h in MDA-MB-453 cell line. The siDNMT, siNC, mock-treated and untreated represents cells treated with siRNA against DNMT3B promoter, negative control siRNA, transfection reagent and culture medium, respectively; the last three were used as the negative controls. Open bars represent samples from the first transfection, gray bars represent samples from the second transfection and shaded bars represent samples from the third transfection. Values are expressed as mean ± SEM from 3 separate experiments and differences were considered significant at P < 0.05
Transfection of siRNAFor transfection of siRNA, 24 h prior to the treatment, cells were plated at a density of 5 x 10⁴ cells per well of a 24-well plate in 0.5 mL of appropriate culture medium containing serum and antibiotics. Cells were incubated under normal growth conditions (typically 37 °C and 5% CO2) to reach a confluency of 70% by next day. On the day of transfection, the required amount of the siRNA (siDNMT or siNC) was diluted in 100 μL culture medium without serum and antibiotics. As per manufacturer’s instructions, 3 μL of HiPerFect Transfection Reagent (Qiagen, Germany) was added to the diluted siRNA and mixed by vortexing. The mixture was incubated for 10 min at room temperature to allow the formation of transfection complex. The complex was then added drop-wise onto the cells while gently swirling the plate to ensure uniform distribution of the transfection complex. The cells were incubated with the transfection complex under their normal growth conditions and monitored for gene silencing after the appropriate time.
In order to optimize the siRNA transfection, various concentrations of siDNMT were tested on the breast cancer MDA-MB-453 cells. This was performed by diluting equivalent volumes of a 2 µM siRNA stock solution in 100 μL culture medium without serum and antibiotics, so that it gives the final siRNA concentrations of 3, 10, 30 and 100 nM after adding transfection complexes to cells in next steps. The efficiency of gene silencing was monitored 72 h post transfection and compared to the untreated control. After optimization, the final concentration of siRNA was adjusted at 30nM. To monitor gene silencing at the appropriate time point, MDA-MB-453 cells were transfected with 30nM siDNMT and the efficiencies of gene silencing was monitored at different time points (i.e. 24, 48 and 72 h after transfection), compared to their untreated controls.
For long term transfection, transfected cells were maintained under normal growth conditions. Forty eight h post transfection, when the cells became confluent, they were split 1: 2 into fresh plates and were re-transfected on the next day (i.e. 3 and 6 d after first transfection). Cells were harvested at 24 h post transfection (i.e, on days 1, 4, and 7) to monitor the gene silencing and at 48 h post transfection (i.e, on days 2, 5, and 8) to analyze the DNA methylation. In all transfection experiments, the silencing efficiency of siDNMT in MDA-MB-453 cells was tested against untreated, mock-treated, and siNC treated cells. Experiments were carried out thrice independently.
RNA isolation and reverse transcription
Total RNA was isolated from breast cancer cells (harvested 24 h post transfection) using RNeasy Mini kit (Qiagen, Germany) as recommended by the manufacturer. RNA concentration was quantified by Nano Spec Cube instrument (German Precision Nanolytic, Germany) and 1 µg of total RNA was used for synthesis of first strand complementary DNA (cDNA). Reverse transcription was performed by High Capacity cDNA Reverse Transcription kit (Applied Biosystems, USA) according to the manufacturer’s instructions using random primers supplied in the kit . The cDNAtemplates were then subjected to Quantitative real-time polymerase chain reaction (Q-PCR) for analyzing the gene silencing.
Quantitative real-time polymerase chain reaction (Q-PCR)
Q-PCR was performed to assess transcript expression of DNMT3B relative to glyceraldehyde-3-phosphate-dehydrogenase (GAPDH) as the endogenous control. Two microliters of cDNA were used in a 20 µL reaction with 1X SYBR Green PCR Master Mix (Life Technologies, USA) and 0.25 µM of each forward and reverse primers. The following primers were used: DNMT3BF162: 5’- AGA TCA AGC TCG CGA CTC TC -3’, DNMT3BR162: 5’- GAC AGC TGG GCT TTC TGA AC-3’, GAPDHF113: 5’- CTC AAC TAC ATG GTT TAC A -3’, and GAPDHR113: 5’- AAG ATG GTG ATG GGA TTT -3’. The reaction was performed in an ABI StepOne Real-Time PCR Systems (Applied Biosystems, USA) using the following conditions: a denaturation step lasting 10 min at 95 °C, followed by 45 repeats of the following cycle: 95 °C for 15 s, annealing at 53 °C for 15 s and extension at 72 °C for 20 s. after the 45th cycle, an optional denaturation and renaturation step was carried out for 15 s at 95 °C and 1 min at 60 °C, followed by a melt curve step ramping from 60 °C to 85 °C rising 1 °C per s. Relative quantitation was performed using comparative CT (∆∆CT) method. Data were normalized to GAPDH expression as the endogenous control and untreated sample as the reference sample. ROX dye was used as the passive reference. Also no template control (NTC) was included as the negative control. Each sample was analyzed in duplicate.
The quality of PCR products was checked by melting curve analysis. To assess the PCR efficiencies in amplification of both DNMT3B and GAPDH genes, a relative standard curve experiment was performed. The standard curve was generated via amplifying serial five-fold dilutions (i.e. 100, 20, 4 and 0.8) of an unknown sample as the PCR template. Finally we performed a validation experiment by graphing ∆CT values against relative quantities, to assess the validity of ∆∆CT method in our study.
DNA extraction and bisulfite modification
Genomic DNA was extracted from breast cancer cells (harvested 48 h post transfection) with Blood-Animal-Plant DNA Preparation kit (Jena Bioscience, Germany) as per the manufacturer’s instructions. After determining the DNA concentration of samples by Nano Spec Cube instrument (German Precision Nanolytic, Germany), Sodium bisulfite modification of DNA was performed using Epitect Bisulfite kit (Qiagen, Germany) according to the manufacturer’s instructions. EpiTect Control DNA Unmethylated and Unconverted (Qiagen, Germany) was used as the control for bisulfite treatment method. Bisulfite treated DNA was subjected to DNA methylation analysis.
DNA methylation analysis
DNA methylation analysis was performed on bisulfite treated DNA samples at the promoter region of DNMT3B, CDH1 and GSTP1 genes using quantitative method of differential high resolution melting analysis (DHRMA). A Rotor-Gene 6000 (Corbett Research, Australia) was utilized for PCR amplification and subsequent HRM analysis. Details of the DHRMA method for methylation analysis including the primer pair, PCR and HRM conditions and the data analysis have been described previously for DNMT3B (
11). The DHRMA method for CDH1 and GSTP1 genes was performed by a similar protocol for DNMT3B gene, except using specific primer pairs, PCR, and HRM conditions.
For CDH1 DHRMA, the primer sequences specified for CDH1 gene (HGNC: 1748) were as follows: meCDH1F120: 5’-GGT TGG GTA ATA TAG GGA GAT ATA G-3’ and meCDH1R120:5’-AAA ATA CAA ATA CAC ACC ACC AC-3’. PCR was performed in 20 μL volume containing: 1X Epitect HRM PCR Master Mix (Qiagen, Germany), 750 nM of each primer, and a 100 ng bisulfite-converted DNA template. The touchdown amplification program was, a 5 min hold at 95 °C, followed by 55 cycles, including 10 s of denaturation at 95 °C, 30 s of annealing at 55 °C, decreasing 0.2 °C per cycle to 50 °C, and then 10 s extension at 72 °C. An optional denaturation and renaturation step were performed for 30 s at 95 °C and 30 s at 50 °C, followed by HRM step ramping from 60 °C to 85 °C, rising 0.1 °C every 2 s.
The GSTP1 DHRMA was carried out using a specific primer pair for GSTP1 (HGNC: 4638) with following sequences: meGSTP1F104: 5’-TTTAGAATTTTAAATAAAAGTTGGA-3’ and me GSTP1R104:5’ACTCCTAACCTTAAATAATCTACAC-3’. PCR was performed in 20 μL volume containing: 1X Epitect HRM PCR Master Mix (Qiagen, Germany), 750 nM of each primer and 100 ng bisulfite treated DNA template. The amplification program was 5 min at 95 °C, then 55 cycles including 10 s at 95 °C, 30 s at 55 °C, 10 s at 72 °C. An optional denaturation and renaturation step was performed for 30 s at 95 °C and 30 s at 50 °C, followed by an HRM step ramping from 60 °C to 85 °C rising 0.1 °C per 2 s.
Data analysis
Data was recorded in a Microsoft excel spreadsheet and Statistical Package for the Social Sciences (SPSS) software version 16.0 (SPSS Inc, USA) was used for statistical analysis. Data analysis was performed using one way ANOVA to analyze the significance between different values. Values are expressed as mean ± SEM from at least 3 separate experiments and differences were considered significant at a P value of less than 0.05.