Chemicals and Reagents
Two different types of Reteplase IBs were generously donated by Zist Darou Danesh Co. (Tehran, Iran). Both Reteplase IBs were expressed in Escherichia coli BL21, one at 37 °C and the other at 25 °C. These IBs were purified and washed several times according to the Zist Darou Danesh instructions and the final pellet was used for this study. Ethylenediaminetetraacetic acid
(EDTA, Sigmaldrich, 60-00-4), Tris(hydroxymethyl)aminomethane (Tris-base, Sigma-Aldrich, 77-86-1), 1,4-Dithiothreitol (DTT, Sigma-Aldrich, 3483-12-3), Urea (Sigma-Aldrich, 57-13-6), Coomassie Brilliant Blue G-250 (Sigma-Aldrich, 6104-58-1), Methanol (Sigma-Aldrich, 67-56-1), Phosphoric acid (Sigma-Aldrich, 7664-38-2), Bovine serum albumin (BSA, Sigma-Aldrich, 9048-46-8) were used in this research.
Freeze dryer (Christ, alpha1-2LDplus, Germany), and FTIR (PerkinElmer Frontier, USA) were the main equipment recruited in this study.
Solubilization of Reteplase IBs
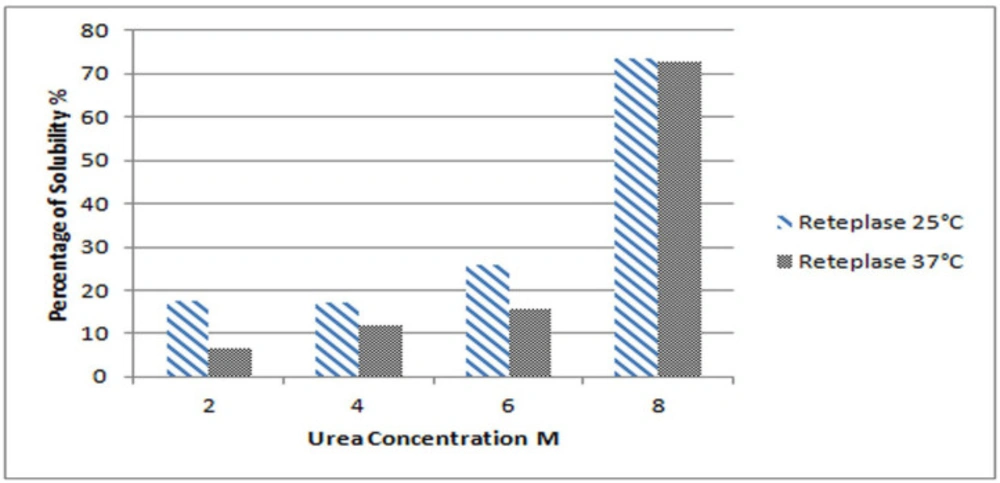
Experiments were performed in triplicate for each sample and the average values were considered for data analysis. A 300 mg sample (wet weight) of IBs was soaked in a 2 mL solubilization buffer, which prepared accordingly. The solubilization buffer is composed of 50 mM Tris–base, 1 mM EDTA, 100 mM DTT, and different concentrations of urea, including 2, 4, 6, 8 and 10 M (
7). According to the isoelectric point of the protein, the pH of the solubilization buffer was adjusted to 8. IBs were stirred gently by magnetic stirrer overnight at ambient temperature. Finally, samples were centrifuged at 12000 rpm and 4 °C for 10 min. The supernatant was separated and used for further evaluations.
Total Protein Analysis
Total protein concentration was determined according to the Bradford method (
14). Bovine serum albumin was used as a standard. The percentage of solubility was calculated as follows:
Equation 1
Fourier Transformed Infrared Spectroscopy (FTIR)
Solubilized proteins were precipitated by adding saturated ammonium sulfate to the samples and centrifuging at 12000 rpm and 4 °C for 10 min to separate the precipitated proteins (
3). The pellets were washed three times with distilled water, and the washed precipitated proteins were then dried by freeze dryer for 10 h prior to analysis by FTIR.
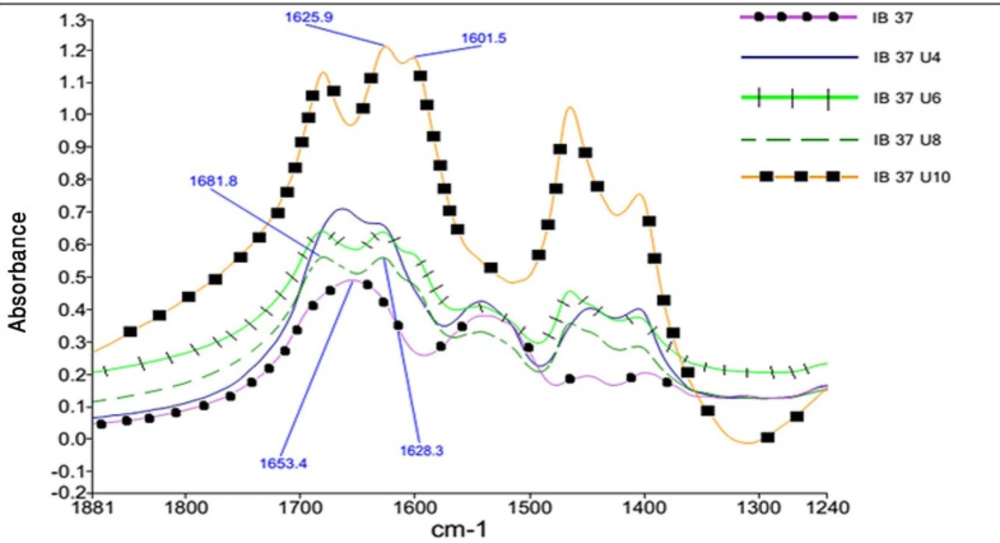
Each participated sample was mixed with ground KBr and pressed to form a pellet. The FTIR data were collected with 64 scans and a resolution of 4 cm-1, while dry nitrogen was purged into the instrument. The results in the mid-infrared region (from 4000 to 400 cm-1), amide I (1600 to 1700 cm-1) and amide II (1480 to 1575 cm-1) were compared and subjected to some mathematical resolution enhancement processes.
FTIR data mathematical enhancement
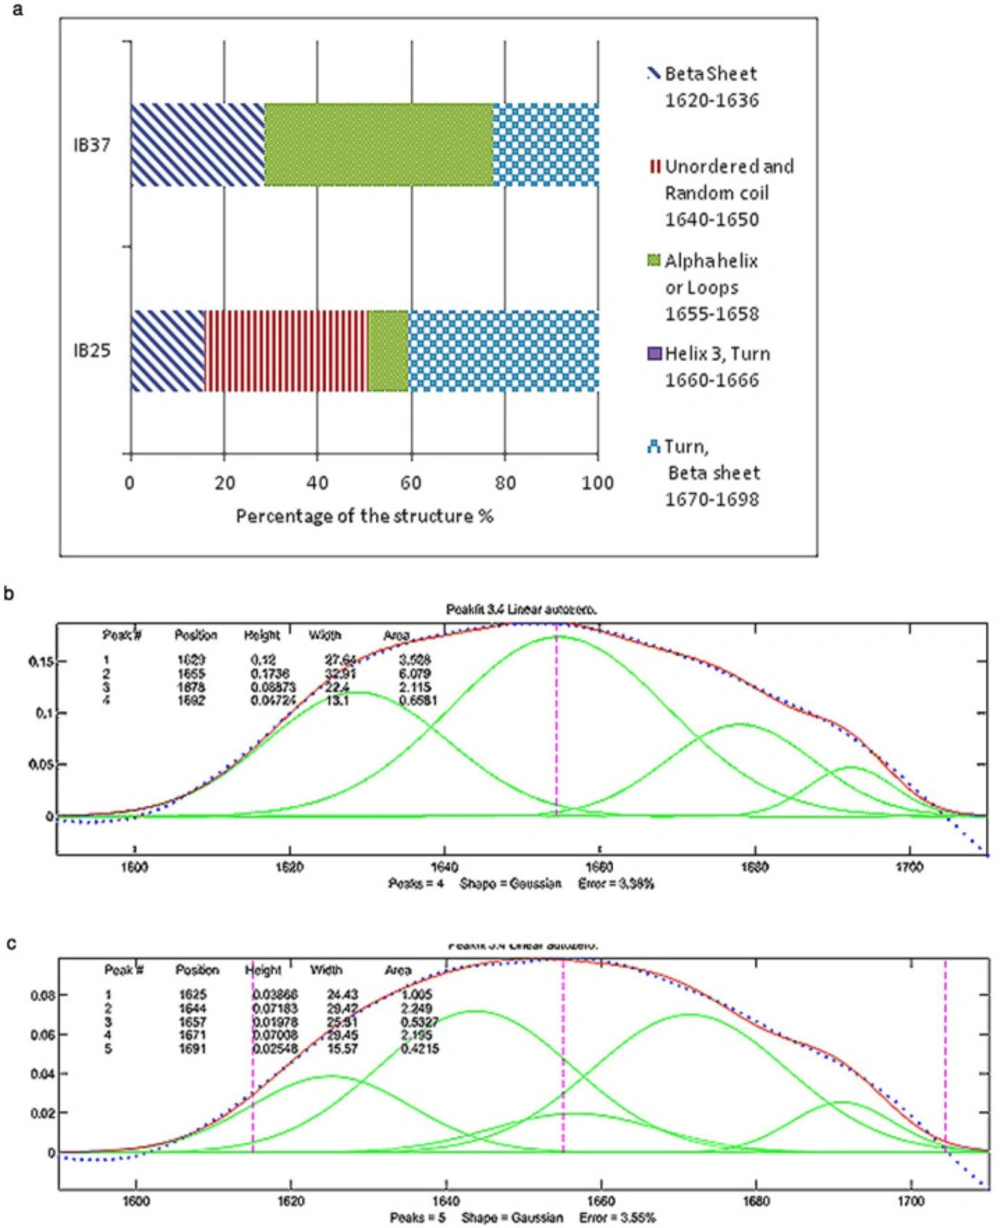
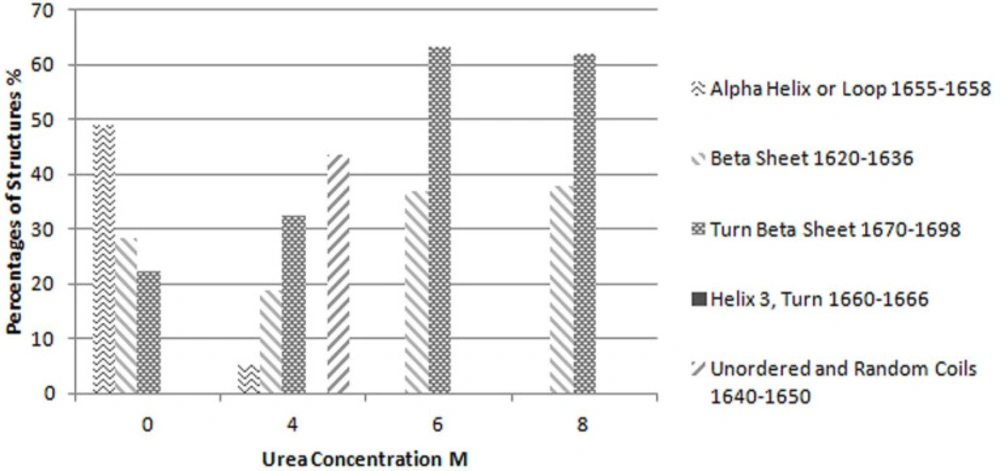
The second derivative of results in amide I region, as a common resolution enhancement method, were used to analyze the secondary structure of proteins (
15). Based on the data obtained from second derivatives of spectra, curve fitting was performed using a Matlab code (
18). For each peak a Gaussian curve was fitted. The accepted error (sum of squares of the deviations normalized by the variance of the count) for fitting the curve to the results was considered to be less than 4%. The interpretation of these results has been based on preceding studies on the secondary structure of proteins by the same method (
1,
3,
4 and
7).