Cell Culture and Verification
Rat bone marrow mesenchymal stem cells (RBM) were extracted and established from Wistar rat femur by splashing with a syringe and transferred to the T25 flask. The cells were cultured in Dulbecco’s modified Eagle’s medium (DMEM) (Gibco, USA) which was supplemented with 2mM L-glutamine (Gibco, USA) and 10% inactivated fetal bovine serum (FBS) (Gibco, USA) in a humidified 37 °C incubator with 5% CO2. After 24 h, non-adherent cells were removed by washing with phosphate-buffered saline (PBS) (Inoclon, Iran). The cells were passaged every 2–3 days when reached about 70–80% confluence in culture flasks.
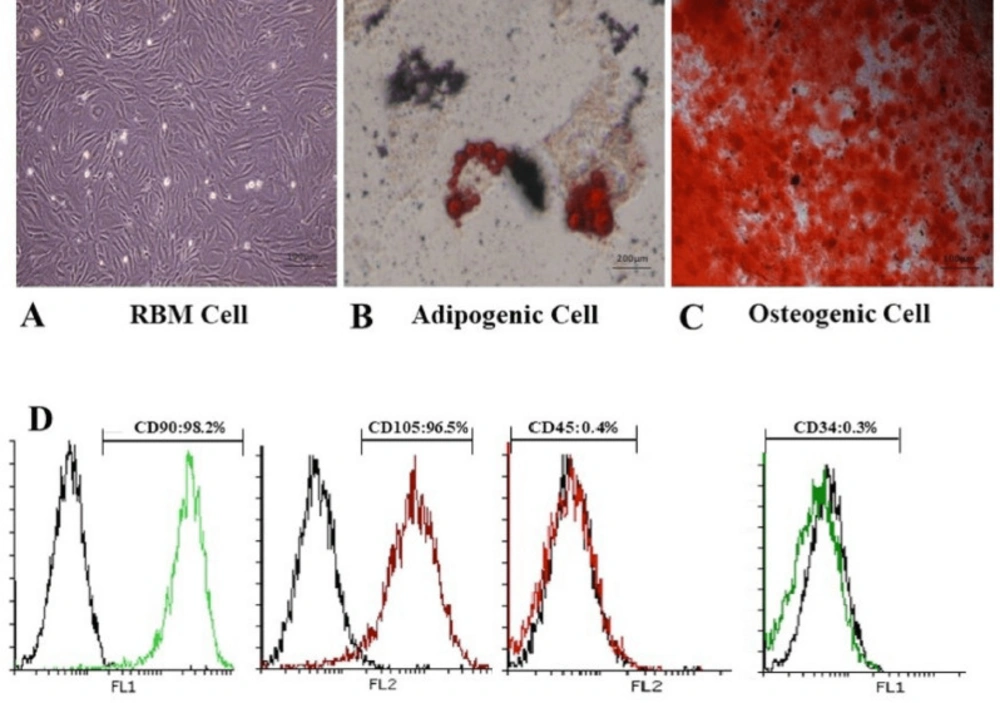
RBM cells were characterized according to standard protocols for stem cell establishment based on two methods: marker evaluation and multi-lineage differentiation capacity (
28). In brief, RBM cells were cultured on six-well plates and osteogenic induction media composed of dexamethasone 1 µM (Zahravi, Iran), ascorbic acid 200µM (Merck, Germany) and beta glycerolphosphate 10mM (Merck, Germany) was added to the cultured cells (80% confluence). Media was changed twice a week for three weeks. For adipogenic differentiation, media contained dexamethasone 1 µM (Zahravi, Iran), indomethacin 50µM (Merck, Germany), IBMX 0.5µM (Merck, Germany), and insulin 10µg/mL (Exir, Iran). Media was changed twice a week for two weeks. For staining step, the cells first were fixed for 30 min in the presence of 10% glutaraldehyde solution (Merck, Germany) in methanol (Merck, Germany) and stained in Alizarin Red (Sciencell, USA) for osteogenic differentiation in a dark place and Oil red (Biotrend, Germany) for adipocyte differentiation 60 min. All the experiments were performed in triplicate.
To markers analysis, RBM cells were detached with trypsin-EDTA0.25mM (Gibco, USA) and washed in PBS containing 2% bovine serum albumin (BSA) (Gibco, USA). Then suspended cells were stained with anti-MSC specific markers PE-conjugated (Biolegend, USA). CD34, CD45, CD90, and CD105 markers were estimated using flow-cytometry (FACScaliberTM cytometer, USA) and analyzed with FlowJo 7.6-1 software (flowjo, USA). RBM cells were used at passage numbers 3-8 for all in-vitro experiments. To evaluate the multi-lineage differentiation capacity, RBM cells were induced for 14 and 21 days in adipogenic and osteogenic conditioned medium, respectively (
29).
EVs Enrichment and Characterization
Ultracentrifugation was used for EVs isolation which is the most common and reported techniques for vesicles isolation (
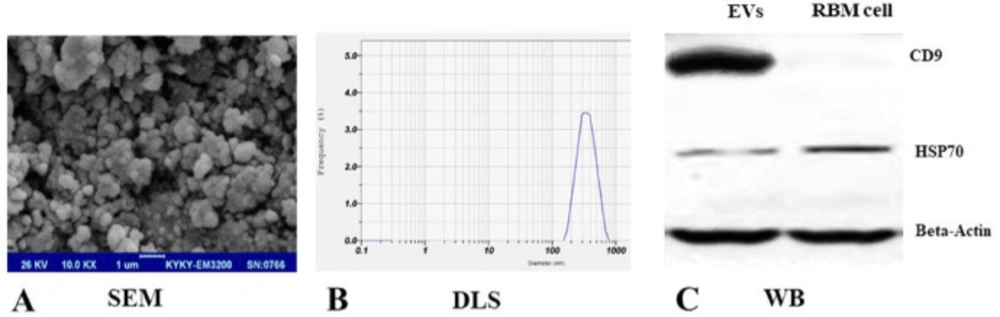
30). For this, the medium of expanded RBM cells (10 × 106 cell/ T75 flask) were replaced with DMEM medium (Gibco, USA) which was supplemented with exosome free-FBS (Invitrogen, USA) in an antibiotic-free condition. Briefly, after RBM cells incubation for 24-48 h, the medium was harvested and centrifuged at 200× g for 10 min and then 2,000× g for 20 min at room temperature to remove dead cell bodies and debris and the supernatant was filtered with a 0.22μm filter unit (Sartorius, Germany). Then, the EVs were purified by ultracentrifugation (Beckman, USA) at 100,000× g for 70 min at 4 °C. The pellet was washed with 10 mL PBS and the EVs fraction protein content was assessed by the Bradford assay. Extracted EVs were suspended in PBS (500μL, 2 mg/mL total protein) and stored at −70 °C until further evaluation. Morphology, particle size, and surface proteins of EVs were characterized according to previous researches. A drop of the sample was put on a glass slide, and dried at room temperature. Scanning electron microscopy (SEM) (AMRay, USA) was used to observe the EVs morphology. The particle size of EVs was measured using a Dynamic Light Scattering (DLS) (Malvern, UK). Also, the EV markers expressions including CD9, HSP70 (Santa Cruz Biotechnology, USA) were evaluated using western blot analysis according to the published protocols for EVs confirmation (
31). Briefly, 50μg of EV extracted proteins were electrophoresed and transferred to a PVDF and treated with a specific CD9, HSP70 primary antibodies overnight at 4 °C. Incubation with horseradish peroxidase-conjugated secondary antibody was performed for 90 min at room temperature. Proteins signals were detected by ECL kit using chemiluminescence reagents (Biorad, USA).
Preparation of EVs-Loaded NEP
EVs-loaded NEP was prepared with a slight NEP (RD system, US) mixing with EVs through the freeze-thaw cycles according to Haney protocol (
32). For this purpose, EVs, isolated from conditioned media from RBM cells (10 × 106 cell/ T75, 2 mg/mL total protein), were mixed with NEP 10 μg/mL, prepared in Tris (Merck, Germany), NaCl (Merck, Germany) and ZnCl2 (Merck, Germany) solution in concentration which were recommended from the factory and incubated for 30 min, then rapidly preserved at −80 °C, and thawed at room temperature. The freeze-thaw cycle was repeated three times. To determine the efficiency of drug entrapment (also named encapsulation), the mixture was centrifuged for one hour at 100,000 g. EVs-loaded NEP was collected, washed similar to the protocol used for EV isolation in previous section and then suspended in PBS. The drug concentration in the supernatant was determined using standard curve provided with the various serial dilution of NEP concentration (0.07, 0.15, 0.3, 0.62, 1.25, 2.5, 5 ng/mL) in 280nm and UV-visible spectrophotometer (Jenway, UK). Loading efficiency (LE) is the percentage of the drug that is successfully entrapped or adsorbed into nanoparticles. It is calculated as follows: Supernatant from precipitated EVs (without loading) was used as a calibration solution for absorbance. Entrapment (or confinement) efficiency was calculated using the following formulae: (LE) = (m0 - mue /m0) ×100 which m0 is an initial total drug added and mue is free non-entrapped NEP in the supernatant (
33,
34). The optimum entrapment dosage was measured based on the initial serial concentration and used for the standard curve which was mentioned before. NEP loaded EVs were aliquot and immediately stored at -70 °C.
Preparation of Virus Containing Mutated APP
Production of the mutant virus was performed according to the previous study with a lentiviral vector (LV) encoding the mutant human amyloid protein precursor (APP) which bears the fAD-linked Swedish and Indiana mutations (APPSw/Ind) (
35). The recombinant virus, containing mutated APP was isolated from transduced HEK-293 cell line (C10139, IBRC, Iran) supernatant and dissolved in PBS (Inoclon, Iran) to reach a titer of ~109 TU/mL. The viruses were then stored at -70 °C until the injection into the brain was done.
Animals and Experimental Design
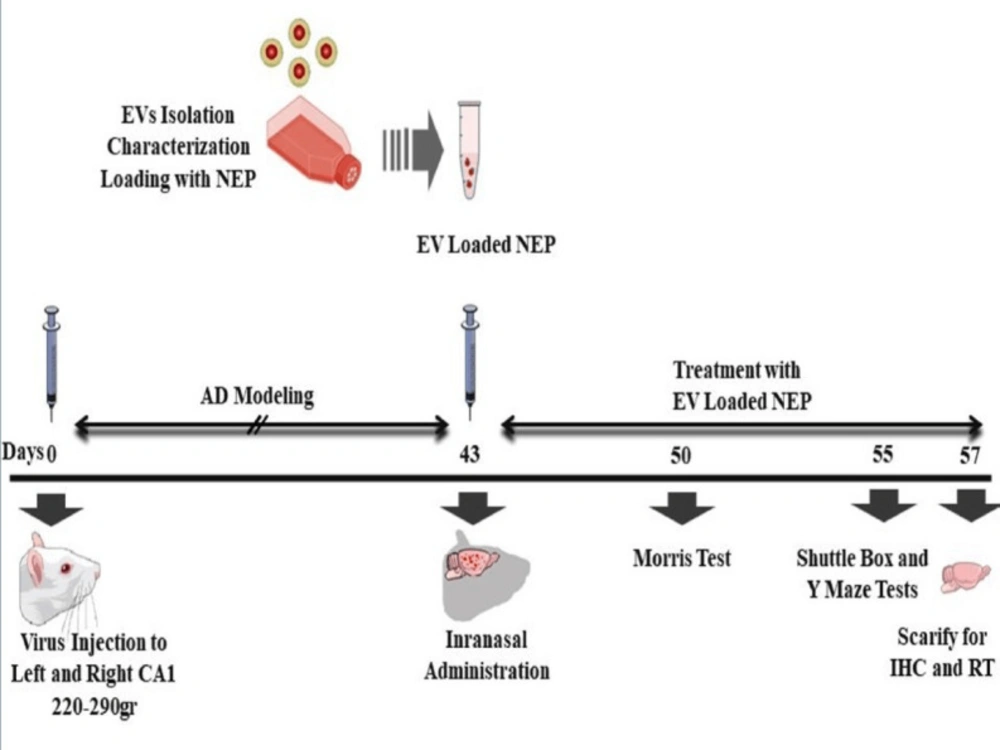
Adult male Wistar albino rats (230–280g) were obtained from Neuroscience Research Center, Shahid Beheshti University (Tehran, Iran) and experiments were conducted under the internationally accepted principles for the experimental use of rats. Also, all animal studies and procedures were permitted by the Ethics Committee of Tehran University of Medical Sciences (No: IR.TUMS.REC.1394.1822). For the initial studies, the rats were housed two animal per cage under temperature and humidity-controlled conditions (25 ± 2°) in standard laboratory housing (12:12 hour light/dark cycle, with lights on at 6:00 a.m.). They were handled for two weeks before the surgery for adaptation. The rats had free access to water and food during the study. The rats were randomly divided into four groups (n = 8): (1) APP--PBS (Normal group): distilled water was injected 1μL/side in cornu ammonis (CA)1 region bilaterally; received 25µL PBS in treatment period, (2) APP+-PBS (Ctrl, control-disease group): virus containing mutated APP was injected 5μL/side in CA1 regions bilaterally; received 25µL PBS in treatment period,(3) APP+-EVs (EVs, treatment control group): virus containing mutated APP was injected 5 μL/side in CA1 regions bilaterally; received 25 µL EVs in treatment period, (4) APP+-EV-loaded NEP (EV& NEP, treatment group) virus containing mutated APP was injected 5 μL/side in CA1 regions bilaterally; received 25 µL EV-loaded NEP in treatment period. All injections were performed intranasally for 2 weeks, 43 days after surgery.
Surgery
The rats were sited in a stereotaxic tool (Stoelting, USA) after anesthetization with an intraperitoneal injection of combined ketamine (100 mg/kg) and xylazine (10 mg/kg) (Alfasan, Netherlands). The stereotaxic device was set up for dorsal hippocampus and the surgery was performed according to the atlas of the rat brain (
36,
37). The solution containing viruses (5μL/side) was injected bilaterally into the CA1 region of the hippocampus using a 5μL Hamilton syringe (Hamilton, Reno, Nevada). The microinjections were performed in 15 min, and the needles were left in place for 5 min to help the distribution of the injected viruses. The mutated viruses accumulate intra-neuronal Aβ in the brain hippocampus.
Morris Water Maze test
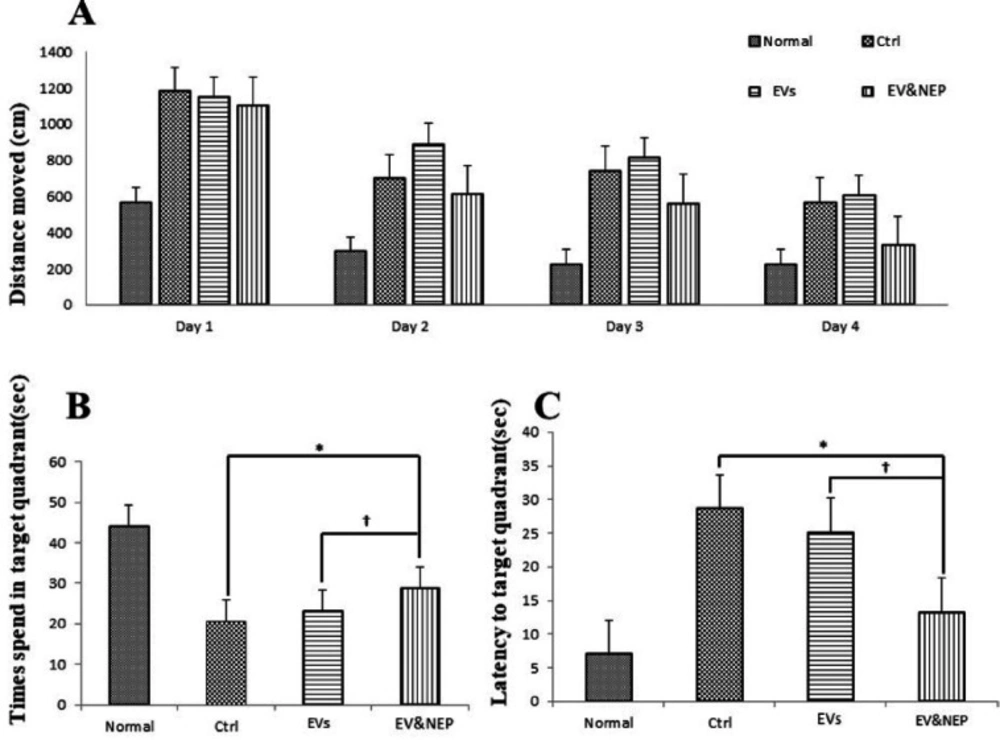
Morris water maze (MWM) test was evaluated through the acquisition phase as spatial learning and probe trial as memory evaluation. The apparatus consisted of the maze tank surrounded by pictures on the walls and dark circular water-filled pool and a platform put in the one quadrant of the maze and 2 cm below the water surface (
38,
39). The platform was positioned in the same quadrant on every trial and provides only the escape from the water. The animal movement in the tank was recorded with a video tracking system (Panasonic Inc., Japan) placed properly at the top of the maze apparatus. EthoVision version XT7.0 (Noldus, Netherlands), a video tracking software was used for investigation of behavioural experiments automatically through the 60s. The training began on day 50th after stereotaxic injection of the above-mentioned experimental groups (7 days after treatment). Four days (50th-53th after virus injection) were included four training trials per day (the 60s at 90s intervals) and the day after the final training period, a single trial probe was performed in the pool without the platform. All tests were accomplished between 9am to 15 pm.
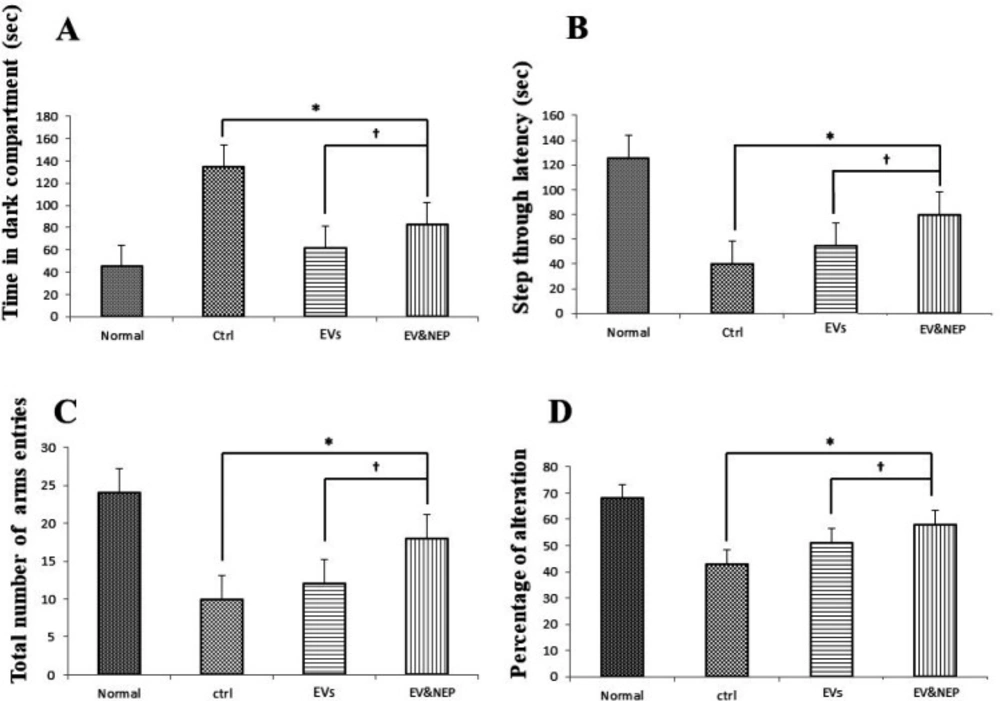
Passive Avoidance test
Passive avoidance test was used to analysis of learning and memory maintenance abilities, in control, EVs and EV-loaded NEP administered animals. In this test, the rats were allowed to habituate to the trial room at the training day, one hour before the experiment and then were placed in the shuttle box composed of a light and a dark partition joining each other through a gate. Then, each rat was placed in the light part, back to the closed gate which opened after 10s. When a rat entered the dark part so that all four limbs were on the dark side, the gate was closed, and a foot shock (1mA, 1.5s) was provided. The rats were then placed in the light part and another foot shock was applied if reentered to the dark side during 120s. During the test phase, the rat latency to enter the dark compartment (step-through latency; STL) and the total time spent in the dark part was recorded. All experiments were done between 9am and 15pm (
40).
Y-maze test
Y-maze spontaneous alternation is a well-known behaviuoral test for measuring working memory during a single period in a symmetrical Y-maze device composed of three arms and have been described previously (
41,
42). The test is based on the rats’ preference for investigation of the arm which was not visited at the two previous selections. Each experimental rat was placed in the centre of the Y-maze and allowed to free access to all arms and move without restriction during an 8-min period. The arm entry was recorded when the rat hind limb was completely in the arm. Then, the sequence and the total number of arms entered were monitored and recorded. Alternation was defined as totally entries into all arms so that there was no repetition in a triple set. Percentage of alternation is calculated as the following formula: ((number of alternation)/ (total number of arm entries − 2)) × 100.
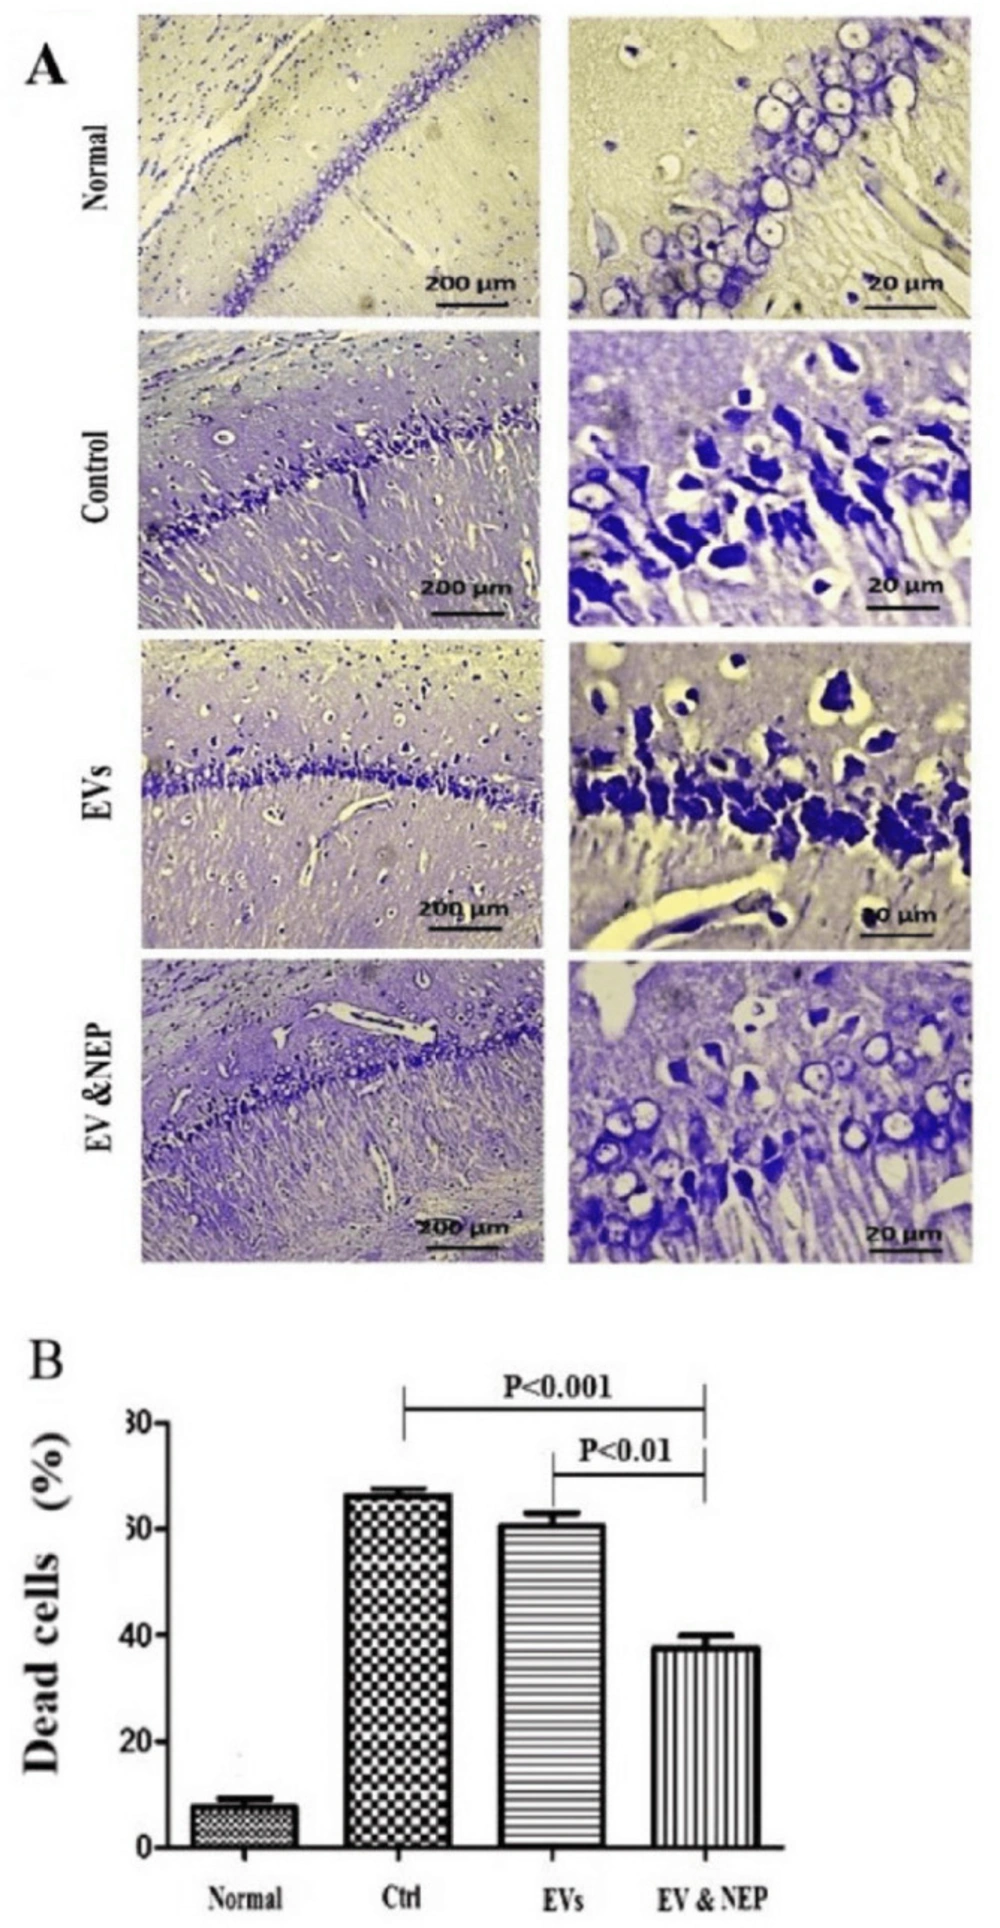
Tissue Preparation and Immunohistochemistry
Immediately after the behavioural testing achievement, each group consisting of 8 rats (Normal, Ctrl, EVs, EV& NEP) were euthanized using CO2 inhalation, and the brains were removed and cut in half sagittal. One hemisphere of each brain (Randomly) was immediately cryopreserved in liquid nitrogen and stored at −80 °C for Real-Time PCR, and the other was immersed in 4% paraformaldehyde (Merck, Germany) in 0.1M PBS (Inoclon, Iran) overnight and used for histological evaluates. After de-paraffinization, the tissues were dissected and post-fixed with 4% paraformaldehyde in PBS. The coronal sections with the thickness of 7μm were prepared and stained with 0.1% cresyl violet acetate solution (Sigma, USA), a neurological stain. For the morphological study, three histological sections of the CA1 region were used (200x magnifications).
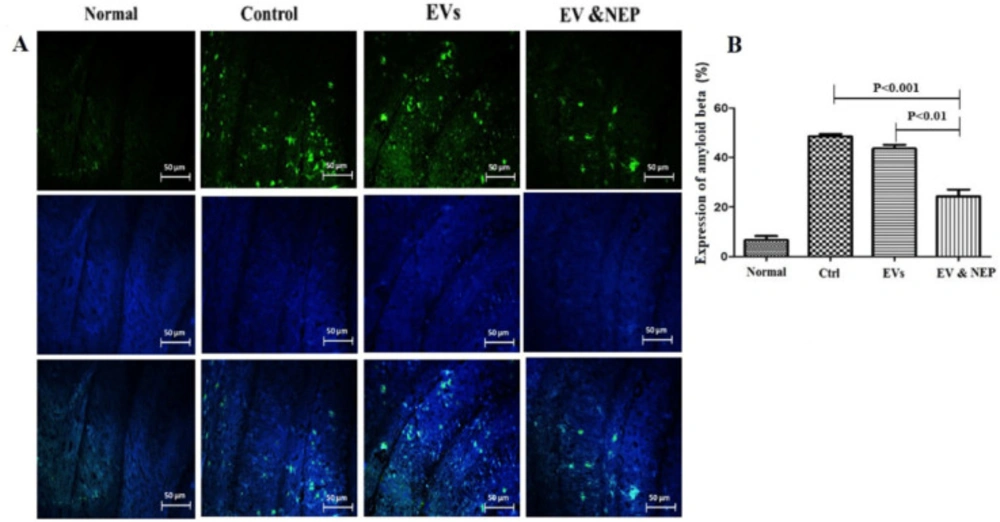
For analysis of Aβ plaques, 16m-thick sections were blocked with 5% BSA (Sigma, USA). Briefly, cell nuclei were stained with DAPI and the samples were immune-stained with Anti-Aβ monoclonal antibody (abcam, USA) for 16 h at 4 °C and a secondary antibody, anti-rat IgG conjugated to HRP (abcam, USA) for 30 min at RT. Images were achieved using confocal microscopy (Olympus, Japan). The Aβ plaques were considered as the percentage of the immune-positive zone (positive pixel) to the investigated zone (total pixel). The results were quantified using ImageJ software (National Institute of Health, USA).
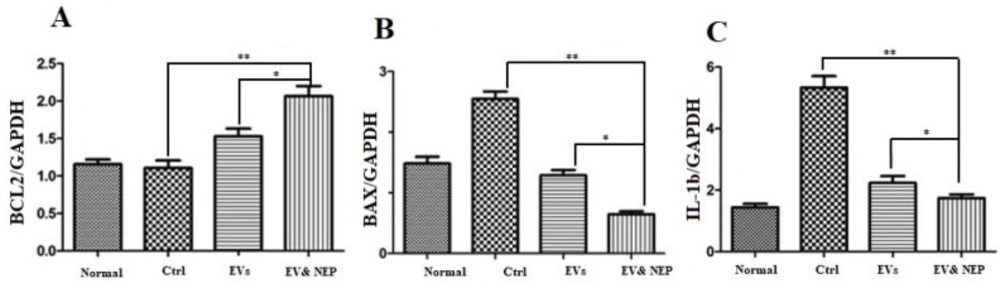
RNA extraction and Real-time quantitative PCR
The hippocampus region was isolated from the rat brain and transferred into sterile cryovials and immediately stored in −80 °C. RNA extraction was conducted using the RNeasy Plus Mini kit, (Qiagen, USA) and the protocol provided by the manufacturer. RNA quantity was evaluated by NanoDot spectrophotometer (Hercuvan, Malaysia). Also, agarose 1% (Sigma, USA) gel electrophoresis was used to assess samples quality and integrity.
Real-time quantitative PCR (qPCR) was performed by the Prime script RT kit (TAKARA, Japan) and 1μg of RNA and using Step one plus ABI system (Applied Biosystems, USA). Glyceraldehyde-6-Phosphate Dehydrogenase (GAPDH) was used as a reference gene. qPCR was performed under the following conditions: The PCR system included 10µL SYBR EX Taq-Mix, 0.5µL Forward and 0.5µL Reverse primers (
Table1), 1µL cDNA and 8µL ddH2O in 20µL final volume. Each sample was experienced in triplicate reactions. PCR conditions were according to the procedure: initial denaturation at 95 °C for 10 min; 40 cycles of 95 °C for 1 min, 60 °C for 40 sec, 72 °C for 30 sec, and 72 °C for 1 min. Relative expression of mRNA was calculated using 2−ΔΔCq method.
Statistical analysis
All data were represented as mean ± SD on curves and processed using GraphPad prism6 software (La Jolla, USA). Two-way ANOVA followed by Tukey’s test was used to determine the difference between the groups. Statistical significances are set at <0.05, p < 0.01 and p < 0.0001.