Male C57BL/6J mice weighing 10-20g were purchased from Pasteur Institute of Iran (Tehran, Iran). The HepG2 cell line was purchased from Iranian Biological Resource Center (Tehran, Iran). D-glucose, D-mannitol, RSV, Oil red O stain were obtained from Sigma chemicals (St, Louis, MO, USA). miRNeasy mini, miScript II PCR (Qiagen, Biorain, Iran) and miScript SYBR Green PCR kits were purchased from Qiagen. (Qiagen, Biorain, Iran). Hybrid R Blood RNA purification kit was purchased from GeneAll Biotechnology CO. RevertAid first strand cDNA synthesis from ThermoFisher Scientific.
Animal experiments
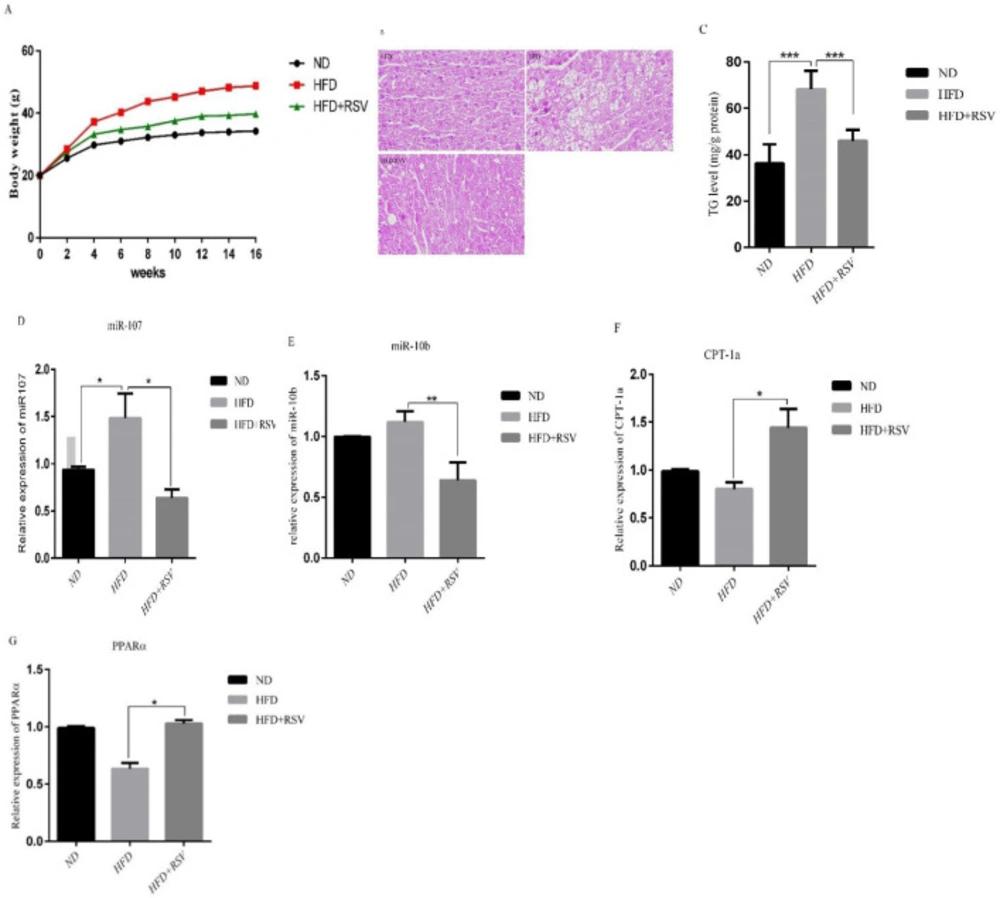
This study was carried out equally with the guidelines of the institutional animal care of Tehran University of Medical Sciences. The protocol was approved by Animal Ethics Committee. Male C57BL/6J mice weighing 10-20 g, 6-8 week-old were kept under standard laboratory conditions 22 ± 0.5 °C, 40-70% humidity and 12h/12h light/dark cycle, with food and water ad libitum. After a one-week adaptation period, mice were randomly divided into three groups (10 in each group), and fed the following experimental diets for 16 weeks, standard chow diet group (ND, 10 kcal% fat), high fat diet (60% high-fat diet, Research Diet, New Brunswick, NJ, USA, Country, D12492) and HFD-supplemented with 0.4% RSV (HFD-RSV) group. During this treatment period, the body weight was recorded weekly. At the end of 16 weeks, Animals were sacrificed under anesthesia by intraperitoneally administering ketamine and xylazine following a 12-h fasting period. Lastly, liver samples were removed from three different groups, immediately frozen in liquid nitrogen and then stored at -70 °C until use.
Cell culture
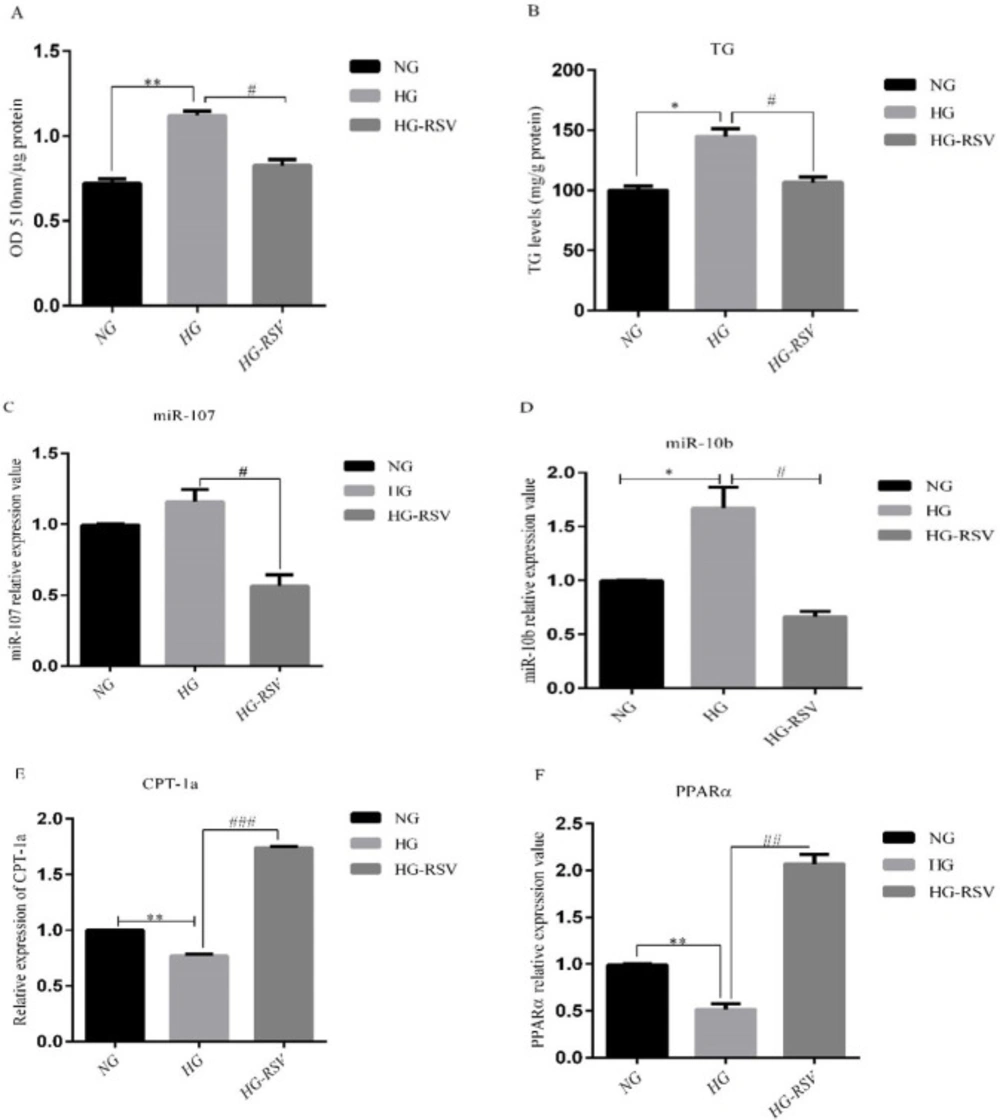
HepG2 cells were cultured in Dulbecco ʼs Modified Eagle ʼs Medium (DMEM) supplemented with 10% FBS (fetal bovine serum), 100 U/mL penicillin and 100 g/mL streptomycin at 37 °C in a humidified atmosphere containing 5% CO2. All experiments were performed when the cells reached about 50-70% confluence. HepG2 cells were treated with high glucose (33 mM) to induce steatosis and a dose of 20 µM of RSV for 24 h.
Oil Red O staining
Hepatic lipid accumulation was stained using Oil red O method as described previously (
23). After treatment, the cells were washed three times with PBS and then they were incubated with formalin (10% formaldehyde, 90% PBS) for 15 min. After fixing, cells were washed 3-4 times with distilled water. Oil red O solution (2 mL) was then added to each well and incubated at 37 °C incubator for 15 min. The cells were then washed several times with ddH
2O for removing background color until the solution became clear. After being dehydrated, the cells were evaluated under a light microscope. Isopropanol (200 µL) was added to each well and after shaking and incubating at room temperature for 15 min, the extract was collected and transferred to a 96-well plate to measure the absorbance at 510 nm.
Measurement of triglyceride level
Briefly, the cells or liver tissues were washed three times with PBS. RIPA working solution was added to the cells and tissues and incubated for 10-20 min on ice. Then, HepG2 cells and liver tissues were homogenized by oltrasonication methods. After centrifugation, a mixture of chloroform and methanol (2:1) was added to the supernatants. After mixing and then incubating for 30 min, samples were centrifuged at 12000g, for 5 min. The upper solution was removed and the lower solution was dried at 70 °C. Then, after adding PBS to dried solution, triglyceride content was determined using commercial kit (Pars Azmon, Iran). The results were normalized against total protein level. Total protein level was measured by BCA (bicinconic acid) kit.
RNA extraction and Real-time quantitative PCR
Total RNA from liver tissue and HepG2 cells were isolated using GeneAll RibospinTM kit (GeneAll Biotechnology, South Korea). miRNA was isolated with miRNeasy mini kit (Qiagen, Biorain, Iran). The quality and quantity of the RNA and miRNA were assessed by electrophoresis and Nanodrop 2000. Complementary DNA (cDNA) was reverse transcribed using a RevertAid First Strand cDNA Synthesis Kit (Thermo Fisher Scientific). The expression of miR-107 and miR-10b and CPT-1a and PPARα genes were measured by quantitative Real-time PCR using miScript SYBR Green PCR kit and SYBR Green master mix. The normalization was carried out using U6 small nuclear RNA (RNU6) for miRNAs and ß-actin for the genes, respectively. The sequences of the primers used in the study are in
Table 1. The ΔΔCt method was used to compare the expression of miRNAs and genes between the groups.
Statistical analysis
Data are presented as mean ± SD. Statistical analysis was performed using SPSS 21.0 (SPSS Inc. Chicago, IL, USA). Results were analyzed by ANOVA. Differences among the groups were attained by Tukey multiple comparisons. If the p value was less than 0.05, the difference was considered statistically significant.