Effect of diet and arsenic exposure on water, arsenic, food, and calorie intakes
Daily water, food, and calorie intakes were significantly affected by type of diet and arsenic exposure (
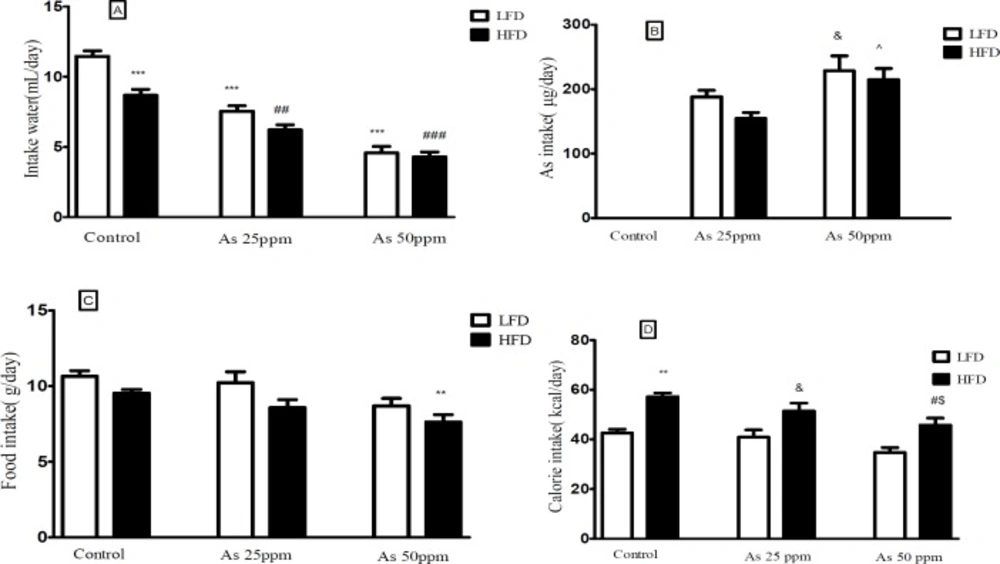
Figure 1). Control mice consumed less water on HFD than LFD mice (8.68 and 11.46 mL/day respectively,
p < 0.001). Water intake decreased in both arsenic concentration exposed animals when compared to their control groups. LFD mice exposed to As 25 and 50 ppm drank 7.53 and 4.61 mL/day respectively (
p < 0.001) and HFD mice exposed to As 25 and 50 ppm drank 6.20 and 4.29 mL/day respectively (
p < 0.01) (
Figure 1A).
| Groups | Low fat diet | High fat diet |
|---|
| Variables |
|---|
| TG | 92.4 ± 3.1 | 73.2 ± 5.1 | 69.1 ± 3.3 | 121.5 ± 10.6* | 87.7 ± 3.5# | 63.4 ± 2.4# |
| Liver TG | 53.6 ± 4.5 | 67.1 ± 9.3 | 79.5 ± 14.7 | 144.5 ± 25.8*** | 98.1 ± 13.6# | 79.7 ± 13.7## |
| Cholesterol | 93.1 ± 4.3 | 89.8 ± 6.7 | 101.5 ± 11.5 | 192.8 ± 13.9** | 170.6 ± 11.6&& | 158.8 ± 21.4#$ |
| HDL | 83.4 ± 6.8 | 80.5 ± 6.5 | 80.8 ± 4.9 | 113.1 ± 11.7** | 117.5 ± 10.5&& | 110.8 ± 8.4$$ |
| LDL | 13.8 ± 5.2 | 14.5 ± 3.6 | 16.1 ± 3.5 | 27.5 ± 3.4** | 24.3 ± 4.2& | 20.1 ± 7.5# |
| VLDL | 18.5 ± 0.7 | 14.6 ± 1.0 | 13.8 ± 0.8 | 24.3 ± 2.2* | 17.5 ± 0.7# | 12.6 ± 0.6# |
& and p < 0.05,
, && and p < 0.01,
p < 0.001.
| Groups | Low fat diet
| High fat diet
|
|---|
| Variables | Control | As 25 ppm | As 50 ppm | Control | As 25 ppm | As 50 ppm |
|---|
| Diameter of islets | 394.5 ± 36.1 | 265.2 ± 25.1 | 107.4 ± 13.3 | 358.6 ± 31.7* | 217.8 ± 23.5# | 91.9 ± 9.4# |
: Significantly different from LFD,
Significantly different from HFD,
, # p < 0.05.
A) Intakes of water, (B) As, (C) food, and (D) calories by control LFD or HFD fed and As 25 or 50 treated LFD or HFD mice. Values represented as mean ± SD (n = 12, for A-D).*: Significantly different from LFD, #: Significantly different from HFD, &: Significantly different from LFD + As 25 ppm, ^: Significantly different from HFD + As 25 ppm, $: Significantly different from LFD + As 50 ppm. *, #, &, ^ and $ p < 0.05, ** and ## p < 0.01, *** and ### p < 0.001
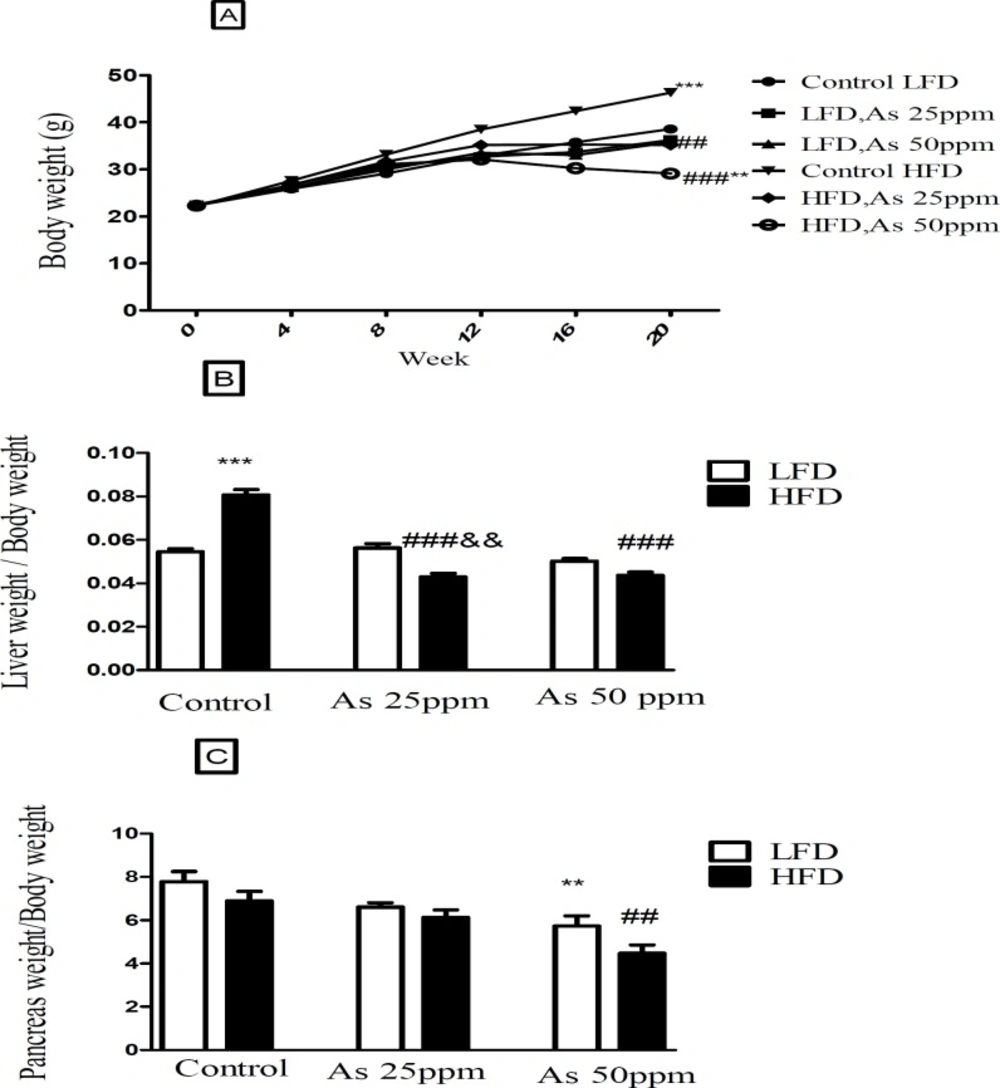
Bodyweight and liver and pancreas weight to body weight ratio in control LFD or HFD fed and As 25 or 50 treated LFD or HFD mice. (A) Body weight. (B) Liver weight to body weight ratio. (C) Pancreas weight to body weight ratio. Values represented as mean ± SD (n = 12, for A-C). *: Significantly different from LFD, #: Significantly different from HFD, &: Significantly different from LFD + As 25 ppm. **, ## and && p < 0.01, *** and ###, p < 0.001
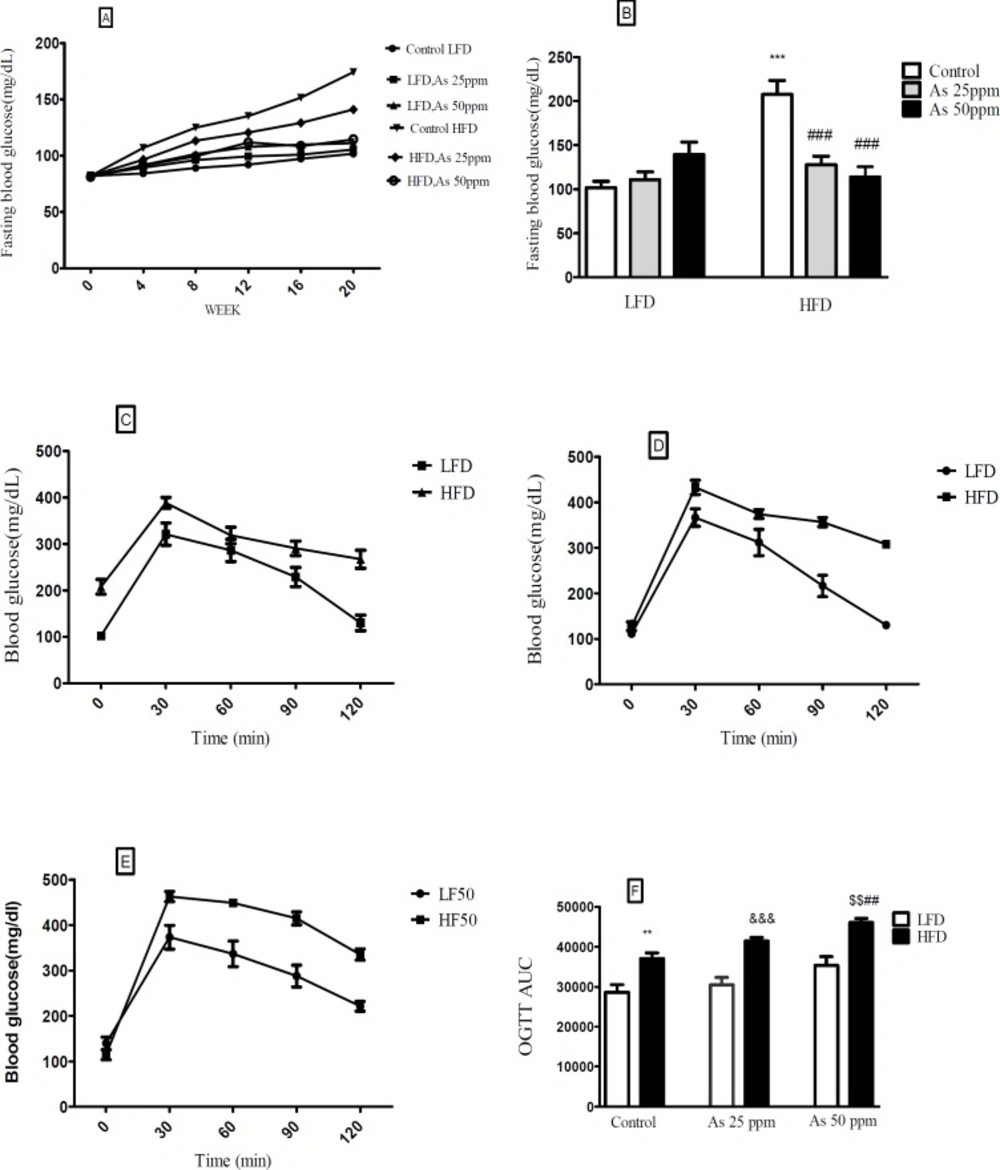
Effects of As exposure on blood glucose and OGTT in control LFD or HFD fed and As 25 or 50 treated LFD or HFD mice. (A) Fasting blood glucose; (B) Fasting blood glucose after 20 weeks (C) OGTT results for control mice (D) OGTT results for mice exposed to As 25 ppm (E) OGTT results for mice exposed to As 50 ppm (F) OGTT AUC, calculated according to OGTT. Values represented as mean ± SD (n = 12, for A-F). *: Significantly different from LFD, #: Significantly different from HFD, &: Significantly different from LFD + As 25 ppm, $: Significantly different from LFD + As50 ppm. **, ## and $$ p < 0.01, ***, ### and &&& p < 0.001
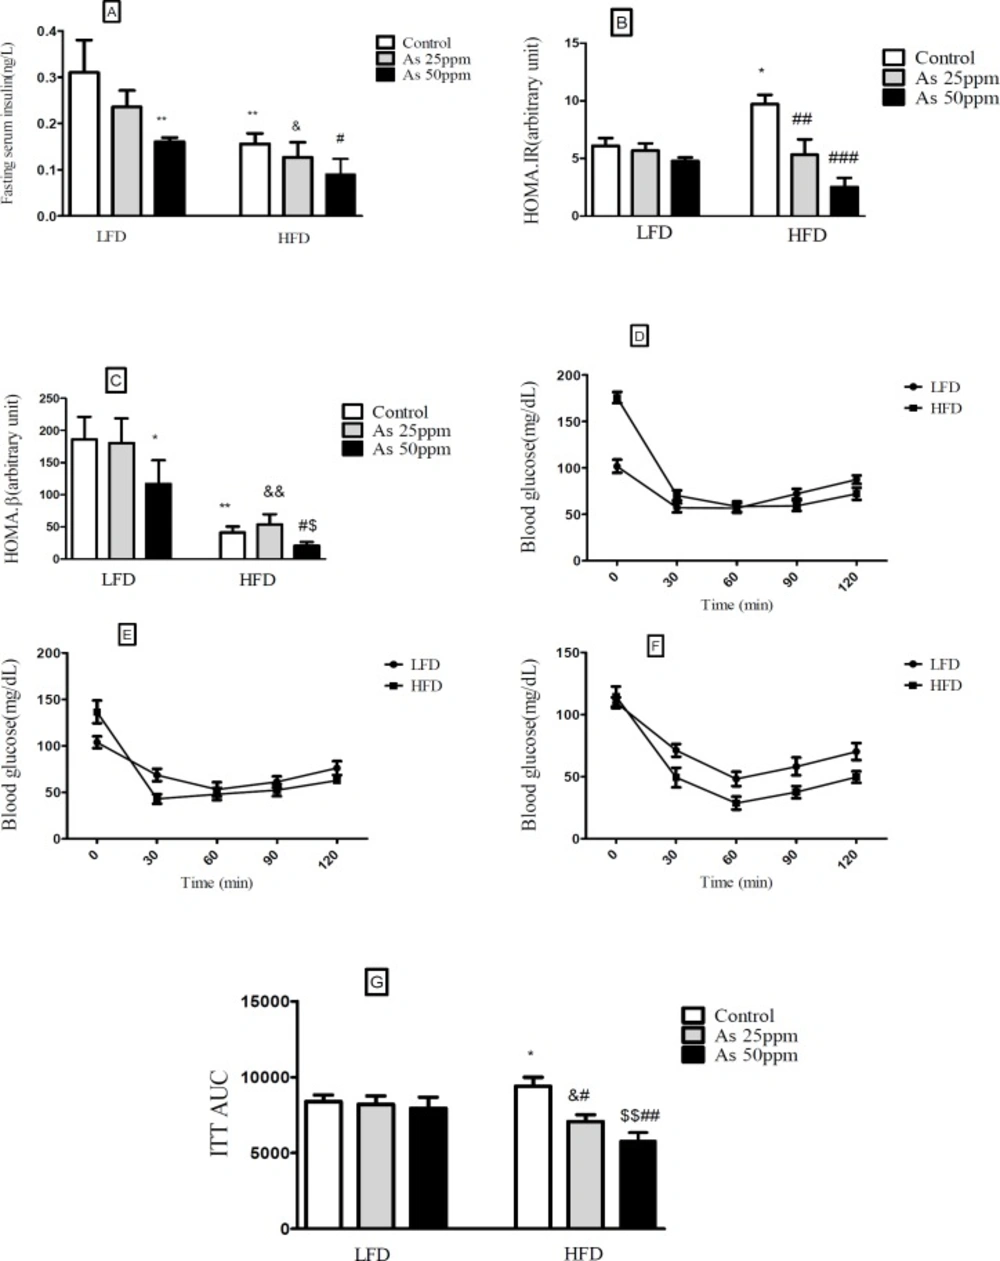
Effects of As exposure on glucose and insulin tolerance in control LFD or HFD fed and As 25 or 50 treated LFD or HFD mice (A) Fasting plasma insulin; (B) HOMA-IR; (C) HOMA-β; (D) ITT results for control mice; (E) ITT results for mice exposed to As 25 ppm; (F) ITT results for mice exposed to As 50 ppm (G) ITT AUC, calculated according to ITT calculated. Values represented as mean ± SD (n = 12, for A-G). *: Significantly different from LFD, #: Significantly different from HFD, &: Significantly different from LFD + As 25 ppm, $: Significantly different from LFD + As 50 ppm. * #, & and $ p < 0.05, **, ##, && and $$ p < 0.01, ### p < 0.001
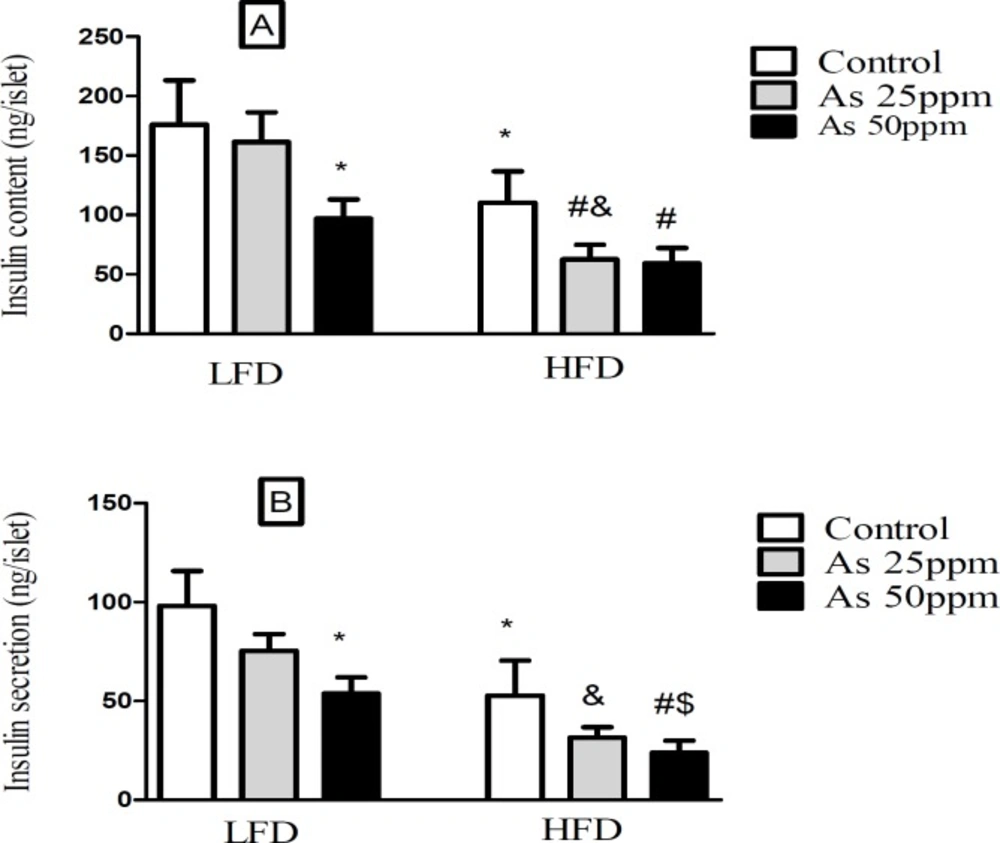
Effect of diet and As exposure on insulin secretion and content of pancreatic islets in control LFD or HFD fed and As 25 or 50 treated LFD or HFD mice (A) Insulin content; (B) Insulin secretion. Values represented as mean ± SD (n = 12, for A-B). *: Significantly different from LFD, #: Significantly different from HFD, &: Significantly different from LFD + As 25 ppm, $: Significantly different from LFD + As 50 ppm. *, #, & and $ p < 0.05
Effects of As and diet on (A) plasma leptin levels; (B) plasma adiponectin levels and (C) plasma β amylase levels in control LFD or HFD fed and As 25 or 50 treated LFD or HFD mice. Values represented as mean ± SD (n = 12, for A-C). *: Significantly different from LFD, #: Significantly different from HFD, &: Significantly different from LFD + As 25 ppm, $: Significantly different from LFD + As 50 ppm. * and # p < 0.05, **, ##, && and $$ p < 0.01, *** p < 0.001
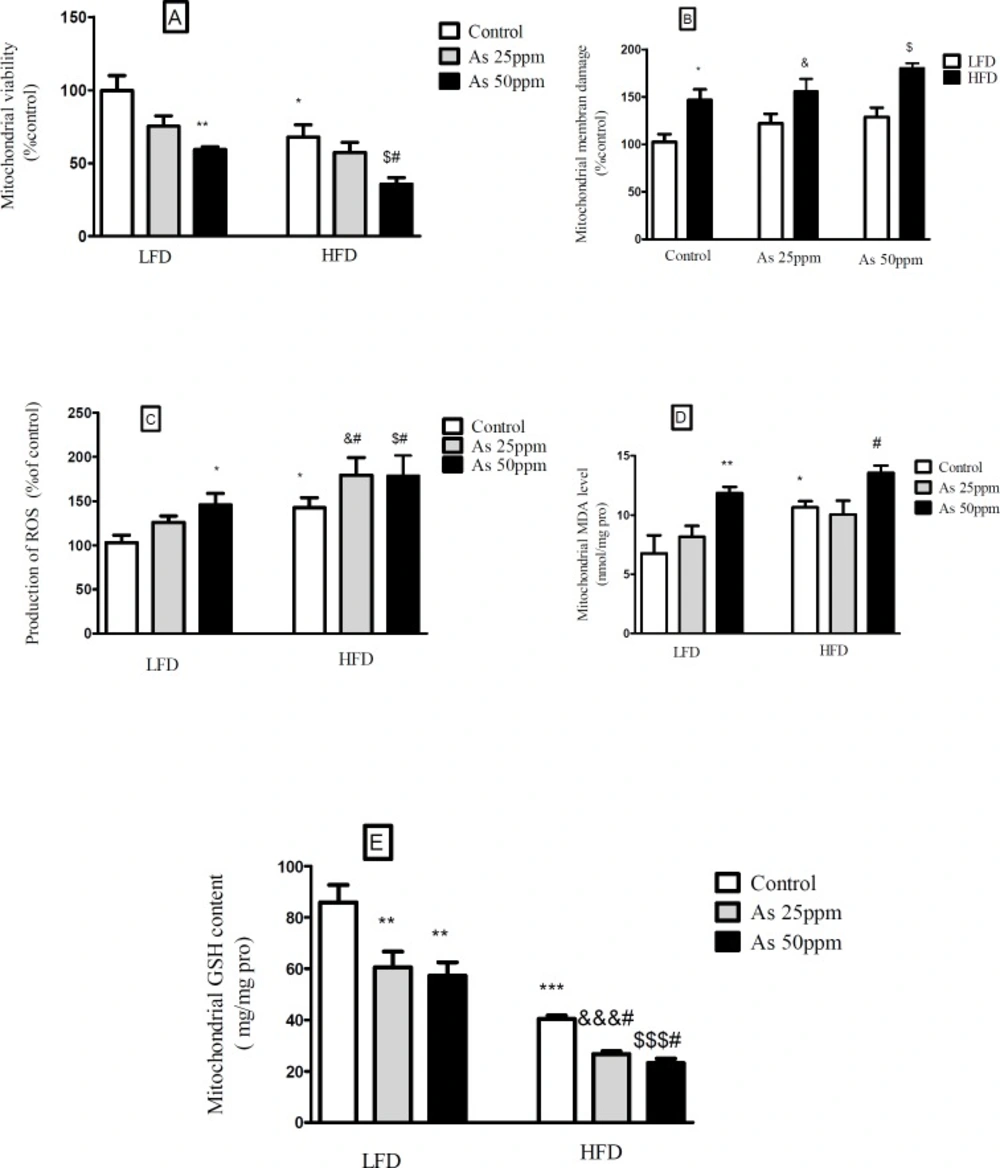
Effects of As and diet on mitochondrial oxidative stress and damage in control LFD or HFD fed and As 25 or 50 treated LFD or HFD mice. (A) Mitochondrial viability; (B) Mitochondrial membrane damage Mitochondrial GSH level; (C) Mitochondrial ROS formation; (D) Mitochondrial MDA level; (E) Mitochondrial GSH level. Values represented as mean ± SD (n = 12, for A-E).*: Significantly different from LFD, #: Significantly different from HFD, &: Significantly different from LFD + As 25 ppm, $: Significantly different from LFD + As 50 ppm. *, #, & and $ p < 0.05, ** p < 0.01, ***, &&& and $$$ p < 0.001
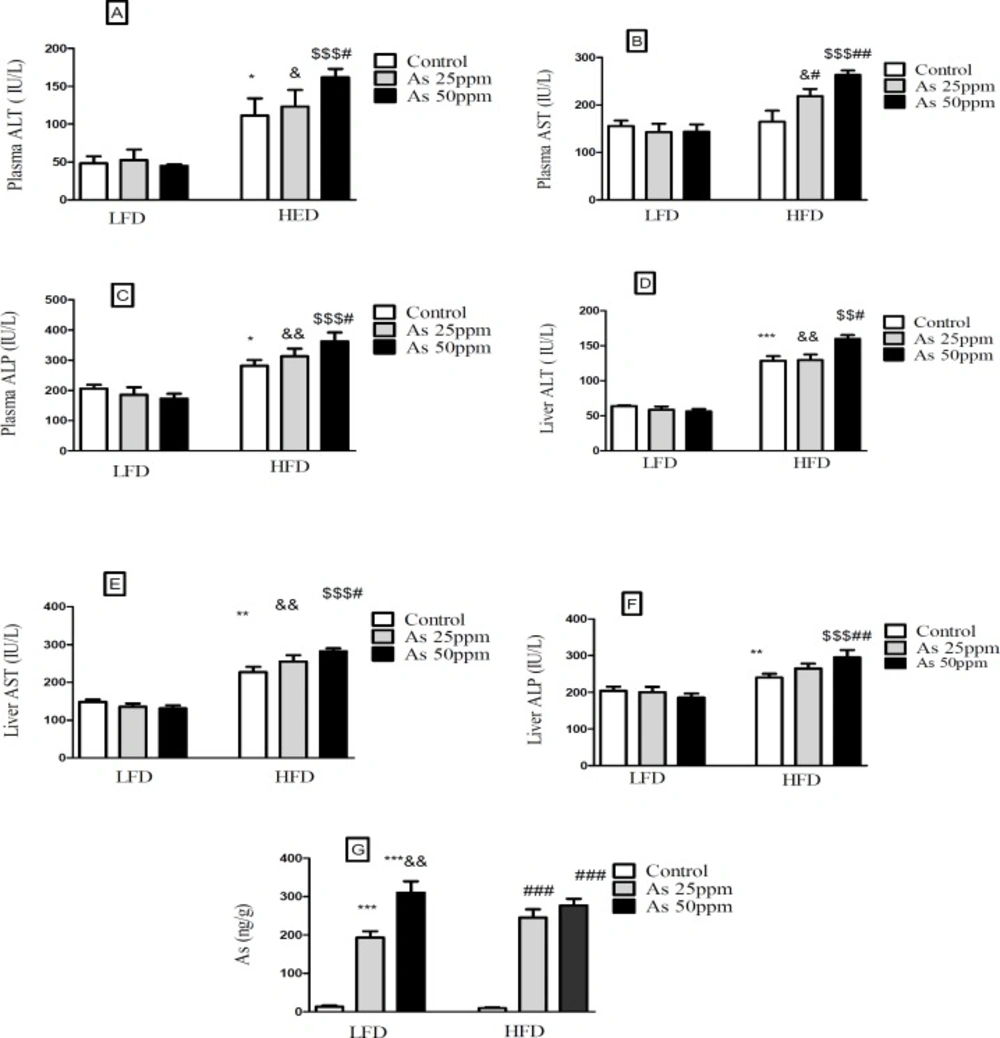
Effects of As and diet on liver and plasma levels of hepatic enzymes and Liver distribution of As in control LFD or HFD fed and As 25 or 50 treated LFD or HFD mice. (A) Plasma ALT; (B) Plasma AST; (C) Plasma ALP; (D) Liver ALT; (E) Liver AST; (F) Liver ALP (G) Liver arsenic distribution. Values represented as mean ± SD (n = 12, for A-E).*: Significantly different from LFD, #: Significantly different from HFD, &: Significantly different from LFD + As 25 ppm, $: Significantly different from LFD + As50 ppm. *, #, and & p < 0.05, **, ## and && p < 0.01, ***, ### and $$$ p < 0.001
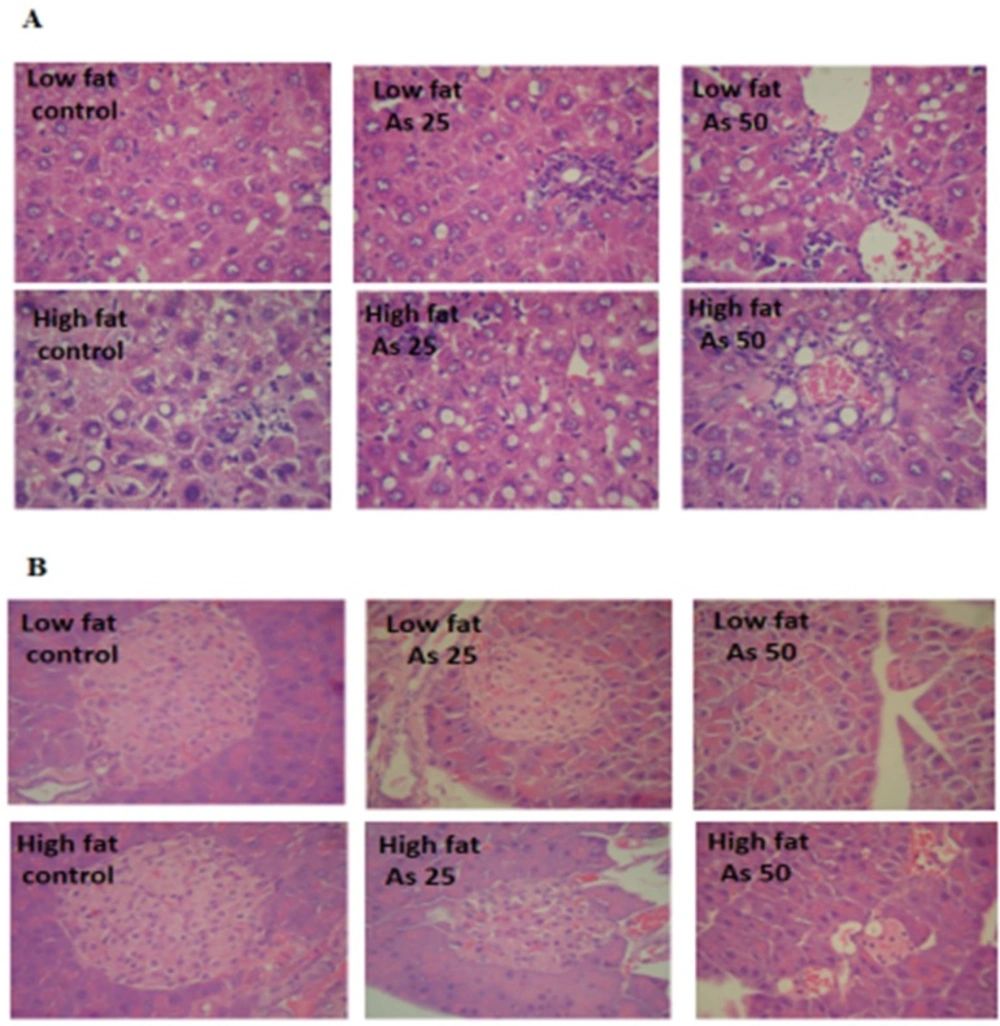
Effects of As and diet on histopathological maps: (A) Pathological maps of liver. (B) Pathological maps of pancreas
The data of average daily arsenic intakes were estimated from water intake. Mice on LFD and HFD exposed to As 25 ppm ingested As 188 and 154.83 μg/day and mice on LFD and HFD exposed to As 50 ppm ingested As 228 and 214 μg/day. These results showed a significant increase of arsenic administration in LFD + As 50 ppm compared to LFD + As 25 ppm
(
p < 0.05). Also, the same effect was observed in HFD + As 50 ppm when compared to HFD + As 25 ppm (
p < 0.05) (
Figure 1B).
In general, the mice on LFD consumed more food than the HFD mice. The mice in the control LFD, LFD + As 25 ppm and LFD + As 50 ppm, consumed 10.64 g/day, 10.21 g/day, and 8.68 g/day of food respectively and, control HFD, HFD + As 25 ppm and HFD + As 50 ppm animals fed 9.53 g/day, 8.56 g/day, and 7.63 g/day respectively. Also, the mice in the HFD + As 50 ppm group consumed less food than control LFD (
p < 0.01) (
Figure 1C).
Calorie intakes were estimated using food intake data and caloric densities of LF and HF diets. Although there were no differences between calorie intake in LFD groups, exposure to As showed a significant calorie intake decreases in the HFD groups (p < 0.05)
(57.2 calories/day for control, 51.4 calories/day for As 25 ppm, and 45.8 calories/day for As 50 ppm) (
Figure 1D).
Effect of diet and arsenic exposure on body weight and liver or pancreas weight to body weight ration
The results in
Figure 2A shows body, liver and pancreas weight for LFD and HFD fed control and arsenic treated mice. As expected, control mice fed HFD for 20 weeks weighed more than LFD control mice (
p < 0.001). Specifically, the HFD consumed mice and exposed to As 25 (35.16 g,
p < 0.01) and 50 ppm (29.08 g,
p < 0.001) weighed less than HFD controls (46.33 g). Further, arsenic exposure led to a small weight decrease in LFD fed mice while these differences were not statistically significant. The average total liver to body weight ratio was significantly greater in control HFD mice compared to LFD controls (
p < 0.001). However, arsenic exposure substantially eliminated the differences in liver to body weight ratio between HFD and LFD mice. Notably, As exposure had no statistically significant effects on liver to body weight ratio in the LFD group, this variable showed an impressive reduction in the HFD-As treated mice (
p < 0.001) (
Figure 2B).
Further, arsenic exposure decreased the pancreas to body weight ratio in both groups of LFD and HFD mice at 50 ppm (
p < 0.01) (
Figure 2C).
Effect of diet and arsenic exposure on glucose homeostasis and tolerance
FBG and OGTT were administered to evaluate glucose homeostasis and tolerance (
Figure 3). After 20 week LFD consumption, the control LFD mice showed an average FBG level of 101.83 mg/dL. The HFD feeding for 20 weeks resulted in a statistically significant FBG increase (199.33 mg/dL) in control HFD mice (
p < 0.001). Moreover, lower FBG levels in HFD mice exposed to 25 and 50 ppm arsenic (127.16 and 114.5 mg/dL respectively) was detected in comparison with control HFD group (
p < 0.001). The exposure to As showed a tendency to increase FBG in the control LFD (101.83 mg/dL), LFD + As 25 ppm (111 mg/dL), and LFD + As 50 ppm (139.5 mg/dL) groups and these differences were not statistically significant (
Figures 3A-B).
Regardless of diet or arsenic exposure, OGTT induced a characteristic rapid rise in blood glucose and peaking within 30 min of glucose challenge. Also, this peaking was followed by a gradual decrease that indicate glucose uptake by the liver and peripheral tissues. Blood glucose levels of LFD fed mice peaked at 353 mg/dL and approached at the baseline levels after 120 min glucose challenge, whereas HFD groups peaked at 428 mg/dL and remained elevated (
Figures 3C–E). To quantify glucose tolerance, the area under the curve (AUC) was calculated for all treatment groups. Regardless of arsenic exposure animals, AUC values were significantly higher in HFD fed mice compared with LFD groups (
p < 0.01). The average AUC values in LFD mice exposed to As 50 ppm (35335 units) were higher than LFD controls (28617 units). However, these differences did not reach at statistical significance. Further, HFD exposed to As 50 ppm increased AUC (46033 units) compared to HFD controls (37032 units) (
p < 0.01) (
Figure 3F).
Effect of diet and arsenic exposure on insulin resistance
Fasting plasma insulin (FPI) and insulin tolerance test (ITT) were measured to characterize insulin secretion in response to the glucose challenge and insulin resistance. FPI were affected by HFD and exposure to As. In general, the mice in the HFD groups showed a lower of FPI levels compared with LFD groups (
p < 0.01). Compared to control HFD mice, FPI values in HFD + As exposure decreased in a concentration dependent manner (
p < 0.05). Also, LFD + As 50 ppm revealed a significant reduction in FPI when compared to control LFD group (
p < 0.01) (
Figure 4A).
Moreover, the averages of HOMA-IR values were consistently higher in control HFD than LFD group (
p < 0.05). Arsenic exposure did not change HOMA-IR in LFD fed mice, but it decreased this index in the HFD group in a dose dependent manner (
p < 0.01 and
p < 0.001, respectively) (
Figure 4B).
Compared to LFD control mice, the value of HOMA-β was significantly reduced in HFD control group (
p < 0.05). Further, exposure to As 50 ppm significantly decreased the HOMA-β values in LFD and HFD fed mice compared to their control groups (
p < 0.05) (
Figure 4C).
In the insulin tolerance test (ITT), insulin resistance was carried out in control HFD mice compared with LFD control (
p < 0.05). Also, arsenic treatment significantly improved the insulin induced blood glucose reduction at 30 min in HFD mice. The ITT-AUC in HFD exposed to As 25 ppm (
p < 0.05) and As 50 ppm (
p < 0.01) was significantly lowered than HFD control group (
Figures 4D-G).
Effect of diet and arsenic exposure on insulin secretion and content of pancreatic islets
Islet’s insulin content and secretion decreased in HFD groups compared with LFD groups (
p < 0.05). Exposure to As 50 ppm reduced these contents and secretion in LFD and HFD groups compared to their controls (
p < 0.05). Further, As 25 ppm administration in HFD mice revealed a significant decrease in islets insulin content in comparison with HFD control group (
p < 0.05) (
Figures 5A-B).
Effect of high fat diet and arsenic on lipid profiles
Lipid profiles of fasted mice were measured in all treatment groups, and there were no statistical significant between LFD consumed groups, but consumption of HFD was associated with higher plasma TG and VLDL levels (
p < 0.05). Also, arsenic exposure decreased plasma TG and VLDL in the HFD fed mice compared to the control HFD group in a dose dependent manner (
p < 0.05). Plasma levels of cholesterol, LDL and HDL were significantly increased by HFD feeding (
p < 0.01) and, As 50 ppm exposure decreased these variables except HDL in HFD treated mice when compared to control HFD group (
p < 0.05). Further, the liver TG concentration of control HFD fed mice was higher than control LFD (
p < 0.001) and, this factor decreased in HFD + As 25 ppm (
p < 0.05) and HFD + As 50 ppm (
p < 0.01) when compared to the control HFD group (
Table 1).
Effects of high fat diet and arsenic on the plasma levels of leptin, adiponectin and β amylase
The present results showed that leptin levels were significantly greater in HFD control mice than LFD control (
p < 0.05). Further, exposure to As 50 ppm increased plasma leptin level in LFD and HFD consumed animals when compared to their control groups (
p < 0.01) (
Figure 6A). Plasma adiponectin level was significantly lower in control HFD mice compared with LFD control (
p < 0.05). Although, As 50 ppm exposure could decrease plasma levels of adiponectin in LFD fed mice (
p < 0.05), this agent increased this variable in the HFD consumed animals (
p < 0.01) (
Figure 6B). The plasma level of β amylase was significantly increased in control HFD mice compared with LFD control (
p < 0.001). Further, there was a significant difference between HFD + As exposure groups with the same groups in LFD consumed mice (
p < 0.01), but As administration in LFD and HFD fed mice did not produce impressive changes in the plasma levels of this enzyme compared to their controls (
Figure 6C).
Effects of diet and arsenic exposure on liver mitochondrial viability and damage
The results showed a significant decrease in the mitochondrial reduction of MTT to formazan in HFD consumed mice compared with LFD (
p < 0.01). Further, As 50 ppm exposure decreased mitochondrial viability in LFD (
p < 0.01) and HFD (
p < 0.05) fed groups in comparison to their controls (
Figure 7A). To uptake of cationic fluorescent dye, rhodamine 123 has been used for the measurement of mitochondrial membrane potential collapse. As shown in
Figure 7B, HFD significantly induced MMP collapse in isolated liver mitochondria (
p < 0.05), but asernic exposure had no statistically significant effects in both LFD and HFD fed mice when compared to their controls.
Effects of diet and arsenic exposure on liver mitochondrial oxidative stress
The liver was chosen as a target organ to confirm the oxidative stress based on pathological and mitochondrial analyses. Increased ROS formation is expressed as DCF fluorescence intensity unit. As shown in
Figure 7C, HFD induced a significant rise at ROS formation in liver’s mitochondria (
p < 0.05). Exposure to As 50 ppm increased this variable in LFD fed mice (
p < 0.05) when compared to its control. Also, compared to the control HFD group, over generation of ROS has been occurred in HFD As 25 and 50 ppm treated mice (
p < 0.05). The results of lipid peroxidation revealed that mitochondrial MDA level was significantly higher in the control HFD mice compared with LFD group (
p < 0.05). Also, As 50 ppm exposure significantly increased this variable in LFD (
p < 0.01) and HFD (
p < 0.05) fed mice when compared to their controls (
Figure 7D).
Glutathione assessment results showed a significant decrease in the control HFD group compared to the control LFD fed mice (
p < 0.001). Further, two doses of arsenic administration decreased more this antioxidant enzyme in LFD (
p < 0.01) and HFD (
p < 0.05) consumed animals compared to their control groups (
Figure 7E).
Effect of high fat diet and arsenic on liver and plasma levels of hepatic enzymes
Hepatic enzymes measurement indicated that plasma levels of ALT and ALP increased in the control HFD compared to LFD control group (
p < 0.05). Further, exposure to As 50 ppm increased these enzymes levels in HFD consumed animals in comparison with the control HFD group (
p < 0.05). Also, a significant plasma AST level elevation was observed after As 25 ppm (
p < 0.05) and 50 ppm (
p < 0.01) administration in HFD fed mice compared to the control HFD group (
Figures 8A-C). Liver assessment revealed that, alone HFD consumption was associated with the higher levels of AST (
p < 0.01), ALT (
p < 0.001) and ALP (
p < 0.01) compared to LFD control group (
p < 0.05). Further, exposure to As 50 ppm increased more hepatic enzymes such as AST (
p < 0.05), ALT (
p < 0.05) and ALP (
p < 0.01) in HFD consumed mice compared to the control HFD group(
Figures 8D-F).
Liver distribution of arsenic
Exposure to As 25 and 50 ppm resulted in accumulation of this agent in the liver of LFD and HFD treated mice (
p < 0.001). Also, there was a significant increase of liver’s arsenic accumulation in As 50 ppm compared to As 25 ppm (
p < 0.01) (
Figure 8G).
Histopathological Analysis
Liver lobular structures in the control LFD was clear and regular, and single layer of hepatocytes arranged around the central vein in a radial Pattern under the light microscope. However, a few numbers of hepatocytes showed fat deposit (
Figure 9A). In LFD consumed As 25 and As 50 groups, fatty changes were increased in hepatocytes. Infiltration of inflammatory cells in interstitial tissue of the livers of these animals was also observed. In control HFD, fatty changes were higher than in the control LFD fed mice. In HFD exposed to As 25 and As 50 animals, fatty change and infiltration of inflammatory cells were more than control HFD group. In addition, congestion of red blood cells was observed in HFD As 50 treated animal.
Exocrine and endocrine portion of the all pancreases revealed a normal appearance in control and experimental groups. However, in all arsenic treated groups, the diameter of islets were significantly decreased in a dose dependent manner (
p < 0.05). These results are shown in
Figure 9 and
Table 2.