
Introduction
Experimental
Results and Discussion
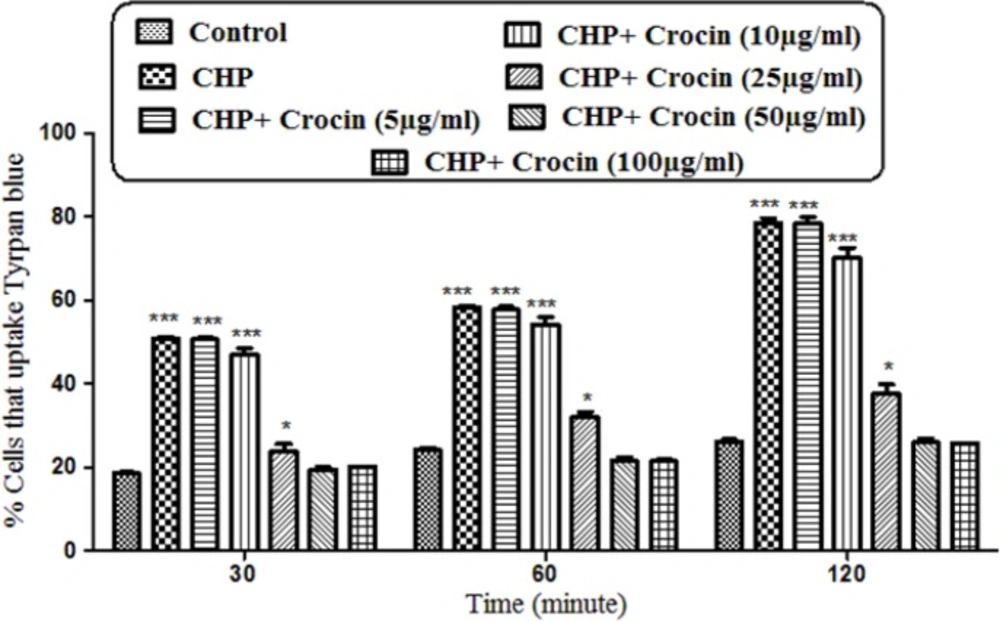
Preventing effect of different concentrations of crocin against CHP induced hepatocyte lysis. Isolated rat hepatocytes at the concentration of 106 cells/mL incubated in Krebs–Henseleit buffer pH 7.4 at 37 ºC. Determination of cytotoxicity was done as the percentage of cells that absorb trypan blue. (CHP: cumene hydroperoxide) values are shown as mean ± SD of three separate experiments (n = 3). *P < 0. 05, ***P < 0.001, significant difference in comparison with non-treated hepatocytes (control). ###P < 0.001 significant difference in comparison with CHP treated hepatocyte
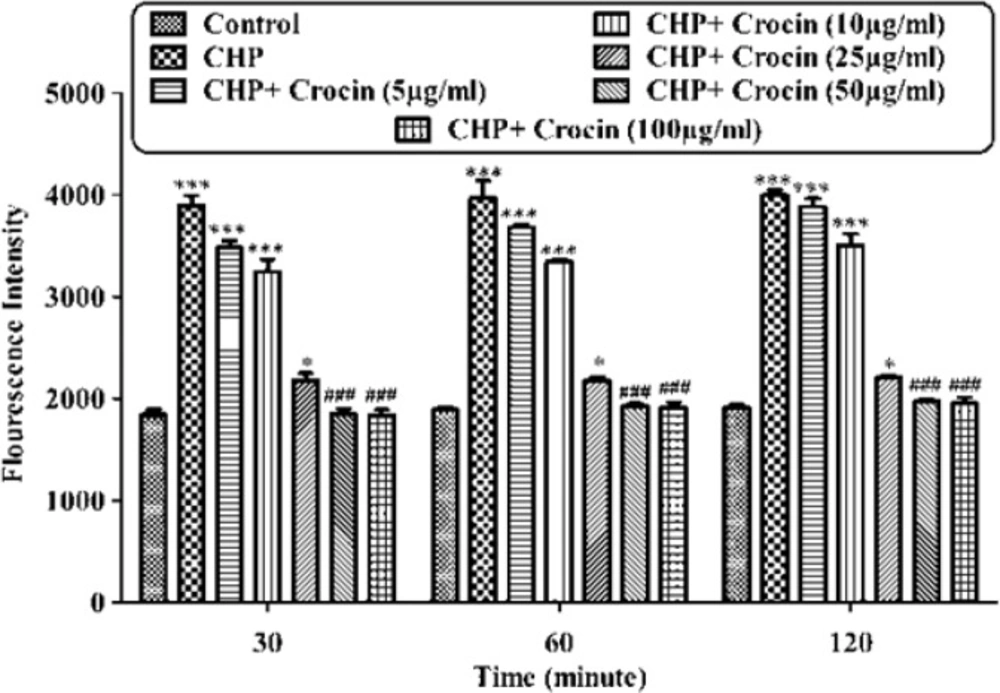
Preventing CHP induced intracellular ROS formation by different concentrations of crocin. Isolated rat hepatocytes at the concentration of 106 cells/mL were incubated in Krebs–Henseleit buffer (pH 7.4) at 37 ºC. Reactive oxygen specious (ROS) were determined spectrofluorometrically by the measurement of highly florescent DCF. (CHP: cumene hydroperoxide), values are shown as mean ± SD of three separate experiments (n = 3). *P < 0.05, ***P < 0.001, significant difference in comparison with non-treated hepatocytes (control). ###P < 0.001 significant difference in comparison with CHP treated hepatocyte
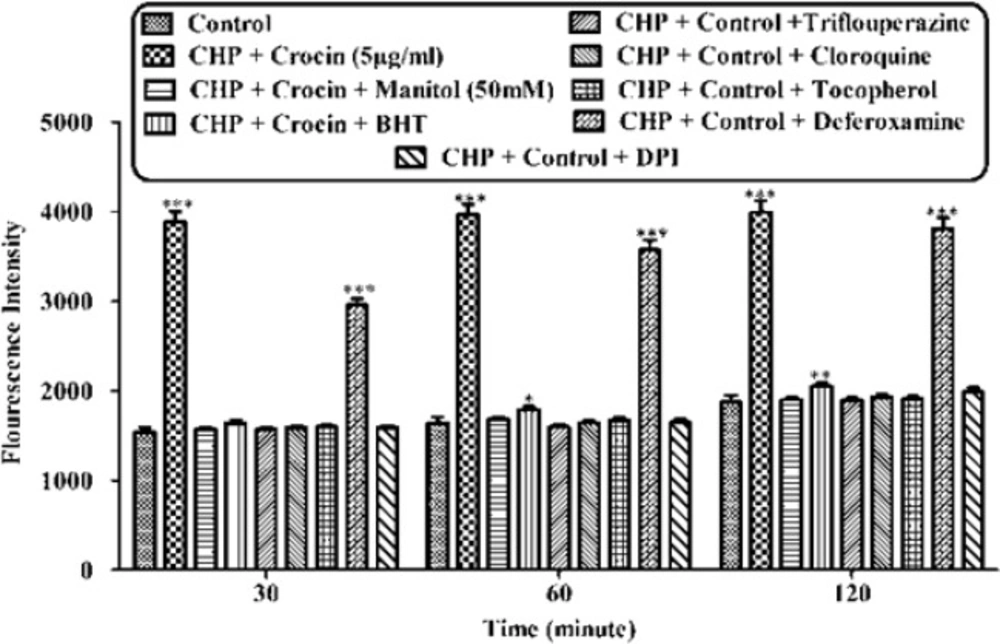
Effect of concurrent use of non-effective concentration of crocin (5 µg/mL) and lipid antioxidant, MPT pore sealing agents, ferric chelator, ROS scavengers, lysosomotropic against CHP-induced hepatocyte lysis, against CHP induced ROS formation on isolated rat hepatocytes. Isolated rat hepatocytes at the concentration of 106 cells/mL were incubated in Krebs–Henseleit buffer (pH 7.4) at 37 ºC. Reactive oxygen specious (ROS) were determined spectrofluorometrically by the measurement of highly florescent DCF. (CHP: cumene hydroperoxide) values are shown as mean ± SD of three separate experiments (n = 3). *P < 0.05, **P < 0.01, ***P < 0.001, significant difference in comparison with non-treated hepatocytes (control
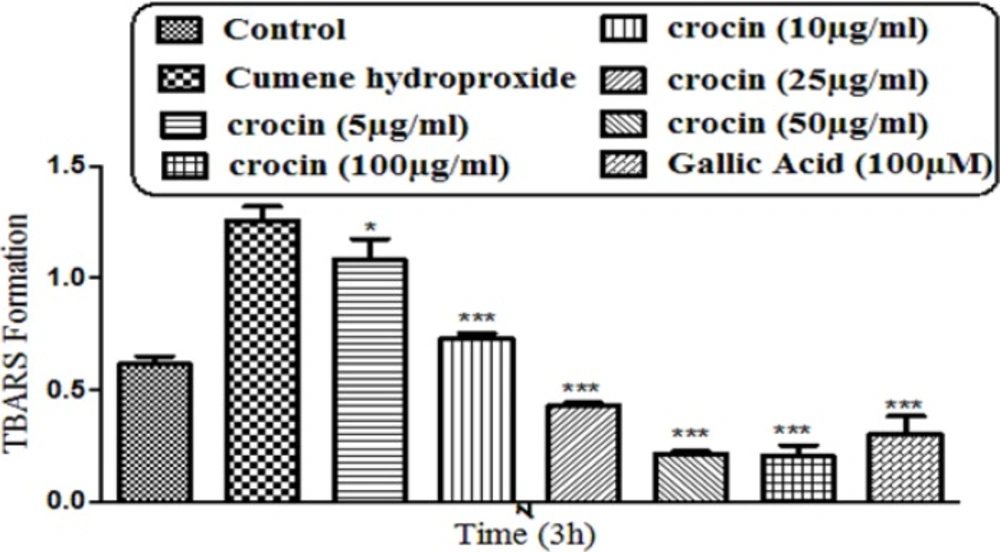
Preventing CHP induced lipid peroxidation by different concentrations of crocin and gallic acid (100 µM). Isolated rat hepatocytes at the concentration of 106 cells/mL were incubated in Krebs–Henseleit buffer (pH 7.4) at 37 ºC. TBARS formation was measured spectrophotometrically and expressed as µM concentrations. (CHP: cumene hydroperoxide) values are shown as mean ± SD of three separate experiments (n = 3). **P < 0.01, ***P < 0.001, significant difference in comparison with non-treated hepatocytes (control). ###P < 0.001 significant difference in comparison with CHP treated hepatocyte
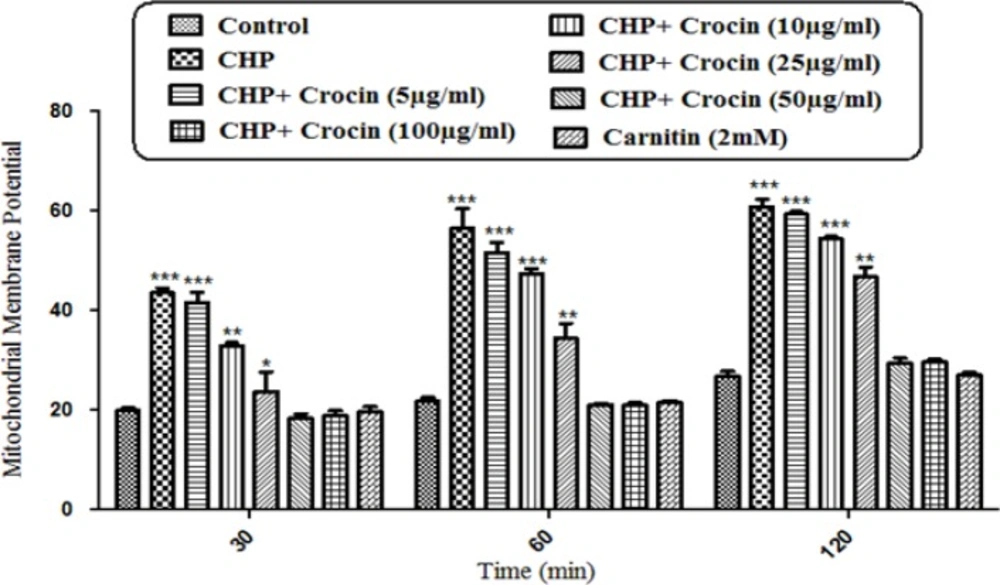
Preventing CHP induced mitochondrial membrane potential collapse by different concentrations of crocin and carnitine. Isolated rat hepatocytes at the concentration of 106 cells/mL incubated in Krebs–Henseleit buffer pH 7.4 at 37 ºC. The difference in mitochondrial uptake of the rhodamine 123 between the untreated control and CHP treated cells is the biochemical basis for the measurement of the percentage of mitochondrial membrane potential decline. Our data showed significant (P < 0.05) decrease in mitochondrial membrane potential collapse (%ΔΨm) by crocin at concentrations of 50 and 100 mg/mL, but the concentration of 50 µg/mL was better than other concentrations. (CHP: cumene hydroperoxide) values are shown as mean ± SD of three separate experiments (n = 3). *P < 0.05, ***P < 0.001, significant difference in comparison with non-treated hepatocytes (control). ###P < 0.001 significant difference in comparison with CHP treated hepatocyte
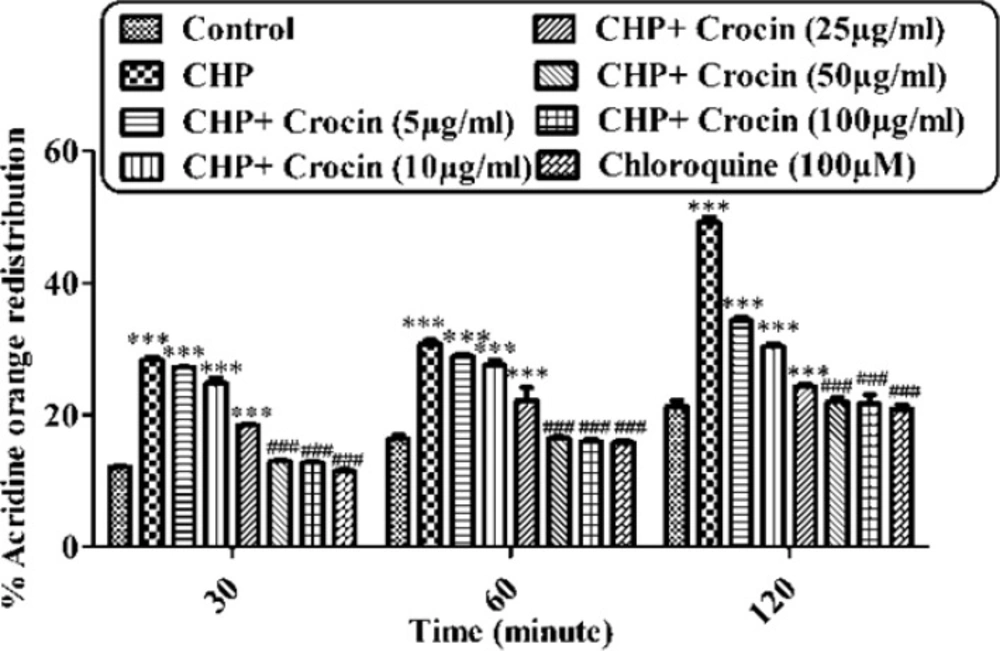
Preventing CHP induced lysosomal membrane injury by different concentrations of crocin. Isolated rat hepatocytes at the concentration of 106 cells/ml incubated in Krebs–Henseleit buffer pH 7.4 at 37 ºC. The redistribution of acridine orange from lysosomes into cytosol in acridine orange loaded hepatocytes was assigned as a biochemical basis for the measurement of lysosomal membrane injury. Highly florescent acridine orange redistribution was determined spectrofluorometrically in treated hepatocytes and shown as the percentage of hepatocytes lysosomal membrane leakage in all groups in three different time intervals (30, 60 and 120 min). (CHP: cumene hydroperoxide) values are shown as mean ± SD of three separate experiments (n = 3). ***P < 0.001, significant difference in comparison with non-treated hepatocytes (control). ###P < 0.001 significant difference in comparison with CHP treated hepatocyte
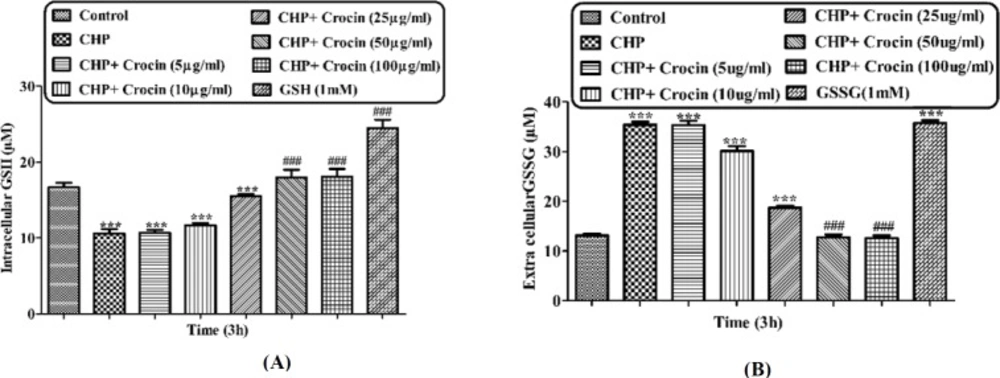
Preventing CHP induced GSH depletion by different concentrations of crocin and net values of (A) GSH and (B) GSSG. Isolated rat hepatocytes at the concentration of 106 cells/mL incubated in Krebs–Henseleit buffer pH 7.4 at 37 ºC. Intracellular GSH and extra cellular GSSG were measured spectrofluorometrically. (CHP: cumene hydroperoxide) values are shown as mean ± SD of three separate experiments (n = 3). *P < 0.05, **P < 0.01, ***P < 0.001, significant difference in comparison with non-treated hepatocytes (control). ###P < 0.001 significant difference in comparison with CHP treated hepatocyte
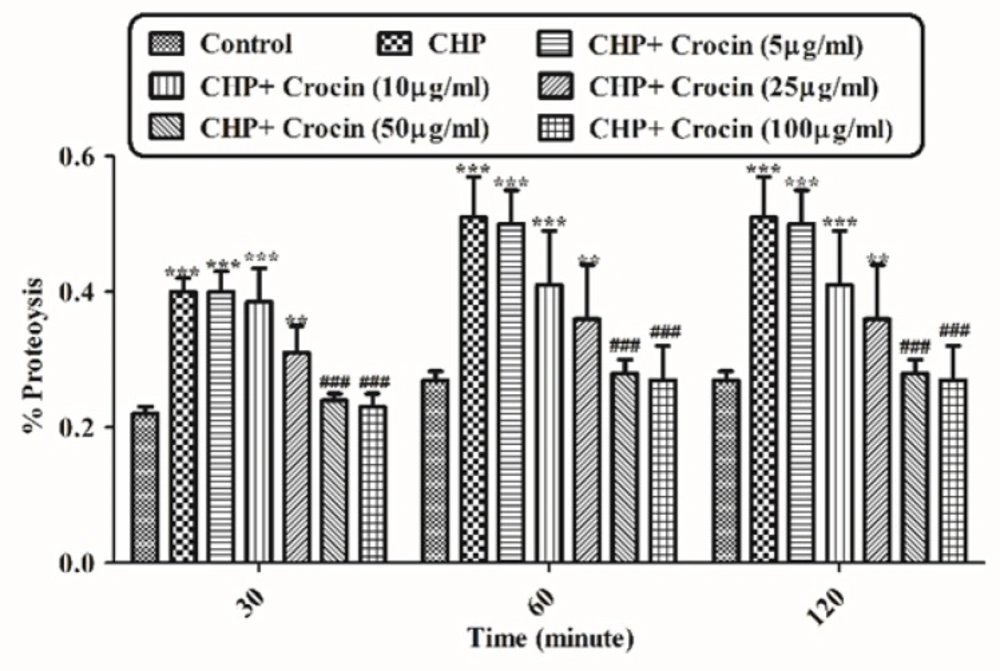
Preventing CHP induced proteolysis by different concentrations of crocin. Isolated rat hepatocytes at the concentration of 106 cells/mL incubated in Krebs–Henseleit buffer pH 7.4 at 37 ºC. Determination of proteolysis was carried out spectrophotometrically using wavelength ( max) 340 nm. Data was shown as the percentage of proteolysis in comparison with control group. (CHP: cumene hydroperoxide) values are shown as mean ± SD of three separate experiments (n = 3). **P < 0.01, ***P < 0.001, significant difference in comparison with non-treated hepatocytes (control). ###P < 0.001 significant difference in comparison with CHP treated hepatocyte

