
Introduction
Experimental
| Comp. | CSTa in IV PTZ test | Mw | Log P | ||
|---|---|---|---|---|---|
| 10 (mg/kg) | 20 (mg/kg) | (40 mg/kg) | |||
| 1 | 47.1600±1.9693**5.43×10⁻³ mmol | 52.3140±2.4462***0.01 mmol | 54.4480±2.4581***0.021 mmol | 551.93 | 4.148 |
| 2 | 59.2360±1.3163***6.02×10⁻³ mmol | 60.7280±2.8287***0.012 mmol | 61.7440±1.5745***0.024 mmol | 497.92 | 4.686 |
| 3 | 44.9820±3.07575.65×10-3 mmol | 50.9280±2.3392**0.011 mmol | 51.4475±2.7502**0.022 mmol | 530.83 | 5.782 |
| 4 | 49.9120±1.6523***5.00×10⁻³ mmol | 54.8960±2.0658***0.01 mmol | 60.8200±1.5655***0.02 mmol | 599.72 | 7.026 |
| 5 | 56.4920±1.9882***4.84×10⁻³ mmol | 57.4660±0.6922***9.68×10⁻³ mmol | 61.0825±2.4022***0.019 mmol | 619.73 | 5.786 |
| 6 | 55.7350±1.3236***4.84×10⁻³ mmol | 59.2200±2.5848***9.68×10⁻³ mmol | 62.9475±1.5580***0.019 mmol | 619.73 | 5.768 |
| 7 | 37.5525±1.26395.5×10-3 mmol | 45.7580±3.44730.011 mmol | 40.1140±1.94730.022 mmol | 544.86 | 6.035 |
| 8 | 38.1980±2.64314.73×10-3 mmol | 40.2420±1.86649.46×10-3 mmol | 40.4940±1.82750.018 mmol | 633.76 | 6.213 |
| 9 | 40.6100±1.13364.88×10-3 mmol | 43.4975±1.87629.77×10-3 mmol | 42.8500±2.36630.019 mmol | 613.75 | 27.279 |
| 10 | 44.4325±1.94335.3×10-3 mmol | 44.7020±1.01770.01 mmol | 46.2750±0.9164*0.02 mmol | 565.96 | 4.575 |
| Nifedipine | 42.0300±1.03968.66×10-3 mmol | 47.1200±1.0996**0.017 mmol | 54.4920±1.3397***0.034 mmol | 346.33 | 2.20 |
| Vehicle | 39.7040±0.8385 | ||||
Clonic seizure threshold, Data are expressed as mean ± SEM
P < 0.05,
P < 0.01,
P < 0.001 compared to vehicle group.
| Comp. | Latency of clonic seizure in IP PTZ test (sec) | Mw | Log P | ||
|---|---|---|---|---|---|
| 10 (mg/kg) | 20 (mg/kg) | 40 (mg/kg) | |||
| 1 | 589.1700±250.1900 5.43×10⁻³ mmol | 784.3300±231.0820**0.01 mmol | 1268.2000±185.9820***0.021 mmol | 551.93 | 4.148 |
| 2 | 706.3300±155.8360*6.02×10-3 mmol | 1636.3000±111.0730***0.012 mmol | 1725.7000±74.3333***0.024 mmol | 497.92 | 4.686 |
| 3 | 912.5000±238.2180**5.65×10⁻³ mmol | 874.3300±301.2010** | 1303.2000±243.5670***0.022 mmol | 530.83 | 5.782 |
| 4 | 1445.8000±160.8540***5.00×10⁻³ mmol | 1723.8000±76.1667***0.01 mmol | 1800.0000±0.0000***0.02 mmol | 599.72 | 7.026 |
| 5 | 1415.7000±243.9720***4.84×10⁻³ mmol | 1800.0000±0.0000***9.68×10⁻³ mmol | 1800.0000±0.0000***0.019 mmol | 619.73 | 5.786 |
| 6 | 1505.0000±189.5240***4.84×10⁻³ mmol | 1800.0000±0.0000***9.68×10⁻³ mmol | 1800.0000±0.0000***0.019 mmol | 619.73 | 5.768 |
| 7 | 100.000±18.58145.5×10-3 mmol | 266.3300±45.43180.011 mmol | 207.2000±61.51540.022 mmol | 544.86 | 6.035 |
| 8 | 472.6700±117.49904.73×10-3 mmol | 280.6700±149.33709.46×10-3 mmol | 247.0000±91.74860.018 mmol | 633.76 | 6.213 |
| 9 | 84.6667±9.81724.88×10-3 mmol | 416.5000±90.22599.77×10-3 mmol | 358.8300±59.90460.019 | 613.75 | 27.279 |
| 10 | 228.1700±57.94965.3×10-3 mmol | 382.6700±40.16690.01 mmol | 296.3300±93.18210.02 mmol | 565.96 | 4.575 |
| Nifedipine | 183.1700±36.76188.66×10-3 mmol | 870.0000±184.8010**0.017 mmol | 1291.7000±2111.6980***0.034 mmol | 346.33 | 2.20 |
| Vehicle | 55.6667±7.6667 | ||||
P < 0.05,
P < 0.01,
P < 0.001 compared to vehicle group.
| Compounds | frequency of clonic seizure in IP PTZ test (sec) | Mw | Log P | ||
|---|---|---|---|---|---|
| 10 (mg/kg) | 20 (mg/kg) | 40 (mg/kg) | |||
| 1 | 1.8333±0.40145.43×10-3 mmol | 1.6667±0.333330.01 mmol | 1.0000±0.3652*0.021 mmol | 551.93 | 4.148 |
| 2 | 1.5000±0.22366.02×10-3 mmol | 0.3333±0.2108***0.012 mmol | 0.1667±0.1667***0.024 mmol | 497.92 | 4.686 |
| 3 | 1.3333±0.32165.65×10-3 mmol | 1.1667±0.40140.011 mmol | 0.6667±0.3333**0.022 mmol | 530.83 | 5.782 |
| 4 | 0.5000±0.2236***5.00×10⁻³ mmol | 0.1667±0.1667***0.01 mmol | 0.0000±0.0000***0.02 mmol | 599.72 | 7.026 |
| 5 | 0.3333±0.2108***4.84×10⁻³ mmol | 0.0000±0.0000***9.68×10⁻³ mmol | 0.0000±0.0000***0.019 mmol | 619.73 | 5.786 |
| 6 | 0.3333±0.2108***4.84×10⁻³ mmol | 0.0000±0.0000***9.68×10⁻³ mmol | 0.0000±0.0000***0.019 mmol | 619.73 | 5.768 |
| 7 | 1.3333±0.2108*5.5×10-3 mmol | 1.1667±0.1667**0.011 mmol | 1.5000±0.22360.022 mmol | 544.86 | 6.035 |
| 8 | 1.6667±0.21084.73×10-3 mmol | 2.0000±0.25829.46×10-3 mmol | 2.0000±0.25820.018 mmol | 633.76 | 6.213 |
| 9 | 1.6667±0.21084.88×10-3 mmol | 2.1667±0.30739.77×10-3 mmol | 2.5000±0.56270.019 mmol | 613.75 | 27.279 |
| 10 | 2.5000±0.34165.3×10-3 mmol | 1.1667±0.1667**0.01 mmol | 1.5000±0.22360.02 mmol | 565.96 | 4.575 |
| Nifedipine | 1.8333±0.16678.66×10-3 mmol | 1.1667±0.1667**0.017 mmol | 0.6667±0.2108***0.034 mmol | 346.33 | 2.20 |
| Vehicle | 2.2000±0.2000 | ||||
P< 0.05,
P < 0.01,
P < 0.001 compared to vehicle group
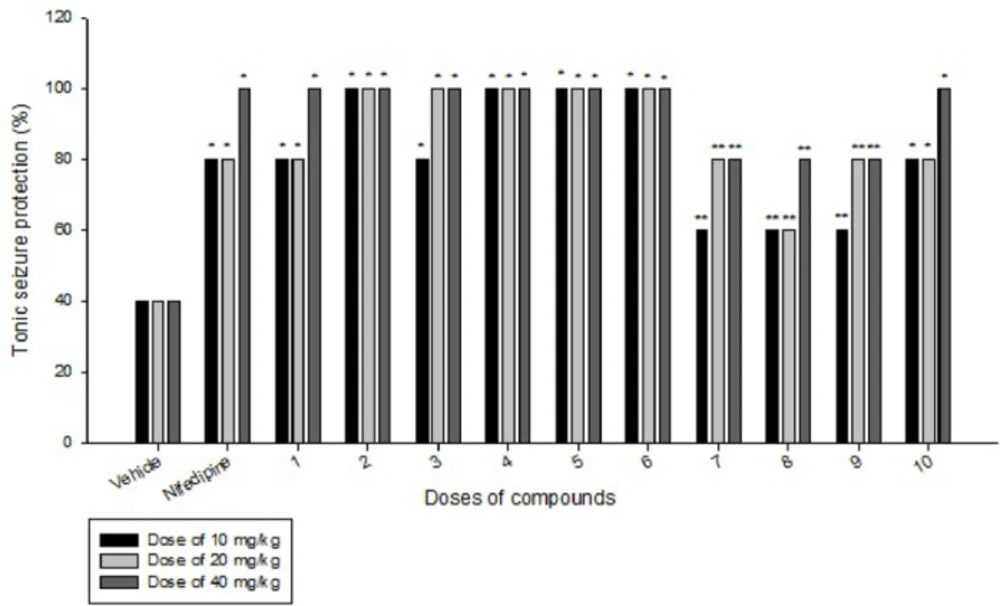
| Compounds | Tonic seizure protection (%) | p-value* | ||
|---|---|---|---|---|
| 10 (mg/kg) | 20 (mg/kg) | 40 (mg/kg) | ||
| 1 | 80 | 80 | 100 | P < 0.05 |
| 2 | 100 | 100 | 100 | P < 0.05 |
| 3 | 80 | 100 | 100 | P < 0.05 |
| 4 | 100 | 100 | 100 | P < 0.05 |
| 5 | 100 | 100 | 100 | P < 0.05 |
| 6 | 100 | 100 | 100 | P < 0.05 |
| 7 | 60 | 80 | 80 | P > 0.05 |
| 8 | 60 | 60 | 80 | P > 0.05 |
| 9 | 60 | 80 | 80 | P > 0.05 |
| 10 | 80 | 80 | 100 | P < 0.05 |
| Nifedipine | 80 | 80 | 100 | P < 0.05 |
| Vehicle | 40 | |||
p-values less than 0.05 were considered as indicative of significance.
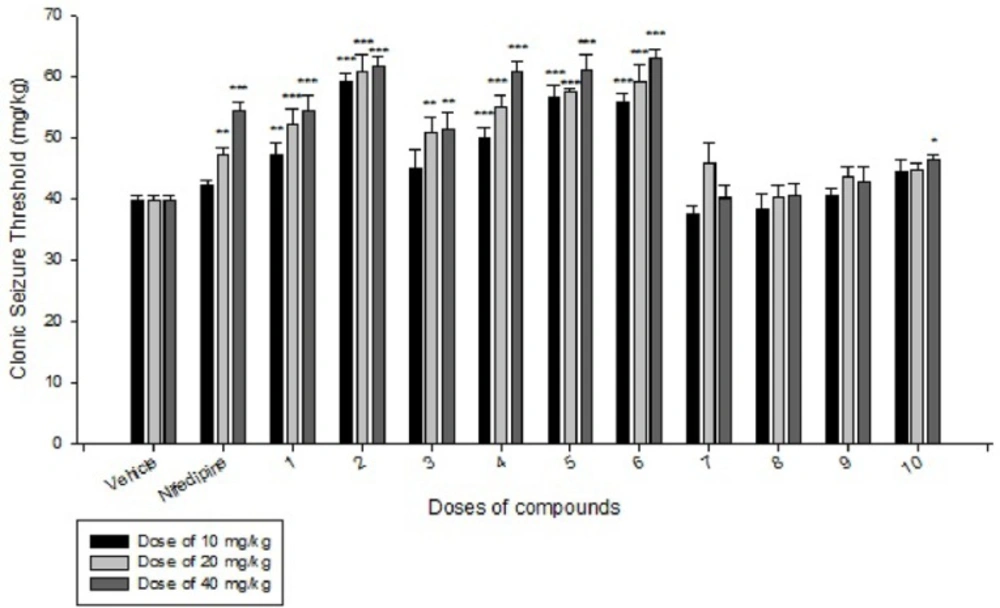
Comparison of IP administration of all compounds at dose of 10 mg/kg, 20 mg/kg and 40 mg/kg on IV PTZ-induced seizure threshold in mice: data are expressed as mean ± SEM of six mice. *P < 0.05, **P < 0.01, ***P < 0.001 compared to vehicle group
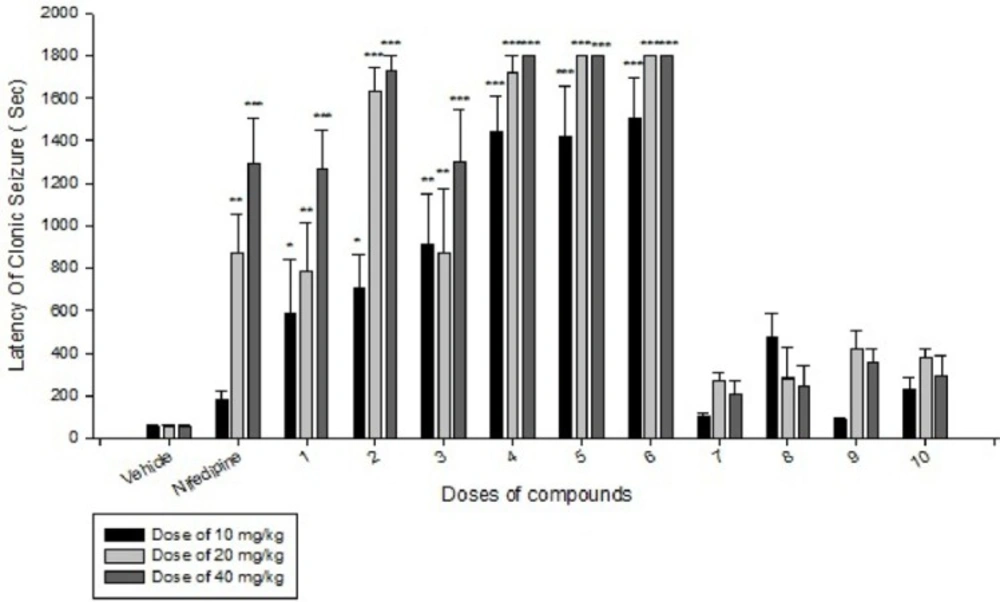
Comparison of IP administration of all compounds at dose of 10 mg/kg, 20 mg/kg and 40 mg/kg on latency of clonic seizure induced by IP PTZ in mice: data are expressed as mean ± SEM of six mice. *P < 0.05, **P < 0.01, ***P < 0.001 compared to vehicle group
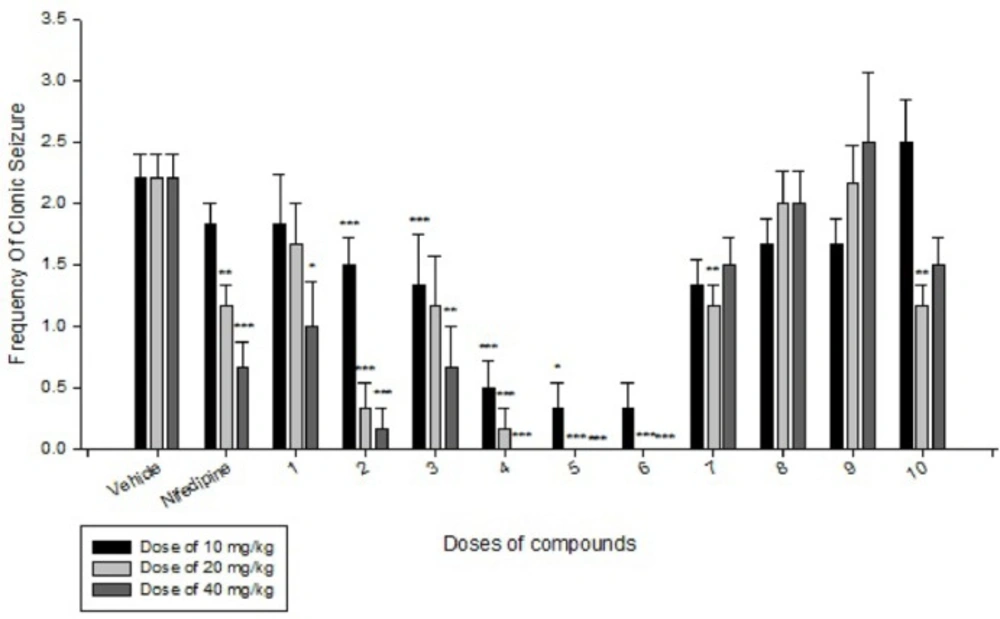
Comparison of IP administration of all compounds at dose of 10 mg/kg, 20 mg/kg and 40 mg/kg on frequency of clonic seizure induced by IP PTZ in mice: data are expressed as mean ± SEM of six mice. *P < 0.05, ***P < 0.001 compared to vehicle group
Comparison of IP administration of all compounds at dose of 10 mg/kg, 20 mg/kg and 40 mg/kg on Tonic seizure induced by MES in mice: data are expressed as mean ± SEM of six mice. *P < 0.05, **P > 0.05 compared to vehicle group
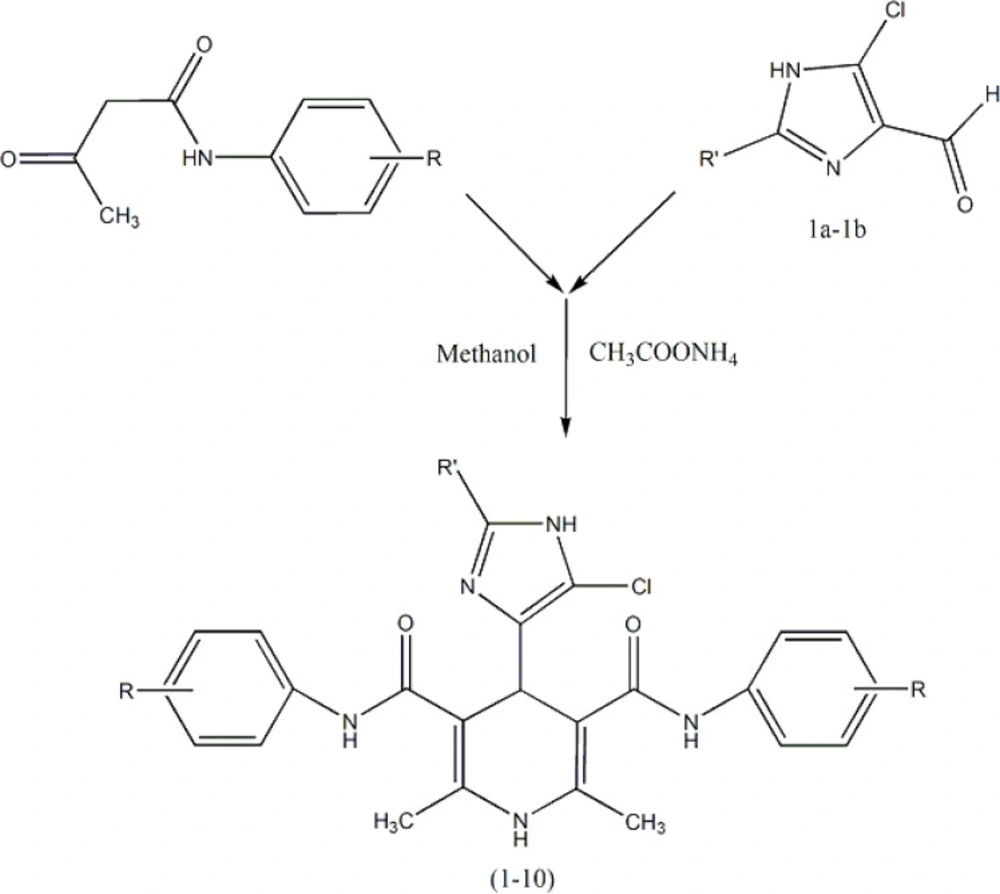
Synthetic procedure of compounds1-10.
