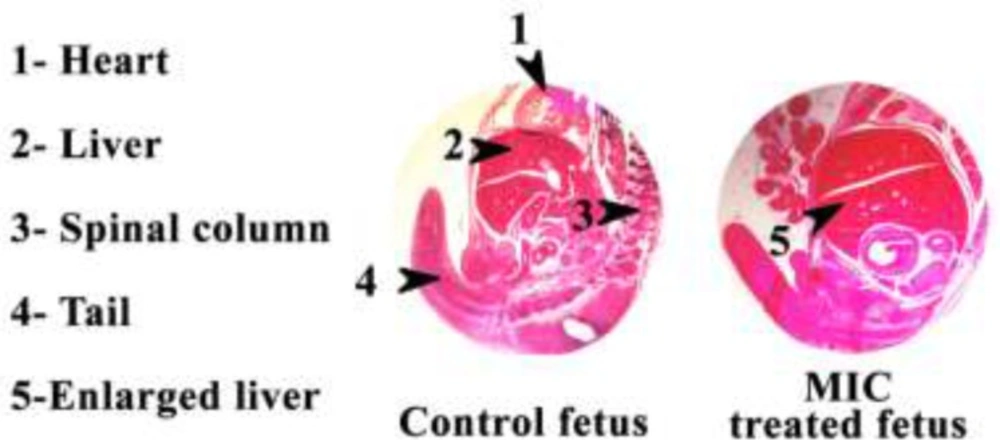
Morphological studies
Figure 1 shows the H & E stained sections photomicrographs of Control and MIC treated mouse fetus tissues. Clearly MIC treated mouse fetus liver is bigger than the control mouse fetus liver.
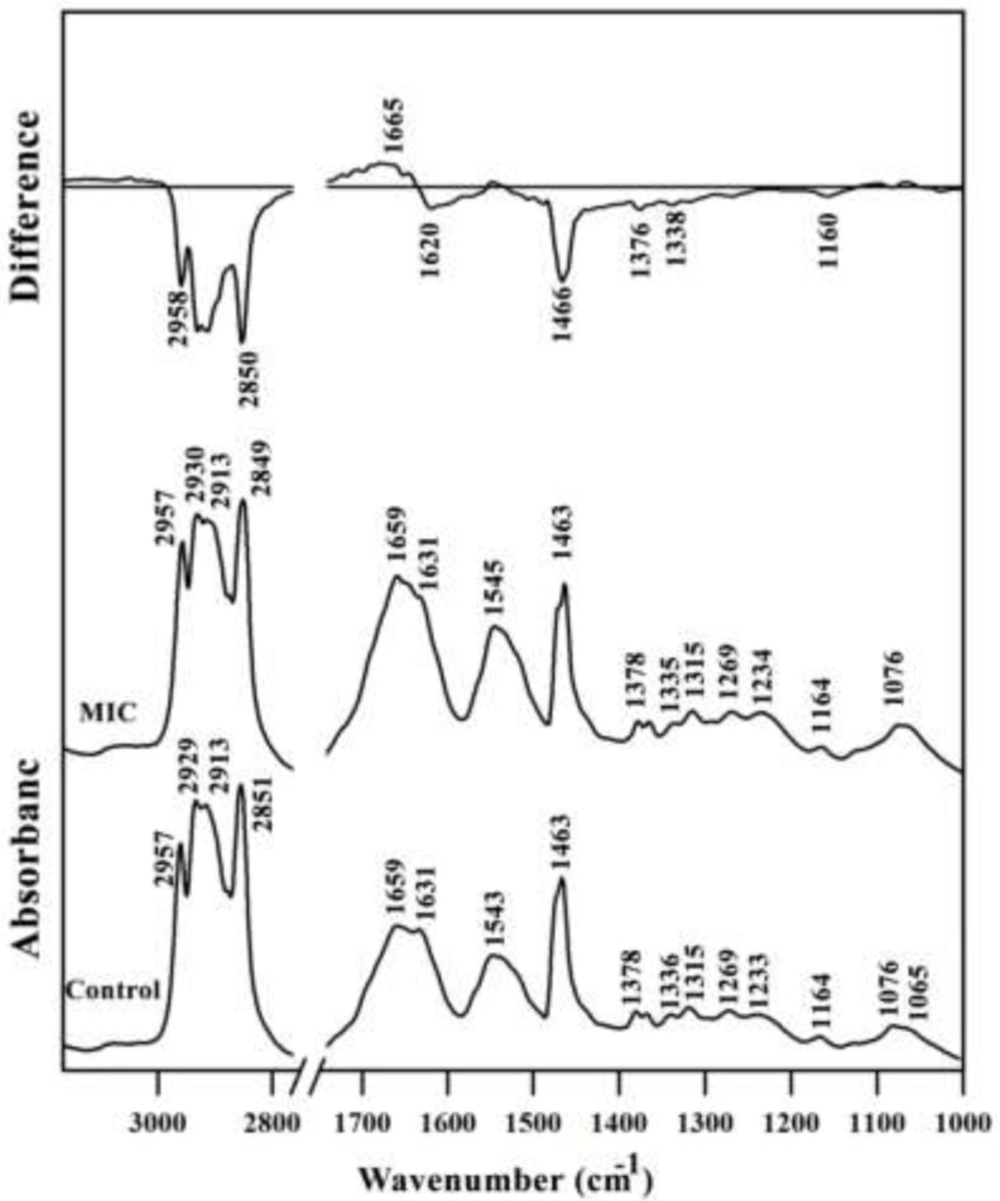
IR spectral characteristics of the drugs treated mouse fetus liver tissue
A typical FTIR spectrum of Control and MIC treated mouse fetus liver tissues is shown in
Figure 2. The information contained in such an IR absorption spectrum originates from all different types of biomolecules in the liver tissue, such as lipids, proteins, carbohydrates, and nucleic acids. The MIC treated liver tissues spectra had a lower intensity in the lipid regions (2800–3000 cm
-1 and 1466 cm
-1) compared to the control liver tissue owing to decreasing in total lipid content. The result of differential spectra for amide I region is somehow interesting; the intensity has decreased at 1620 cm
-1 but increased at 1665 cm
-1corresponding to conformational changes of proteins at the secondary structure level.
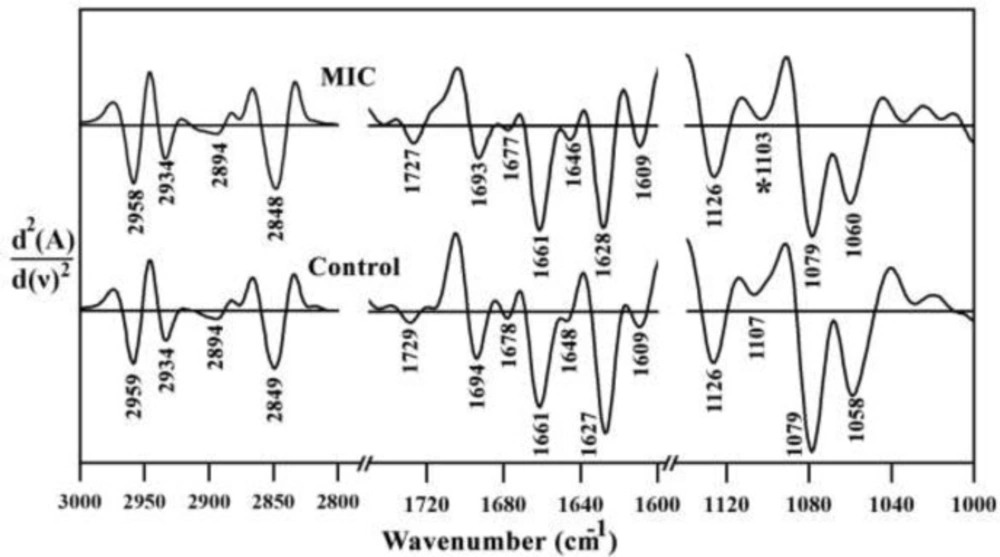
Second order derivatives results of three specific spectral regions are shown in
Figure 3. No major spectral shifting was observed for amide I, lipid, nucleic acid and carbohydrate related bands, indicating no major changes occurred in molecular level of liver tissue after the Miconazole treatment.
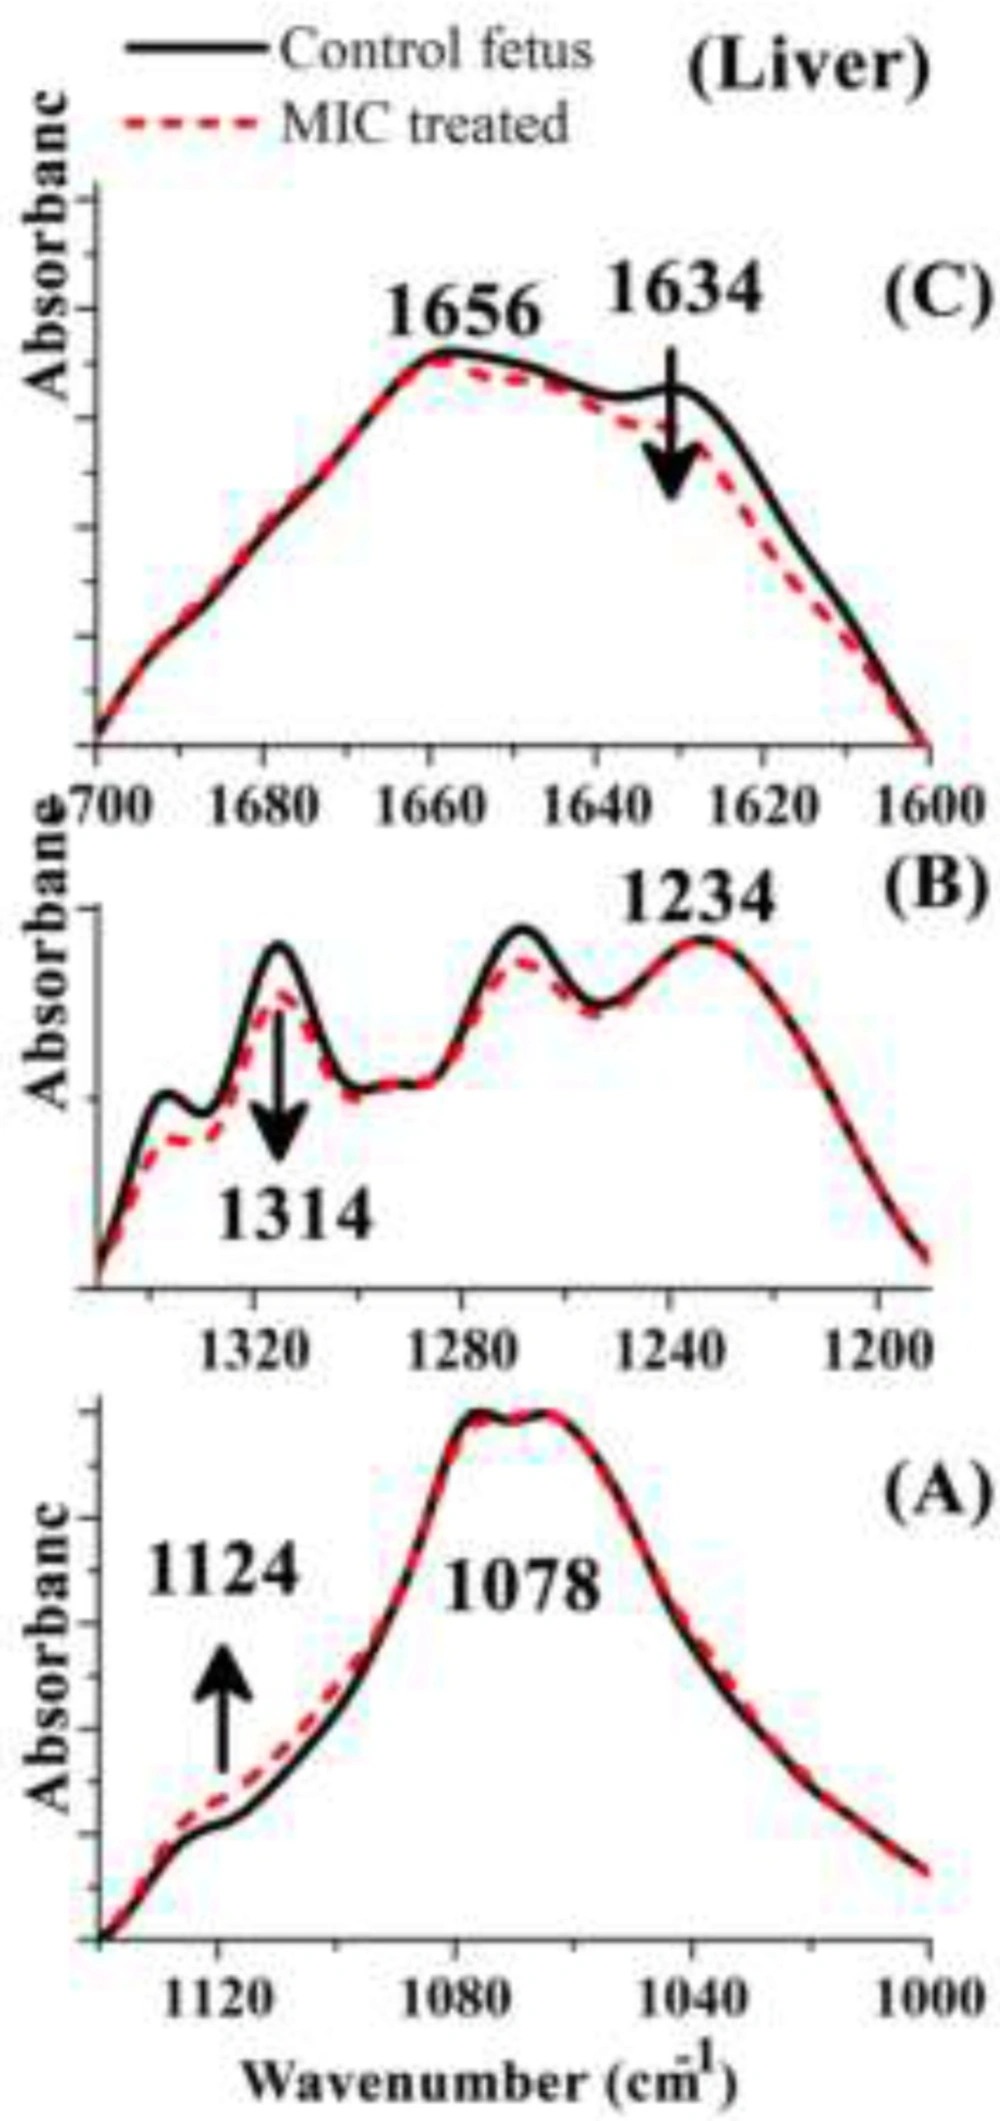
FTIR Quantitative Analysis of the Liver Tissues:
We have analyzed FTIR spectra obtained from all Control and MIC treated mouse fetus liver tissues to find spectral biomarkers that can discriminate between control and drug treated mouse fetus. Three regions were selected to show any possible variations of biomolecules content in corresponding liver tissues. These regions were cut from the whole spectra, baseline corrected, and normalized to the highest peak in each specific region just to show the spectral changes visually (
Figure 4).
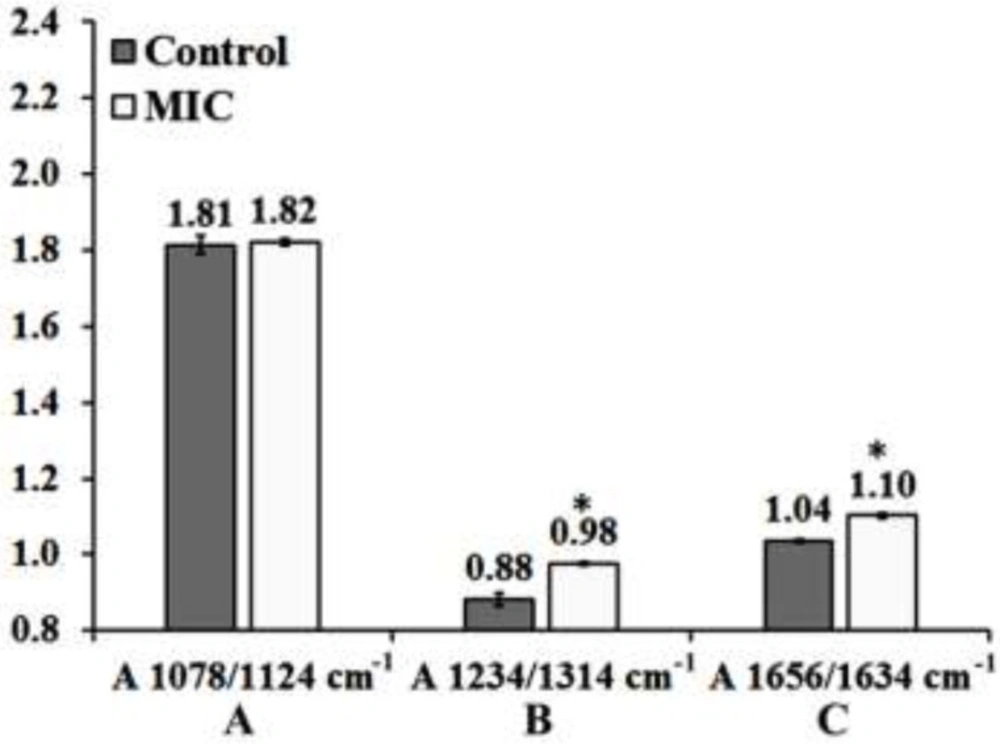
The best discriminating values were obtained by deriving the intensity ratio of two vibration modes in each region; consequently, three absorbance ratios were calculated using the peaks heights measurement. The dimensionless ratio eliminates artifact, which may arise due to the baseline contribution underneath each band (
2). The first region from 1000 to 1145 cm
−1 (
Figure 4-A) shows three overlapped absorbance bands at 1124 cm
-1 arises from RNA absorbance, at 1087 cm
-1 correspond to absorbance of the ν
s PO
2− of phosphodiesters of nucleic acids and at 1058 cm
−1 related to the O–H stretching coupled with C–O bending of C–OH groups of carbohydrates. The ratio (A1087/A1124 cm
-1) may be assumed as the features from RNA/ Total nucleic acid content ratio. The result of this ratio has been shown in
Figure 5-A and
Table 1, as the result presented there is not significant differences between Control and MIC treated tissues for this ratio. Therefore no major alternation occurred in nucleic acid content of liver tissue at the cellular level of fetus after the exposure of mother to Miconazole.
The 2nd region (from1200 to 1350 cm
−1) presented in
Figure 4-B in which plenty of overlapping vibrational modes associated with the absorbance of macromolecules such as proteins Amide III band in 1180 to 1300 cm
−1, nucleic acids asymmetric PO
2- stretching of RNA and DNA in 1220 to 1240 cm
−1, carbohydrates, and phospholipids CH
2 wagging vibration of the acyl chains in 1250 cm
−1-1400 cm
-1 are apparent in this region. The band at 1236 cm
−1 (asymmetric stretching PO
-2 of nucleic acids) is compared to the band at 1314 cm
−1 arising from Amide III band components of proteins (
3). This region was selected to derive a biomarker with outstanding statistical characteristics: A1236/A1314 ratio, assigned nucleic acid to total protein of the liver tissue presumably by which might reflect the protein synthesis activity rate in cells; lower ratios indicating higher protein synthesis rate. The mean values of this ratio for the liver tissue are presented in
Figure 5 and
Table 1. As is shown, exposure has significantly decreased protein synthesis in these cells.
The 3rd region of 1600 to 1700 cm
−1 has been shown in
Figure 4-C which is due to amide I band of proteins (highly sensitive to the conformational changes in the secondary structure). In this region the wavelength of 1650 to 1658 cm
-1 is associated with the presence of α-helix structure of proteins, while the β-sheet vibrations have been shown in 1620 cm
-1 to 1638 cm
-1. The absorbance ratio of A1658/A1630 cm
-1 is used here to measure the ratio of α-helix to β-sheet structure of mouse fetus liver cellular total proteins configurationally alterations after the exposure of mother to MIC (
Figure 5-C). The result of this ratio reveals significant difference between control and MIC treated mouse fetus liver tissues. As a comparative result to control liver tissue, it is statistically obvious that protein configurations have changed after the exposure of fetus liver tissue to Miconazole.