Placenta isolation and extraction
In this study, HPE was obtained from healthy women who had undergone cesarean section after getting verbal consent (because the placentas were discarded). Then, the placentas were processed immediately. The research procedure was approved (approval number: No. 91-6073) by the Ethics Committee of Shiraz University of Medical Sciences, Shiraz, Iran. HPE was prepared with water-soluble methods as follows. Red blood cells were removed from the placental tissue using washing buffer (50 mM Tris-HCl; 150 mM NaCl; 150 mM Sucrose, pH 7.2 each at 4 °C for 30 min). The washed tissue was then chopped using sterile scissors. Afterwards, the tissue was snap-frozen in liquid nitrogen for additional grinding, thawed, resuspended in 30 mL of homogenizing buffer (DMEM high glucose; 0.32 M sucrose; 2 mM EDTA), and sonicated on ice (amplitude 60, pulse 4, and repeat 4). After centrifugation (4500 rpm at 4 °C for 15 min), HPE was filtered by 0.45-μm filter. The protein concentration in the filtrate was determined using Bradford method and 1 mL HPE contained 50 mg protein. HPE was stored at -80 °C until use (
4,
8 and
9).
Animals
24 Sprague-Dawley male rats (weight, 180-220 g) were obtained from the laboratory animal center of Shiraz University of Medical Sciences, Shiraz, Iran. All the procedures were performed under the supervision of the Ethics Committee of Shiraz University of Medical Sciences, Shiraz, Iran and the animals were kept under standard conditions. The Ethics Committee of the university agreed with the animal experiment under approval No. 91-6073. The animals were randomly divided into four groups each including six rats. The first group received no treatment. The second group received amiodarone (100 mg/kg) for 10 days (
10). Besides, the third group received HPE (500 µl/kg) for 10 consecutive days. The forth group was treated with the same doses of amiodarone and HPE as mentioned for the second and third groups. All the administrations were done intraperitoneally for 10 days. The animals were sacrificed on the 11
th day and their lungs were removed.
The animals were anaesthetized by intraperitoneal injection of 60 mg/kg thiopental. A cannula was inserted into the trachea through a midline cervical incision while the animal was breathing. The diaphragm was punctured from its abdominal surface to produce a bilateral pneumothorax. After that, the left bronchus was ligated and the left lung was removed. Then, 4 % phosphate-buffered formaldehyde was infused into the trachea at a transpulmonary pressure of 20 cm H
2O. The trachea was then ligated when the flow ceased (
11). Afterwards, the right lung was removed from the thorax and placed in fresh fixative to complete fixation while intrapulmonary pressure was still maintained. The left lung, on the other hand, was cut into isotropic uniform random sections according to the oroientator method (
12-
14). Briefly, the left lung was sectioned according to an equidistance division circle. The pieces were cut using a sine-weighted non-equidistance division circle. After all, four circular pieces were sampled using a trocar and the areas were measured. The pieces were embedded in paraffin blocks, sectioned, stained, and their areas were measured to calculate the mean degree of global tissue shrinkage “d (shr)” using the following formula:
d (shr):= 1-[Area After/Area Before]1.5
Where, "Area After" and "Area Before" were respectively the areas of the circle after and before fixation, processing, sectioning, and staining (
13). In this study, the right lung was embedded in an agar block and systematically cut into slices starting at a uniform random point. A slicer machine was used to choose a slice thickness of 3 mm, providing about 8-12 slices from each lung. New sub-samples were also obtained by punching the slabs using a trocar through systematic random sampling method. Afterwards, the pieces were blocked in a cylindrical paraffin block and the orientator method was applied on the cylinder. Finally, 4µm isotropic uniform random sections were obtained and stained with Heidenhain's AZAN trichrome stain.
Lung volume estimation
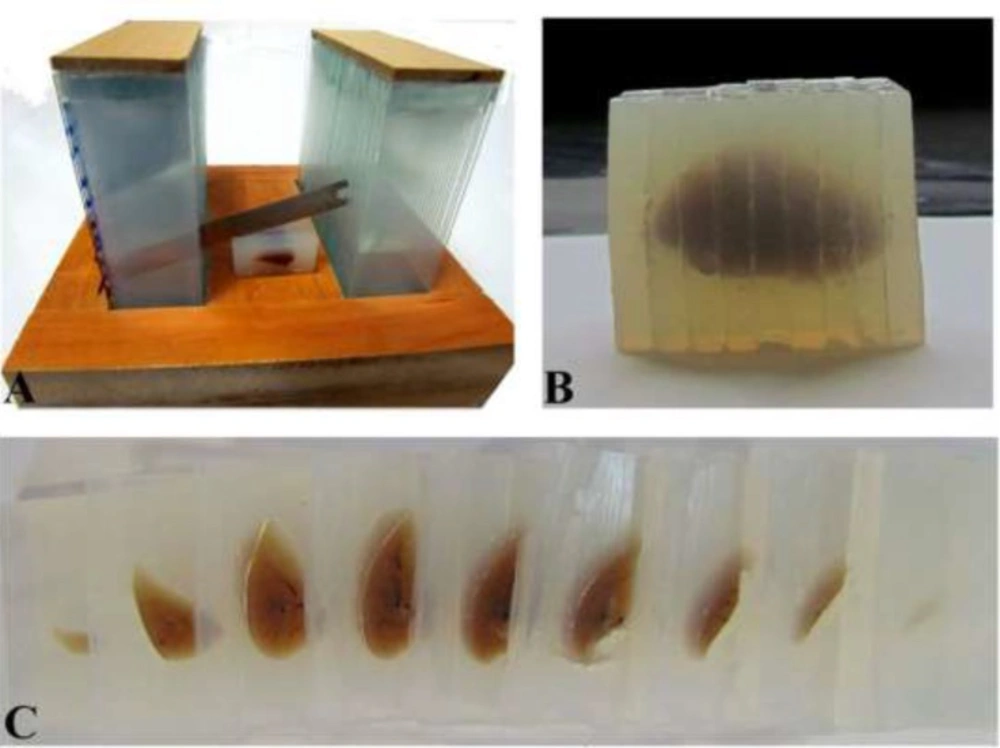
The lung volume was estimated using the Cavalieri principle on the embedded and cut tissue (
Figure 1). Also, it had to be corrected for shrinkage to achieve values for unshrunken lung volumes (
11). The images of the slabs were captured using a stereomicroscope and the areas of the slabs were estimated. The lung volume was estimated using the following formula:
V (lung, shrunken)= ∑A×T
The lung sectioning. A. The lung was embedded in an agar block and cut using a tissue slicer. B and C. The sectioned block and slabs of the lung
Where "∑A" was the areas of the slabs and "T" was the slab thickness. Moreover, the unshrunken volume of the lung was estimated using the following formula.
V(lung, unshrunken)= V(lung, shrunken) /[1 -d(shr)]
Estimation of the Coefficient of Error (CE)
The CE for the estimate of the volume; i.e, CE (V), is the function of the noise effect and systematic random sampling variance for the sums of areas. When the cross-sectional areas "∑A" were estimated by the software, CE (V) was calculated by the following formula (
15,16):
CE(V):= (∑A)-1 × [1/12 ×(3∑AiAi +∑AiAi+2 - 4∑ AiAi+1)]1/2
Volume density of the lung tissue
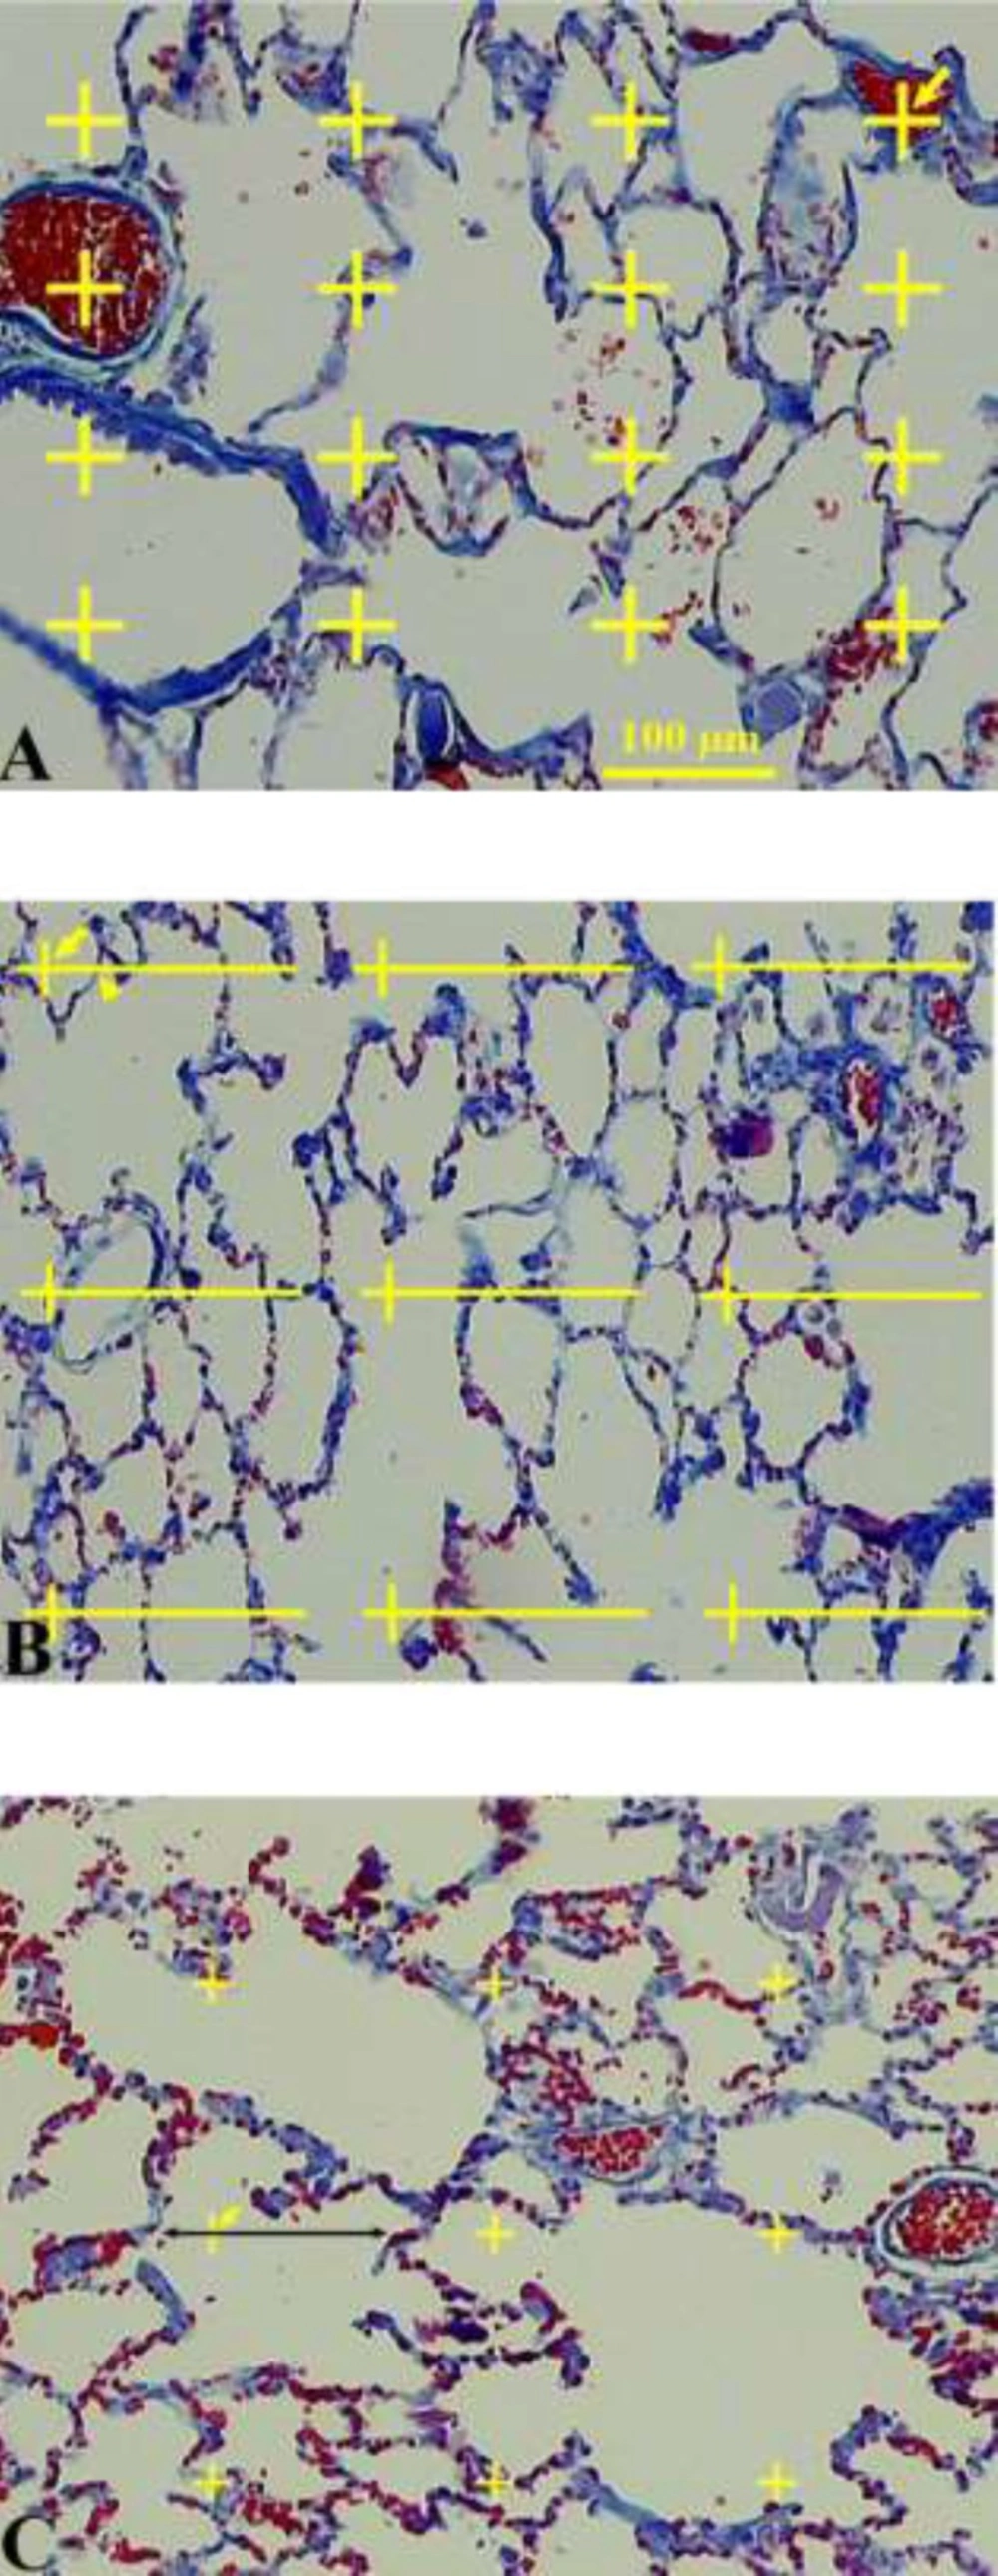
The data about the changes in the distribution of the volume fractions of the lung tissue on different subtypes of the tissue were collected using the point counting method (
Figure 2) (
11-
13). Briefly, a grid of points was superimposed upon the images of the lung sections viewed on the monitor. The right upper corner of each cross point was considered as a point. In the first step, the points hitting the parenchymal tissue and those hitting the non-parenchymal tissue were calculated at the final magnification of 40×. The parenchymal tissue includes the part of the lung tissue that belongs to alveolar septa and spaces. The non-parenchymal tissue was defined as the large connective tissue septa, walls of the larger vessels, and conductive airways and their surrounding connective tissue. Overall, 100-278 points were counted per animal. In the second step, the volume density of the alveolar septa and alveolar space was estimated at the final magnification of 400×. The volume density “Vv (structure/lung)” of the intended parameters was obtained using the following formula:
Vv (structure/lung):=P (structure) / P(lung)
A. Volume density estimation using point counting method. The number of points hitting the favored structure was divided by the total points hitting the lung tissue. The right upper corner of the crosses indicates the points (the arrows). B. Surface density estimation. The points and intersections are shown using arrows and arrowheads, respectively. C. Estimation of the volume-weighted mean alveolus volume. Each alveolus hit by a test point was sampled and the intercept length was calculated
Where "P (structure)" and "P (lung)" represented the total number of the points hitting the structural components of the tissue and the lung sections, respectively. Overall, 128-241 points were counted per animal. The total volume of the
parenchymal tissues was estimated by multiplying the volume density by V (lung, unshrunken) (
11).
V (parenchyma)= Vv (parenchymal/lung) × V(lung, unshrunken)
The total volume of the alveolar septa and space were estimated using the following formula:
V (structure)= Vv (structure/parenchyma) × V (parenchyma)
In order to estimate the surface area of the alveoli, S (alveoli), the intersections of the alveolar boundaries on the section with straight test lines of a superimposed grid were counted at the final magnification of 400× (
Figure 2) (
11). The alveolar surface area on the sections was estimated as follows: S (alveoli)= 2∑I / [(
l/p)×∑ P(lung)] × [1 -d(shr)]
1/3 × V (parenchyma).
Where "∑I" was the number of the intersections between the test lines and the alveolar septa, "l/p" was the length per test point on the counting grid, and P lung) was the number of the points hitting the lung tissue. Overall, 226-678 intersections were counted per animal.
Volume-weighted mean alveoli volume
The volume weighted mean volume (
Vv) of the alveoli was estimated by the method of point sampled intercepts (
Figure 2) (
17). This method is based on the following formula:
Where "l0" represented intercept. In brief, a test grid was overlaid on the section image of the lung at the final magnification of 400×. Each section hit by a test point was sampled and the intercept length was calculated. Due to the random orientation of the alveoli, the ruler was maintained in a horizontal position to determine the intercepts. Overall, 88-267 intercepts were estimated per animal.
Mean thickness of the alveolar septum
The mean septum thickness "τ" was estimated as:
τ =2×(Vv septum /Sv septum)
Where "Vv" and "Sv" were the volume and surface densities of the alveolar septum, respectively (
18).
Statistical analysis. The data were analyzed using Kruskall-Wallis and Mann-Withney U-tests. P<0.05 was considered as significant.