
Introduction
Being essential structural elements of cell membranes, sphingosine-containing lipids serve
significant signaling roles in the regulation of cell differentiation and growth, as well as
in cell recognition, cell migration, and inflammation (1-3). The ceramides, a key member of the
various groups of sphingolipids, have drawn particular attention for their functions in the
replication and differentiation of tumor cells (4).
The ceramide levels in some types of human tumors are much lower than in normal tissues, and
the higher the ceramide levels, the lower the degree of malignant progression (5, 6). Moreover,
various stress-related signals stimulate the generation of ceramide, which can in turn
motivate the apoptosis of cancer cells (5, 6). Therefore, different interventions in the metabolic
pathways of ceramide should influence cancer development and therapy. For instance, the
recently reported 3-hydroxy vinylboronates trigger apoptosis in Jurkat cells by regulating
sphingolipid metabolism resulting in the increase of the percentage of ceramide (7). Particularly, enzyme pathways implicated in regulating
intracellular ceramide levels might emerge as potential new targets for antineoplastic
therapy (8).
Acid ceramidase (AC) is a cysteine amidase that acts within the acidic conditions of the
lysosome to hydrolyse ceramide into fatty acid and sphingosine (9). AC is not only associated with the control of ceramide levels in
cells, but also regulates the ability of ceramide to affect the survival, growth and death
of neoplastic cells (6-8). In line with this view, some types of human cancer (e.g. colon, head and neck,
and prostate) express abnormally high levels of AC and serum AC levels are enhanced in
melanoma patients compared with control subjects (10). Furthermore, over-expression of AC makes cells more resistant than normal cells
to pharmacological induction of apoptosis, which is indicative of a role for this enzyme
that inhibition of AC activity renders tumor cells more liable to the effects of
chemotherapy and radiation (11, 12).
Despite the fact that several AC inhibitors, which can inhibit AC activity
in-vitro, have been disclosed, potent compounds capable of inhibiting
this enzyme in-vivo are still in demand, especially small-molecule
compounds (13-15). The majority of AC inhibitors reported so far include oleoylethanolamide
(OEA), D-MAPP, B-13, and their derivatives (16-21). Though useful experimentally, a common drawback of
these inhibitors is that they are structurally related with ceramide, which leads to various
limitations such as insufficient drug-likeness and inadequate activity
in-vivo (8). For this reason,
efforts have been made to discover new AC inhibitors with improved potency both
in-vitro and in-vivo.
Recently, carmofur, which is employed to treat colorectal cancers in the clinic, were
reported to be new AC inhibitors with nanomolar potency in-vivo (22). Further investigation demonstrated that carmofur can
exert anti-proliferative effects because of the dominant inhibition of acid ceramidase.
According to these findings, several derivatives, baesd on the chemical scaffold of
carmofur, were synthesized and their inhibitory activity against acid ceramidase was also
measured, leading to the discovery of new AC inhibitors (22, 23). Furthermore,preliminary
structure−activity relationship (SAR) studies were also performed (23). However, rudimentary SAR studies often fail us to understand
comprehensively the structural features required for the molecular biological activity, not
to mention that SAR studies can be used to predict the biological activity of unsynthesized
compounds. Thus, the findings obtained from SAR studies has some limitations with regard to
providing guidelines for designing drug with enhanced biological activity.
Throughout recent years, fragment-based 2D QSAR methods served as versatile tools in drug
design, among which hologram QSAR has emerged as a powerful strategy to investigate the
chemical and biological properties for various types of compounds (24). Therefore, with the goal of identifying more potent
in-vivo small-molecule inhibitors for acid ceramidase, we carried out
hologram quantitative structure–activity relationship study for the series of structurally
related 2, 4-dioxopyrimidine-1-carboxamide derivatives. On the basis of the HQSAR mode thus
established, we attempted to elucidate a quantitative structure–activity relationship to
provide useful guidelines for the design of more potent AC inhibitors.
Experimental
Data sets and Molecular modeling
The inhibitory activity of the 2,4-dioxopyrimidine-1-carboxamide inhibitors of acid
ceramidase (AC),which has been reported by Pizzirani et al. (23), was taken for the study ( Table 1). The biological data taken from the literature as IC50
value of AC inhibition was converted to the corresponding pIC50
(-log IC50) and used as dependent variable in HQSAR analysis.
The pIC50 values span a range of 4 log units, providing a broad and homogenous
data set for the HQSAR study. Taking the structural diversities and wide range of activity
into account, the compounds were divided randomly into training and test set. Meanwhile, a
little care was taken in the selection of test set compounds, so that compounds in the
training set were representative. Twenty-four of total 32 compounds were included in the
training set to derive the HQSAR model while the remaining eight compounds were used as test
set to validate the external predictability of the model. Molecular modeling studies were
performed using the SYBYL 8.1.1 software package (Tripos, L.P., USA) running on a HP Z600
workstation. The molecular structures were sketched and minimized individually using Tripos
force field. The minimum energy difference of 0.005 kcal/mol was set as a convergence
criterion.
Table 1Chemical structures, experimental and predicted activities, and residuals of compounds
included in the training set and test set.
Hologram QSAR method
Hologram QSAR is a modern QSAR technique developed from unity hashed fingerprint concept,
which employs specialized fragment finger prints as predictive variables of biological
activity (25). Compared with other existing methods
for QSAR, HQSAR avoids not only the need for 3D structure, putative binding conformations,
and molecular alignment in CoMFA (26) and CoMSIA
(27), but also the selection and calculation or
measurement of the physicochemical descriptors required by classical QSAR. HQSAR analysis
involves three main steps: the generation of substructural fragments for each of the
molecules in the training set; the encoding of these fragments into holograms; and
correlation of molecular hologram with the available biological activity.
During hologram generation, the input molecule is broken into a series of unique structural
fragments (linear, branched and overlapping) containing user-defined minimum and maximum
number of atoms. According to a predefined set of rules that encodes the frequency of
occurrence of various types of molecular fragment, the hashed fingerprint is obtained. Then,
this hashed fingerprint is divided into strings at a fixed interval as determined by a
hologram length (HL) parameter. The strings are then aligned and the sum of each column
constitutes the individual component of the molecular hologram of a particular length.
A number of parameters concerning hologram generation, such as hologram length, fragment
size and fragment distinction, prevailingly affect the HQSAR model quality (25). In order to derive the best HQSAR model, it is
necessary to discuss the effects of various combinations of parameters on the HQSAR model.
All models generated in these studies were evaluated using full cross-validated
q2, partial least squares (PLS) and leave-one-out (LOO) method.
Predictive correlation coefficient
The predictive ability of the HQSAR models was evaluated with predictive correlation
coefficient
Where SD is the sum of squared deviations between the biological activity of the test set
compounds and the mean activity of the training set molecules, and the PRESS is the sum of
squared deviations between predicted and observed activity values for every molecule in the
test set.
Results and Discussion
HQSAR analysis for the effect of various fragment distinction combinations on the
model quality
For the sake of reducing the chances of bad collisions, the defaults of the hologram
lengths are set automatically by software as several prime numbers, such as 53, 59, 61, 71,
83, 97, 151, 199, 257, 307, 353 and 401. Employing these prime numbers as hologram lengths,
several combinations of these parameters were considered using the fragment size default
(4–7) as
follows: A/B, A/B/C, A/B/C/H, A/B/H, A/B/DA, A/B/C/DA, A/B/H/DA, A/B/C/H/DA. The fragment
distinction parameters are described as follows: A, atoms; B, bonds; C, connections; H,
hydrogen atoms; DA, donor and acceptor. Due to the lack of chiral carbon atom of all the 32
molecules, the fragment distinction of chirality was not discussed in Table 2.
From what has been demonstrated in Table 2, we can
obviously see that the best statistical model was derived using atoms, bonds, connections,
donor and acceptor as fragment distinction with 6 being the optimum number of PLS components
showing cross-validated q2 value of 0.824 and conventional r2 value of
0.946.
It is interesting to note that the statistical parameters in model 1 are equivalent to that
in model 4 and the statistical parameters in model 2 are the same as that in model 3. The
same phenomenon is observed between model 5 and model 7. Furthermore, there is not distinct
difference in the statistical parameters between model 6 and model 8. Contrasting and
analyzing the models mentioned above, we found one common feature that the latter model took
into consideration an additional fragment distinction parameter, namely, hydrogen atoms,
compared with the former model. In other words, the additional selection of hydrogen flag
would do no good in ameliorating the model quality. In addition, obviously, the quality of
model 1 that factored in atoms (A) and bonds (B) is relatively satisfactory. However, the
additional selection of connections (C) or donor and acceptor (DA) led to a decrease in
model quality, which can be verified from the statistical parameters of model 2 and model 5.
Remarkably, the simultaneous introduction of connections (C) and donor and acceptor (DA)
during the model building process on the basis of model 1 resulted in the best model (model
6), which may be due to the fact that C and DA played a synergetic role in enhancing the
model quality. The synergistic action of connections (C) combined with donor and acceptor
(DA) was also embodied between model 2 and model 6. Taken together, the important role of C
and DA involved in developing the HQSAR model is indicative of the possibility that
connections and donor and acceptor complement each other for the inhibitor-enzyme
interaction, which should be still verified by experiment in future.
Table 2HQSAR analysis for the effect of various fragment distinction combinations on the key
statistical parameters using default fragment size (4-7
| Model | Fragment distinction | r2 | SEE | q2 | SEP | HL | N |
|---|---|---|---|---|---|---|---|
| 1 | A/B | 0.950 | 0.248 | 0.770 | 0.536 | 307 | 5 |
| 2 | A/B/C | 0.865 | 0.388 | 0.711 | 0.569 | 83 | 3 |
| 3 | A/B/C/H | 0.865 | 0.388 | 0.711 | 0.569 | 83 | 3 |
| 4 | A/B/H | 0.950 | 0.248 | 0.770 | 0.536 | 307 | 5 |
| 5 | A/B/DA | 0.914 | 0.318 | 0.767 | 0.524 | 353 | 4 |
| 6 | A/B/C/DA | 0.946 | 0.267 | 0.824 | 0.481 | 257 | 6 |
| 7 | A/B/H/DA | 0.914 | 0.318 | 0.767 | 0.524 | 353 | 4 |
| 8 | A/B/C/H/DA | 0.946 | 0.267 | 0.824 | 0.481 | 257 | 6 |
HQSAR analysis for the influence of various fragment size on model quality
Based on the best HQSAR model generated above (model 6, Table 2), the influence of different fragment sizes on statistical parameters was
further investigated and summarized in Table 3. As
can be seen from Table 3, the r2 values of
all models are greater than 0.89, and the q2 values are also satisfactory. The
results shown in bold fonts in table 3 indicated that
the fragment size(3-6)led to better statistical results in comparison with other fragment
sizes. Therefore, the best final HQSAR model obtained from training set with 24 compounds
was established using atoms, bonds, connections, donor and acceptor as fragment distinction
and 3-6 as fragment size with 6 being the optimum number of PLS components showing
cross-validated q2 value of 0.834 and conventional r2 value of
0.965.
Table 3HQSAR analysis for the influence of various fragment size using the best fragment
distinction (A/B/C/DA). The model chosen for analysis is highlighted in bold fonts
| Fragment size | r2 | SEE | q2 | SEP | HL | N |
|---|---|---|---|---|---|---|
| 1-3 | 0.892 | 0.348 | 0.725 | 0.555 | 401 | 3 |
| 4-7 | 0.946 | 0.267 | 0.824 | 0.481 | 257 | 6 |
| 3-10 | 0.933 | 0.298 | 0.721 | 0.606 | 353 | 6 |
| 1-4 | 0.912 | 0.315 | 0.781 | 0.495 | 83 | 3 |
| 2-5 | 0.934 | 0.272 | 0.807 | 0.466 | 151 | 3 |
| 3-6 | 0.965 | 0.214 | 0.834 | 0.468 | 257 | 6 |
| 5-8 | 0.939 | 0.283 | 0.762 | 0.560 | 353 | 6 |
| 6-9 | 0.934 | 0.295 | 0.740 | 0.585 | 353 | 6 |
| 7-10 | 0.927 | 0.309 | 0.736 | 0.589 | 353 | 6 |
The evaluation of HQSAR model quality
Since the structure encoded within a 2D fingerprint is directly related to biological
activity of molecules, the HQSAR model is able to predict the activity of structurally
related molecules according to its fingerprint. In virtue of the finally accepted QSAR model
showing non-cross-validated (r2 =0.965) and cross-validated (q2
=0.834) correlation coefficients, which manifested a good internally predictive power,
the predicted pIC50 values of both test set and training set compounds are listed
in Table 1. Furthermore, the graphic results for the
experimental versus predicted activities of both training set and test set are displayed in
Figure 1. The constructed HQSAR model has good
agreement between experimental and predicted values for the test set compounds with the
higher predictive correlation coefficient
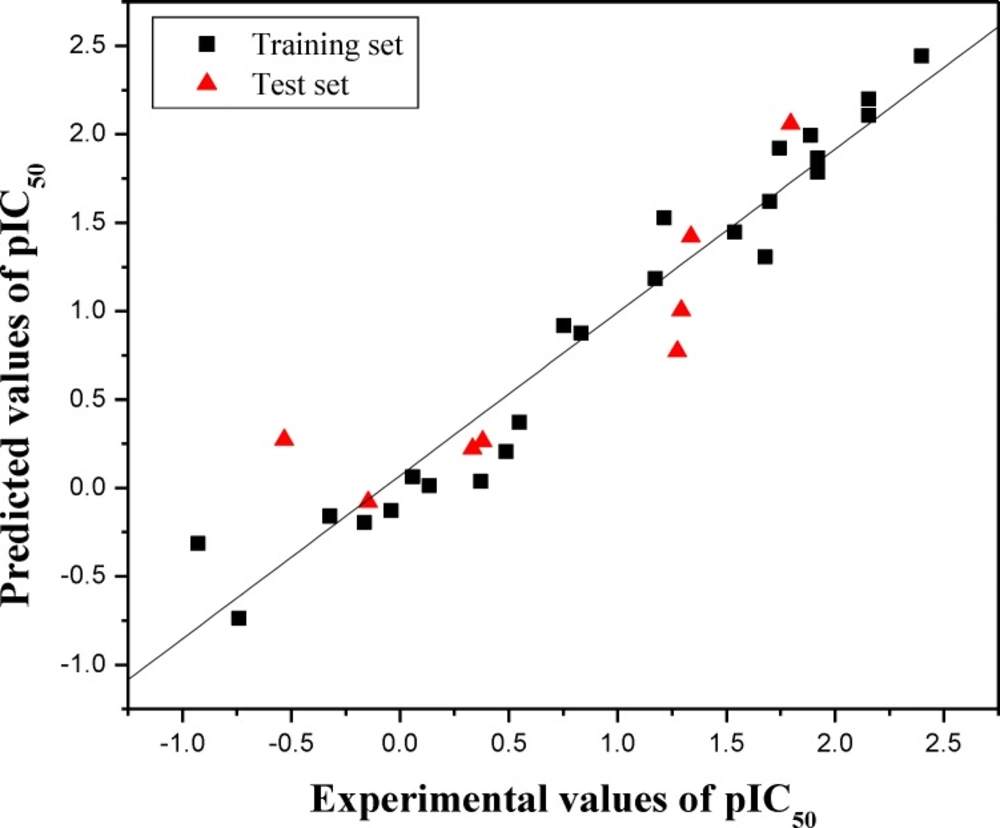
Figure 1
Plot of experimental versus predicted pIC50 values of the training set and test set molecules
The training set and test set molecules are shown in black (squares) and red (triangle)
spots, respectively.
Interpretation of HQSAR contribution map
A significant role of a QSAR model is not only to predict the activities of untested
molecules, but also to throw light on what molecular fragments play key roles to the
contribution of biological activity. The results of the HQSAR analysis is graphically
displayed as a color-coded structure diagram in which the color of each atom reflects the
contribution of that atom to the molecule’s overall activity. The colors at the red end of
the spectrum (red and orange) represent poor contributions, while colors at the green end
(yellow, blue and green) indicate favorable contributions. HQSAR offers a good way of
accounting for the variance of molecular activity by condensing information on the
structural fragment.
Using the best HQSAR model, which factored atoms, bonds, connections; donor and acceptor
into fragment distinction parameters, the atomic contribution maps of 24 compounds included
in the training set were generated. The individual atomic contribution maps of the first
single-digit potent nanomolar acid ceramidase inhibitors(compound 32, 30 and 21)as well as
the least potent AC inhibitor (compound 25), resulting from the best HQSAR model, are
displayed in Figure 2. As known to us, the different
substituents with various chemical properties attached to the
2,4-dioxopyrimidine-1-carboxamide scaffold incurred different responses to the inhibition of
AC activity,which is especially embodied at the position N3 and N5 of the uracil ring in
addition to the alkyl side chain at N1 position (23).
First of all, it can be seen obviously from Figure 2
that the individual atomic contribution map of compound 25 is colored white totally because
it serves as the common structure that exists in every studied molecule.
With respect to the impact of R1 substituent on the inhibition of AC, the
fluorine atoms tethered to the position N5 of the uracil ring both in the compound 32 and 21
were colored green and yellow respectively, indicating its positive contribution to
inhibitory activity, which explained well why compounds 1, 16, 28 have higher potency than
compounds 2, 17, 29. Furthermore, the trifluoromethyl group in the same place (compound 30)
was colored heavily green, signifying its highly beneficial contribution to inhibitory
activity, which is a possible reason why compound 30 has higher potency than compound 29. In
consideration of the preeminent role of the fluorine atom and the trifluoromethyl group at
N5 position of the uracil ring, it can be deduced that the introduction of
electron-withdrawing group will play a crucial role in improving the inhibitory activity of
this class of compounds, which was borne in mind in our follow-up molecular design. This
conclusion is also consistent with previous SAR studies, which reinforced the importance of
electron-withdrawing effect in enhancing the AC inhibitory activity (23). On the other hand, in combination with the above-mentioned analysis
about the role of connections (C) and donor and acceptor (DA) in developing the HQSAR model,
we come up with the presumption that the electron-withdrawing group (R1) such as
fluorine atom or trifluoromethyl may act as hydrogen bond acceptor for the inhibitor-enzyme
interaction, as proposed in the discussion about Table1.
As regards the influence of alkyl chain length on the inhibition activity of AC, the carbon
atoms at the tip of the chain in compound 32 and compound 30 were colored yellow or green
while the terminal atoms in compound 21 and compound 25 were colored white, which provided a
hint that compounds bearing eight-carbon alkyl chain exhibits higher AC inhibition activity
than compounds with other alkyl chain length. In other words, eight-carbon alkyl chain
length is superior to other alkyl chain length for improving the AC inhibition activity, as
also evidenced by the higher predicted pIC50 values of the designed molecules (E)
compared with compounds (C and D), which may be the very reason why compound 32 possesses
higher AC inhibition activity than compound 21.
In addition, of particular interest was the green color of the 1-carboxamide NH group in
compound 30, implying its favorable contribution to the AC inhibition activity, which also
shed light on the key role of 1-carboxamide NH moiety essential for the AC inhibition
activity of this class of compounds (23).
Furthermore, what interested us was that the oxygen atoms or carbon-oxygen double bond
located at position 4 of the uracil ring were all colored green in compounds 32, 30, 21.
Although these fragments are a part of the common structure incorporated in all the studied
molecules, they seemed to provide some hints about the key function of a fully conjugated
2,4-dioxopyrimidine-1-carboxamide system, as verified by the computational studies (23). On the other hand, the oxygen atoms may function as
hydrogen bond acceptor for the inhibitor-enzyme interaction, as put forward in the analysis
for Table 1, which is a hypothesis needing to be
confirmed in further investigation.
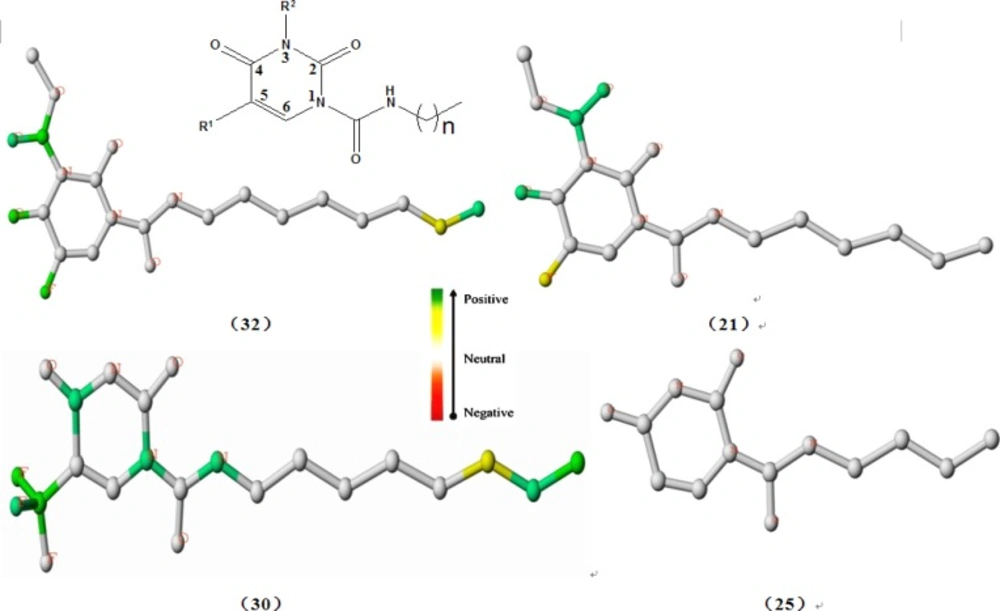
Figure 2
Atomic contribution maps for compounds 32, 30, 21 and compound 25
Designed compounds and predicted activity
In terms of the information derived from these contribution maps together with the analysis
thus made above, we further modified the structure of 2,4-dioxopyrimidine-1-carboxamide acid
ceramidase inhibitors. The structures of new compounds with potentially improved biological
activity were displayed in Figure 3. Taking advantage
of the best holographic QSAR model established above, the activities of the new compounds
thus designed were predicted, as shown in Table 4.
According to the prediction results, the biological activities
(pIC50) of new compounds were all greater than 2.4. These new
compounds are likely to possess higher inhibitory activity, which remains to be
experimentally verified.
Table 4Chemical structures of designed molecules and predicted biological activities
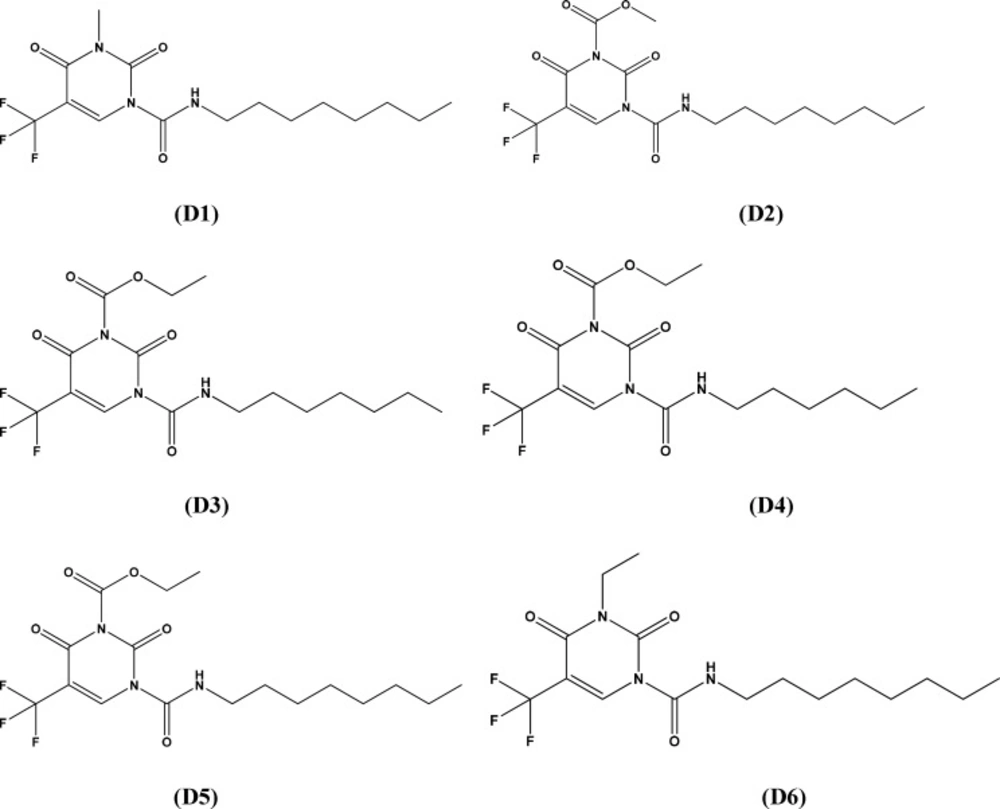
Figure 3
Structures of designed compounds with potentially improved biological activity
Conclusions
In summary, we successfully generated a hologram QSAR model for the
2,4-dioxopyrimidine-1-carboxamides as acid ceramidase inhibitors with good statistical
results. The model (N= 6) displayed significant cross-validated (q2= 0.834) and
non-cross-validated correlation coefficients (r2= 0.965). The strong agreement
between the experimental and predicted values for the test set compounds verified the
reliability and robustness of the constructed HQSAR model, indicating a high external
predictability of model (
