Liposome characterization
The mean diameter, zeta potential and polydispersity index (PDI) of the PEG-NLs were 80.88 ± 0.594 nm (n = 3), -12.5 ± 0.56 mv and 0.158 ± 0.025, respectively. The mean diameter, zeta potential and PDI of the NLs were 94.14 ± 0.114 nm (n = 3), -35.5 ± 0.67 mv and 0.198 ± 0.007, respectively. Both liposomal formulations had almost the same size (
Table 1). The zeta potential of NLs was significantly more negatively charged compared to PEG-NLs due to the presence of negatively charged phospholipid (DSPG) in the formulation of NLs. Both formulations had a monomodal distribution. A low PDI value with a monomodal peak represents a narrow particle size distribution for these liposomes.
| PEG-NLsHSPC, DSPE-PEG2000 and cholesterol with molar ratio of 12.5: 8: 1.2 | NLsHSPC, cholesterol and DSPG with molar ratio of 12.5: 8: 2.1 |
|---|
| Z-Average(nm) | 80.88 ± 0.594 | 94.14 ± 0.114 |
| PDI | 0.158 ± 0.025 | 0.198 ± 0.007 |
| Zeta Potential(mv) | -12.5 ± 0.56 | -35.5 ± 0.67 |
Radiochemical Purity and Stability
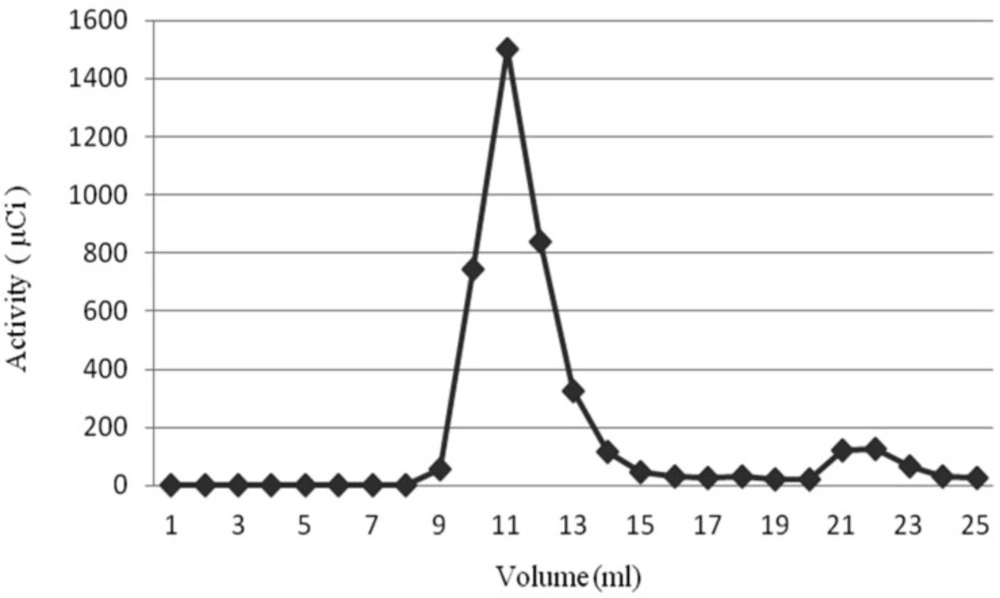
Radiochemical Purity of PEG-NLs and NLs, after liposomes incubation for 30 minutes with 370 MBq
99mTc-HMPAO, was 91.55 ± 1.57% and 93.8 ± 2.43%, respectively. This high Radiochemical purity was obtained by passing the liposomes through Sephadex G25 which separated nano liposomes entrapping
99mTc-HMPAO from free
99mTc-HMPAO (
Figure 1). In order to make sure of the
99mTc-HMPAO stability in the liposome,
in-vitro stability test was performed by exposing the labeled liposome to human serum plasma. As shown in
Table 2, the labeling stability of PEG-NLs obtained by ITLC up to 4 hours was more than 95% and 78% at 24 hours. The labeling stability of NLs was more than 65% at 4 hours and 50% at 24 hours.
Size exclusion chromatography of PEG-NLs labeled with 99mTc-HMPAO on Sephadex G-25. Elution volumes of tube 10-13 belong to 99mTc-HMPAO-PEG-NLs and elution volumes of tube 20-23 belong to lipophilic 99mTc-HMPAO
| Incubation times (hours) | 1 | 2 | 4 | 24 |
|---|
| Labeling stability of 99mTc-PEG-NLs | 96.90 ± 0.64 | 94.34 ± 0.56 | 95.38 ± 0.43 | 78.54 ± 0.34 |
| Labeling stability of 99mTc-NLs | 75.80 ± 0.78 | 71.65 ± 1.3 | 65.72 ± 0.78 | 50.96 ± 1.52 |
Tissue Distribution in Mice
The biodistribution of the radiolabeled liposomes were performed in mice at different time points (n = 3 for each time). As shown in
Table 3,
99mTc-HMPAO-PEG-NLs had a low liver uptake (12.07 ± 3.66 %ID/g, 14.85 ± 1.3, 6.59 %ID/g ± 1.29%ID/g at 1, 4 and 24 h, respectively) and a high blood pool uptake (7.74 ± 1.63 %ID/g, 4.9 ± 0.77 %ID/g, 0.92 ± 0.43%ID/g at 1, 4 and 24 h, respectively). 99mTc-HMPAO-NLs had much higher liver accumulation (36.81 ± 6.56 %ID/g, 26.83 ± 2.49 %ID/g, 20.7 ± 2.79 %ID/g at 1, 4 and 24 h; respectively). The spleen uptake was also elevated for these NLs (28.63 ± 5.62 %ID/g, 48.63 ± 5.36 %ID/g, 63.55 ± 5.89%ID/g at 1, 4 and 24 h; respectively). This high accumulation may be the result of nano-sized PEGylated liposomes (less than 100 nm) which cleared more rapidly from the spleen (
15).
Tissues
|
| 99mTc-PEGNLs (%ID/g)
|
|
| 99mTc-NLs (%ID/g)
|
|---|
| 1 h | 4 h | 24 h | 1 h | 4 h | 24 h |
|---|
| Muscle | 0.39±0.9 | 0.07±0.02 | 0.29±0.09 | 0.36±0.25 | 0.14±0.2 | 0.42±0.12 |
| Intestine | 0.24±0.11 | 0.2±0.17 | 0.46±0.05 | 0.38±0.11 | 0.17±0.04 | 0.28±0.04 |
| Heart | 0.62±0.3 | 0.31±0.11 | 0.32±0.39 | 0.91±0.32 | 0.27±0.13 | 0.44±0.6 |
| Lungs | 0.66±0.5 | 0.48±0.13 | 0.89±0.03 | 1.03±0.47 | 0.55±0.1 | 0.39±0.02 |
| Blood | 7.74±1.63* | 4.9±0.77* | 0.92±0.43* | 15.06±2.12* | 7.57±1.08* | 0.38±0.01* |
| Spleen | 37.99±2.92* | 29.85±1.01* | 14.89±4.03* | 28.63±5.6* | 48.63±5.36* | 63.55±5.89* |
| Kidneys | 0.83±0.35 | 0.64±0.14 | 1.08±0.25 | 1.49±1.03 | 1.02±0.05 | 0.79±0.11 |
| Liver | 12.07±3.66 | 14.85±1.3 | 6.59±1.29* | 36.81±6.56 | 26.83±2.49 | 20.7±2.79 |
| Stomah | 0.23±0.5 | 0.19±0.04 | 0.4±0.24 | 0.22±0.3 | 0.13±0.09 | 0.35±0.13 |
| bone | 0.25±0.2 | 0.07±0.04 | 0.56±0.38 | 0.2±0.17 | 0.11±0.03 | 0.23±0.01 |
| Tail | 0.1±0.06 | 0.43±0.06 | 3.19±1.72 | 0.29±0.1 | 4.14±2.6 | 4.7±3.27 |
| thyroid | 0.92±0.5 | 0.24±0.2 | 0.96±0.64 | 1.13±1.07 | 0.53±0.16 | 0.89±0.76 |
Significant (p value < 0.05)
Scintigraphic Studies in Rabbit
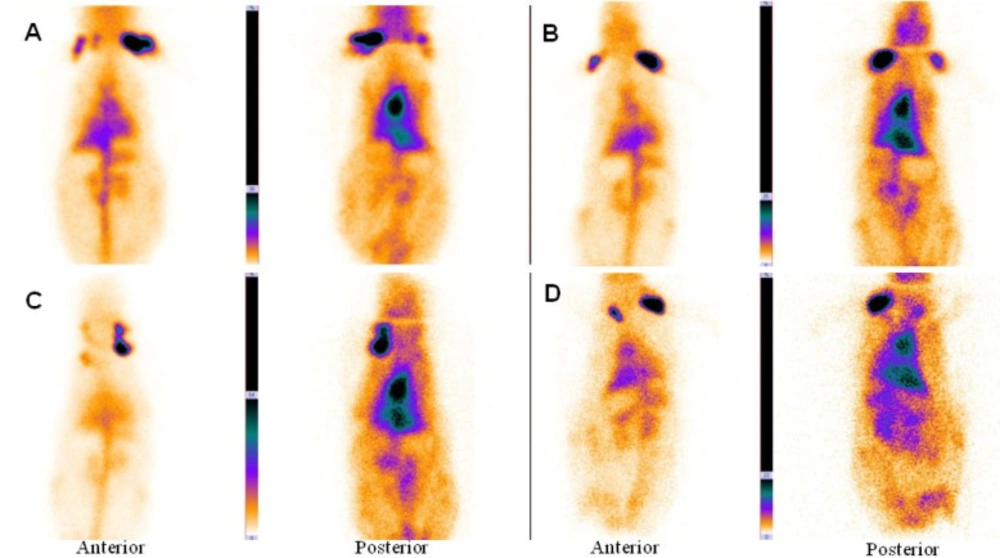
The main vessels (Aorta), heart and liver was clearly seen in the anterior and posterior images of rabbit.
Figure 2A, B shows planar imaging of rabbit in the early times (immediately and 1 h) after
99mTc-HMPAO-PEG-NLs injection.
Anterior and posterior images of rabbit immediately (A), 1 h (B), 2 h (C) and 24 h (D) after injection of 99mTc-HMPAO-PEG-NLs (34-74 kBq, 1-2 mCi in 0.5 ml). Planar images were acquired using a 256 × 256 matrix for a total of 300,000 counts with a zoom factor of 2. The main vessels (Aorta), heart and liver was clearly seen in the anterior and posterior images of rabbit for 24 h.
In the delayed images obtained 2 and 24 hours later (
Figure 2C, D), heart and liver had high radiotracer activity. This is a proof to prolong circulation profile of
99mTc-HMPAO-PEG-NLs in the blood stream. In the delayed images, there was no uptake in the kidneys and bladder wall which is important in the diagnosis of lower gastrointestinal bleeding. Scintigraphy images obtained with
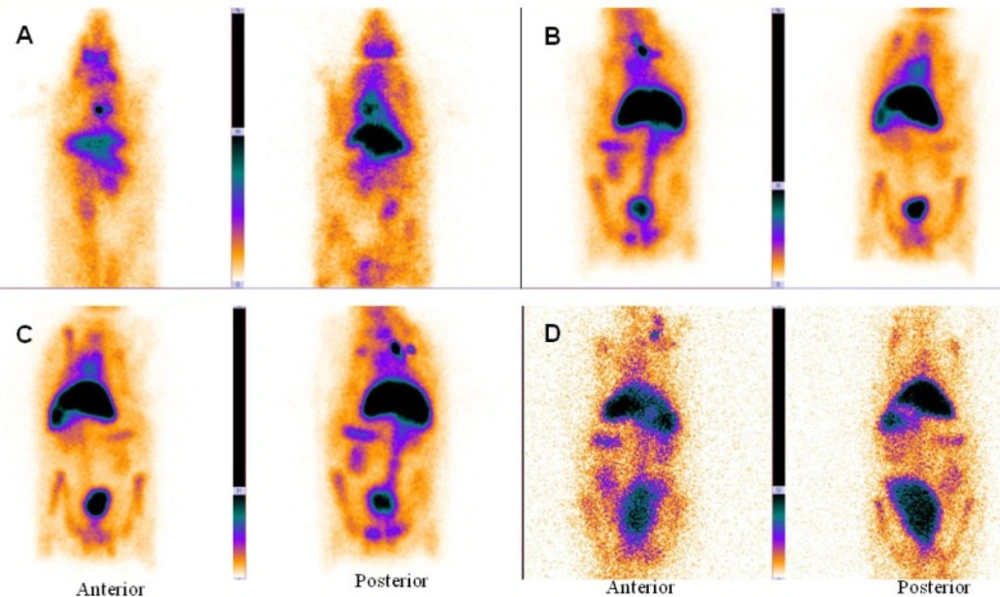
99mTc-HMPAO-NLs (
Figure 3) showed a high liver uptake and low heart accumulation. Although these liposomes had a high blood pool circulation time, but their
in-vivo stability was too low to be useful for
in-vivo studies which is in agreement with
in-vitro stability test (
Table 2).
Anterior and posterior images of rabbit immediately (A), 1 h (B), 2 h (C) and 24 h (D) after injection of 99mTc-HMPAO-NLs (34-74 kBq, 1-2 mCi in 0.5 ml). Planar images were acquired using a 256 × 256 matrix for a total of 300,000 counts with a zoom factor of 2. 99mTc-HMPAO-NLs showed a high liver uptake and low heart accumulation
Total count and geometric mean count per pixel was calculated at 0, 2 and 24 h post injection for 99mTc-HMPAO-PEG-NLs. Heart to liver, heart to spleen and heart to background ROIs were 1.25, 4 and 4.28 immediately, 1.12, 4.33 and 3.25 at 2 hours, and 1.06, 1.75 and 2.51 at 24 hours post injection, respectively.
The main aim of this study was to prepare an effective nano sized liposome similar to human red blood cell (RBC) for blood pool scintigraphy. By optimizing the liposomes characteristics such as vesicle size, lipid formulation and hydrophilicity of liposome surface (
7), we prepared an effective formulation of nano sized PEG-NLs and non-PEG NLs which were homogeneous in size (PDI less than 0.2) and similar to RBC in having prolonged circulation time for diagnostic purpose. Both formulations were negatively charged that prevents their aggregation during the storage.
Since liposomes used in this study are composed of natural biomolecules (HSPC, cholesterol, DSPE-mPEG 2000 and DSPG), they are biodegradable and essentially non-toxic. HSPC, cholesterol, DSPE-mPEG 2000 and DSPG are applied in the formulation of the available commercial liposomal formulations (e.g. AmBisome
TM and Doxil
TM) with a very good safety profile (
16-
17).
In this study, PEG-NLs incorporated with 5.5 mol% DSPE-mPEG 2000 have a mean diameter of 80.88 ± 0.594 nm. In mice tissue distribution study, blood pool circulation was very high 7.74 ± 1.63 %ID/g at 1 h and 4.9 ± 0.77 %ID/g at 4 h (
p < 0.05) (
Table 3). Compared to human Red blood Cell labeled with
99mTc (
4), there was no significant activity in thyroid or stomach showing the
in-vivo stability of
99mTc-HMPAO-PEG-NLs. The high labeling efficiency guarantee a high target to background ratio and optimal image quality which have an effect on scan interpretation (
Figure 2,
4). This result was in harmony with the
in-vitro stability test in human serum albumin (
Table 2).
99mTc-HMPAO-NLs prepared in this study had a high blood pool circulation in mice 15.06±2.12 %ID/g at 1 h and 7.57±1.08 %ID/g at 4 h (
p < 0.05) (
Table 3). Although NLs had a high blood pool activity, but their elevated accumulation in liver and spleen underestimate their clinical usage as a blood pool imaging agent (
Figure 3).
Scintigraphy images obtained in rabbits approved the long blood pool circulation time of
99mTc-HMPAO-PEG-NLs (
17). Heart-to-liver and heart-to-spleen and heart-to-background ratios were determined from region of interest (ROI) analysis of zoomed static images. The ROI values for heart to liver were steady (1.25, 1.12 and 1.06 at 0, 2 and 24 h post injection, respectively) which shows high PEG-NLs uptake in the heart to 24 h. For cardiac functional studies, the relationship of the distribution of the agent in the heart compared to the liver activity is the most important factor. In the early planar images (
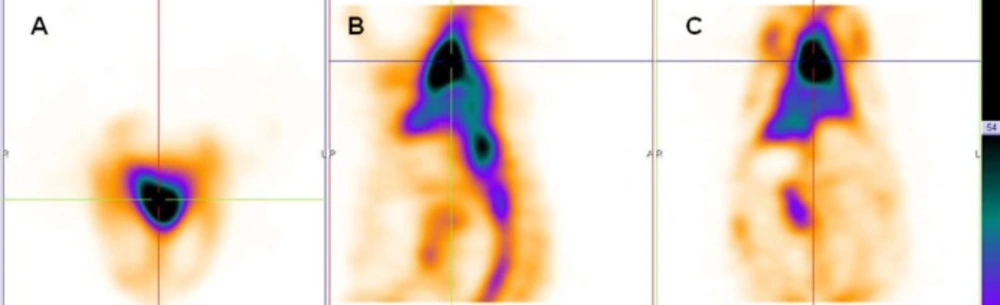
Figure 2A) and SPECT images obtained 15 minutes after labeled PEG-NLs administration to the rabbit (
Figure 4), high heart activity is an evident for the increased residence of labeled liposome in the blood pool. Low liver uptake during this time also helps in better heart visulaization. Although NLs had a long circulation time in blood, but their high accumulation in the liver overlap the heart visualization(
2) (
Figure 3,
5).
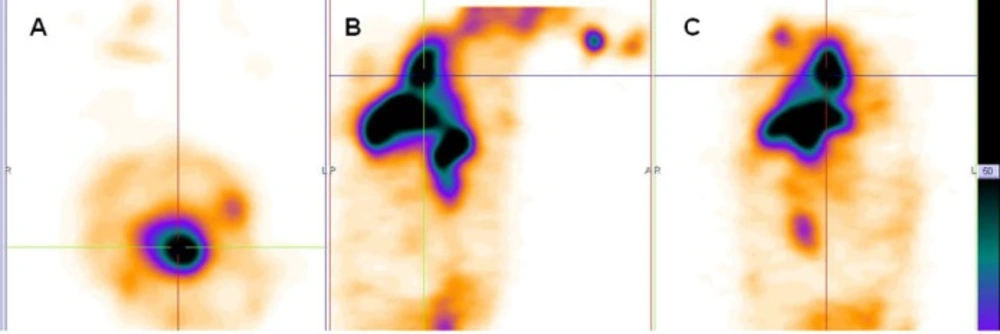
SPECT images of rabbit (A. transverse B. sagittal C. coronal) were obtained 15 minutes after injection of 99mTc-HMPAO-PEG-NLs (64 slices, 30 second/projection).
SPECT images of rabbit (A. transverse B. sagittal C. coronal) were obtained 15 minutes after injection of 99mTc-HMPAO-NLs (64 slices, 30 second/projection).
In the delayed images obtained with
99mTc-HMPAO PEG-NLs (
Figure 2D , 24 h later), there was also some uptake in the abdominal region that demonstrates the labeled liposome metabolism by liver. In all the early and delayed images (
Figure 2), there was no evidence of kidney uptake. Goins,
et al.(
2) studies also demonstrate lower kidney activity following PEGylated liposome injection compared to both in-vitro and in-vivo
99mTc red blood cells labeling. This mild kidney uptake in delayed scintigraphy is so essential in detection of lower gastrointestinal bleeding region which needs delayed imaging. In addition, PEG-NLs labeled with
99mTc-HMPAO are unlikely to be affected by administered medications to the patient that can interfere with the labeling and stability of
99mTc-RBC (
18).
In early and delayed images obtained with
99mTc-HMPAO-NLs (
Figure 3), there was an increased bladder activity over time. This is due to the instable NLs and the leakage of
99mTc-HMAPO from the liposomes and its excretion through kidney and bladder (
7). These results show us the priority of PEG-NL over non-PEG NLs for GI bleeding scintigraphy due to their excellent
in-vivo stability (
Table 2). The lack of dissociation of the
99mTc from PEG-NLs results in better understanding of cardiac functionality and counting statistics for cardiac studies.