Chemicals
Tetraethoxypropane (MDA), 2-thiobarbituric acid (TBA), trichloroace tic acid (TCA), n-butanol, propofol , sucrose, ethylenediamine tetra acetic acid (EDTA), Comassie blue, bovine serum album in (BSA), 4,5(dimethylthiazol-2-yl)-2,5-diphenyltetrazolium bromide (MTT), GPx and SOD (Ransel kit, Randox Laboratories Ltd, Crumlin, UK), bioxytech GSH kit (Oxis Research, USA), Comassie blue, bovine serum albumin (BSA), 4,5-(dimethylthiazol-2-yl)-2,5-diphenyltetrazolium bromide (MTT), were used in this study. All other chemicals were obtained from the Sigma.
Animals and treatments
Adult male Wistar rats weighing 180–250 g maintained on a 12-hour light/dark cycle with free access to tap water and standard laboratory chow were used. Animals were randomly divided into six groups (n=5) and treated for 2 week intraperitoneally (IP). The groups were as follows: control group, propofol group, CCl4 group, propofol and CCl4 group, vitamin E group, and CCl4 and vitamin E group.
Propofol was administered (10 mg/Kg/day, IP) alone or in combination with CCl4 (0.2 mL/Kg /day, IP) and vitamin E as (15 mg/Kg/day, SC) One group of animals received only normal saline and was assigned as control. At the end of the treatment, 24 hours post the last dose of treatment, animals were killed, liver tissue was separated and stored in liquid nitrogen. Blood samples were collected from heart in heparinized tubes and plasma was isolated. The experiments were conducted according to the ethical rules approved by Institutional Review Board (IRB).
Preparation of liver mitochondria
The liver was removed and minced with small scissors in a cold manitol solution containing 0.225 M D-manitol, 75 mM sucrose, and 0.2 mM ethylenediaminetetraacetic acid (EDTA). The minced liver (30 g) was gently homogenized in a glass homogenizer with a Teflon pestle and then centrifuged at 700 × g for 10 min at 4 ◦C at remove nuclei, unbroken cells, and other non-subcellular tissue. The supernatants were centrifuged at 7,000 × g for 20 min. These second supernatants were pooled as the crude microsomal fraction and the pale loose upper layer, which was rich in swollen or broken mitochondria, lysosomes, and some microsomes, of sediments was washed away.
The dark packed lower layer (heavy mitochondrial fraction) was resuspended in the manitol solution and recentrifuged twice at 7,000×
g for 20 min. The heavy mitochondrial sediments were suspended in Tris solution containing 0.05 M Tris-HCl buffer (pH 7.4), 0.25 M sucrose, 20 mM KCl, 2.0 mM MgCl
2, and 1.0 mM Na
2HPO
4 at 4
◦C before assay (
16).
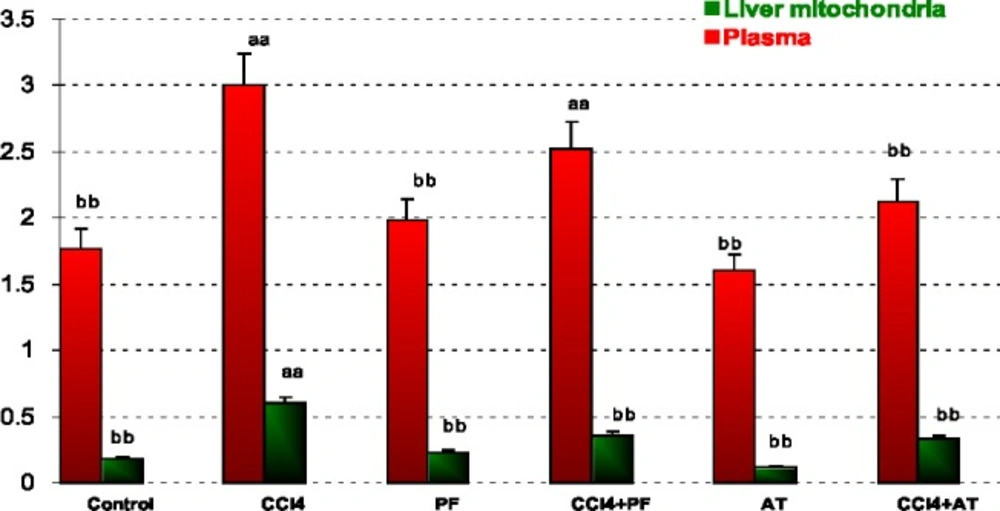
Measurement of Cu/Zn- SOD
The activity of Cu/Zn- SOD was measured using a commercial kit (Ransod kit, Randox Laboratories Ltd, Crumlin, UK). Measurement of the enzyme was based on the generation of superoxide radicals produced by xanthine and xanthine oxidase and reacted with 2-(4-iodophenyl)-3-(4-nitrofenol) 5-phenyltetrazolium chloride (INT) to form a red formazan dye. The formazan was read at 505 nm. One unit of Cu/Zn- SOD was defined as the amount of enzyme necessary to produce 50% inhibition in the INT reduction rate.
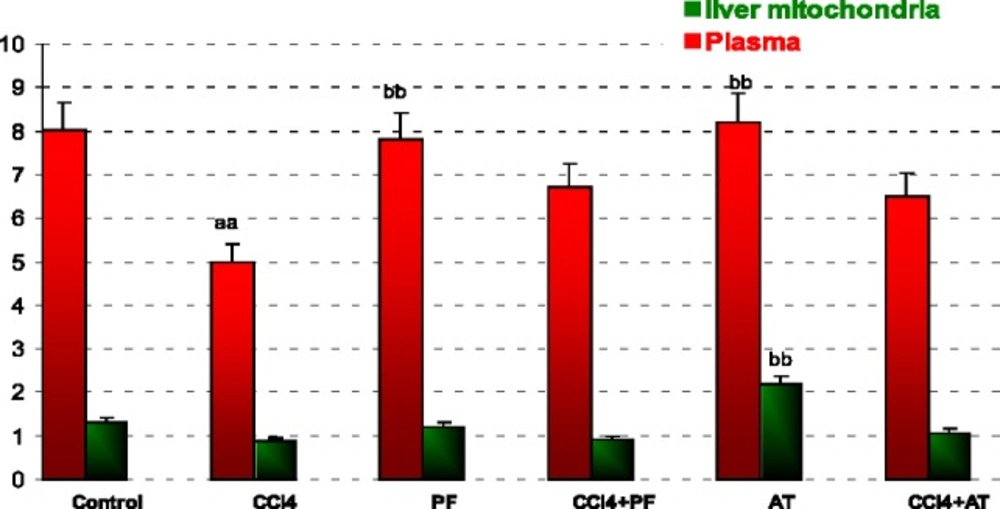
Measurement of GPx
The amount of GPx was determined using a commercially available kit (Ransel kit, Randox Laboratories Ltd, Crumlin, UK) by measuring the rate of oxidation of NADPH at 340 nm. A unit of enzyme was expressed as the amount of enzyme needed to oxidize 1 nmol of NADPH oxidase/minute.
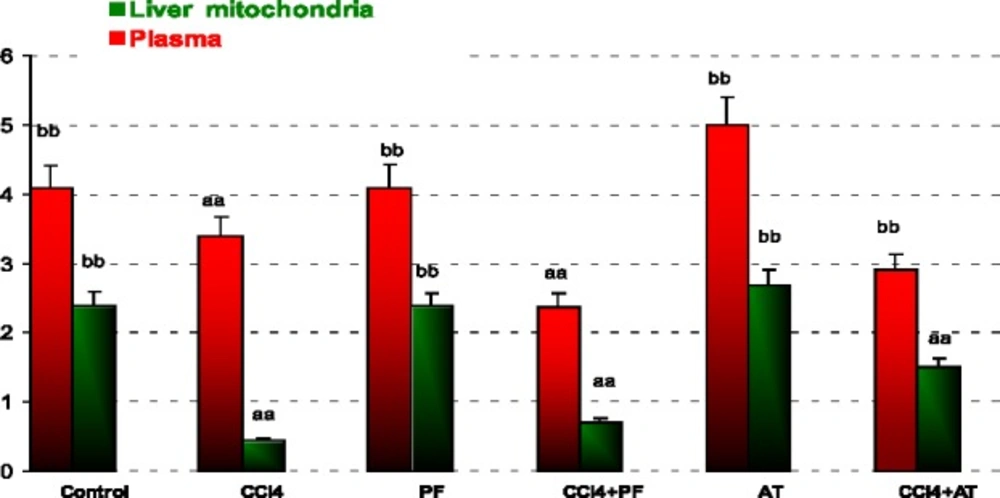
Measurement of reduced glutathione assay (GSH)
Level of reduced glutathione (GSH) was measured using colorimetric assay kit. The kit uses 5, 50-dithiobis-2-nitrobenzoic acid (DTNB) and glutathione reductase. The procedure was followed according to manufacturer’s instruction and the levels were quantitated as micromolar GSH based on standard supplied along with the kit.
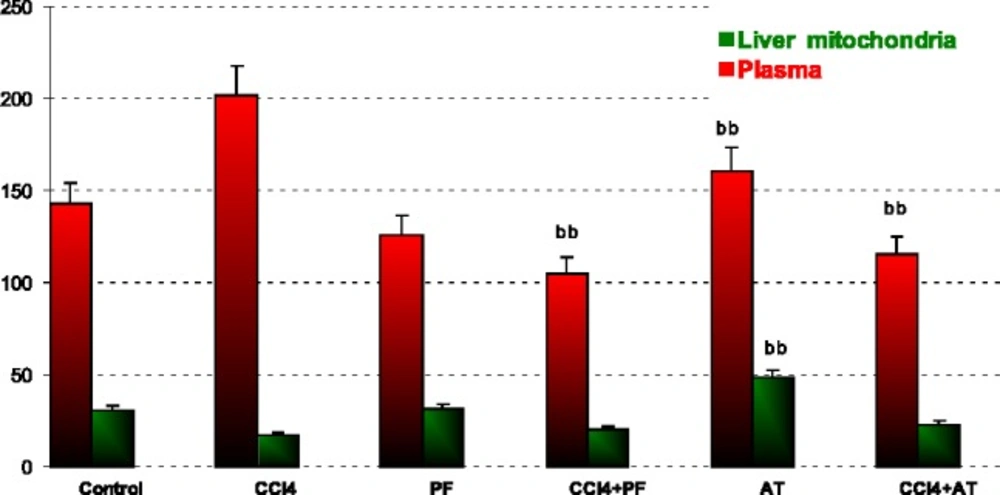
Measurement of lipid peroxidation (LPO)
The LPO product in tissues was determined by thiobarbituric acid reagent expressed as the extent of malondialdehyde (MDA) productions during an acid heating reaction. Briefly, the samples were diluted by 1.5 mL TCA (20% w/v) was added to 250 μL o f this samples and centrifuged in 3000 g for 10 min. Then, the precipitation was dissolved in sulfuric acid and 1.5 mL of the mixture was added to 1.5 mL of TBA (0.2% w/v). The mixture was then incubated for 1 h in a boiling water bath. Following incubation, 2 m l of n-butanol was added, the solution centrifuged, cooled and the absorption of the supernatant was recorded in 532 nm. The calibration curve of tetraethoxypropane standard solutions was used to determine the concentrations of TBA+MDA adducts in samples (
17).
Total Protein
The protein content was quantified by the method of Bradford. Concentrated Coomassie blue (G250) was diluted in 250 μL distilled water, and then 750 μL of this diluted dye was added to 50 μL of sample. The mixture was incubated at room temperature for 10 min and an absorbance measurement was taken at 595 nm by a spectrophotometer. A standard curve was constructed by using bovine serum albumin ranging between 0.25 and 1 mg/mL (
18).
Mitochondrial viability
This assay is a quantitative colorimetric method to determine mitochondrial toxicity or viability of liver mitochondria. It utilizes the yellow tetrazolium salt (MTT), which is metabolized by mitochondrial dehydrogenase enzyme from viable cells to yield a purple formazan reaction product that was determined spectrophotometrically at wavelength of 570 nm. The percentage (of control) of mitochondrial viability of each test sample was calculated (
19).
Statistical analysis
Mean and standard error values were determined for all the parameters and the results were expressed as Mean + SEM. All data were analyzed with SPSS Version 18 employing one-way ANOVA followed by Tukey post hoc test. Duplicate of experiments were performed. Differences between groups was considered significant when P < 0.05.