Preparation of SS gel
SS was obtained from the Pharmacology Department of Shiraz University of Medical Sciences, Shiraz, Iran. In order to facilitate its application, we prepared 2% SS gel by dissolving 2 g SS in 2 cc ethanol (70%), and then transferring the solution into 2% carboxymethylcellulose (CMC) (2 g CMC dissolved in 98 cc distilled water). The base of gel was also supplied by the same method but without SS component.
Animals and Excision of wound model
In an experimental study, 36 male Sprague-Dawley rats (220 ± 20 g) of 2-3 months of age were chosen. General anesthesia was induced by intramuscular injection of mixture of Ketamine (Alfasan™, Woerden, Holland; 0.04 mL/100 g body weight) and Xylazine (Alfasan™, Woerden, Holland; 0.02 mL/10 g body weight). A 1 cm2 circular full-thickness wound was created on the posterior surface of animal’s neck. The rats were randomly divided into three groups. One group was treated with vehicle gel (Base group), a group treated with SS gel (SS group), and the untreated wounded group (UW group) that received no-treatment except cleaning of the wound surface with normal saline every day. After 12 days, the animals were euthanized with ether overdose and full thickness skin biopsies (1 cm×1 cm) were taken from the wound site and were fixed in buffered formaldehyde (pH = 7.2) for histopathological and stereological evaluations.
The study protocol was approved by the Animal Ethics Committee of Shiraz University of Medical Sciences and the animal care was in accordance with their guidelines.
Histopathological study
All the specimens were fixed in formalin, paraffin blocks were provided from the specimens, and 15 µm slides were created from the skins and stained with Hematoxylin-Eosin. All the slides were inspected by a pathologist who was unaware of the groups. Scoring was done for acute and chronic inflammation, ulceration, granulation tissue formation and re-epithelization as presented in
Table 1.
Score
| Criterion |
|---|
| Chronic; Dominancy of chronic inflammatory cells in the field | Acute; Dominancy of neutrophils among all cells in the field | Inflammation |
| Present(1) | Absent(0) | Ulceration |
| Present(1) | Absent(0) | Granulation tissue |
| Full, covering 100%of the wound(3) | Moderate; covering > 50% of the wound(2) | Slight; covering < 50% of the wound(1) | Absent(0) | Epithelization |
Wound closure analysis
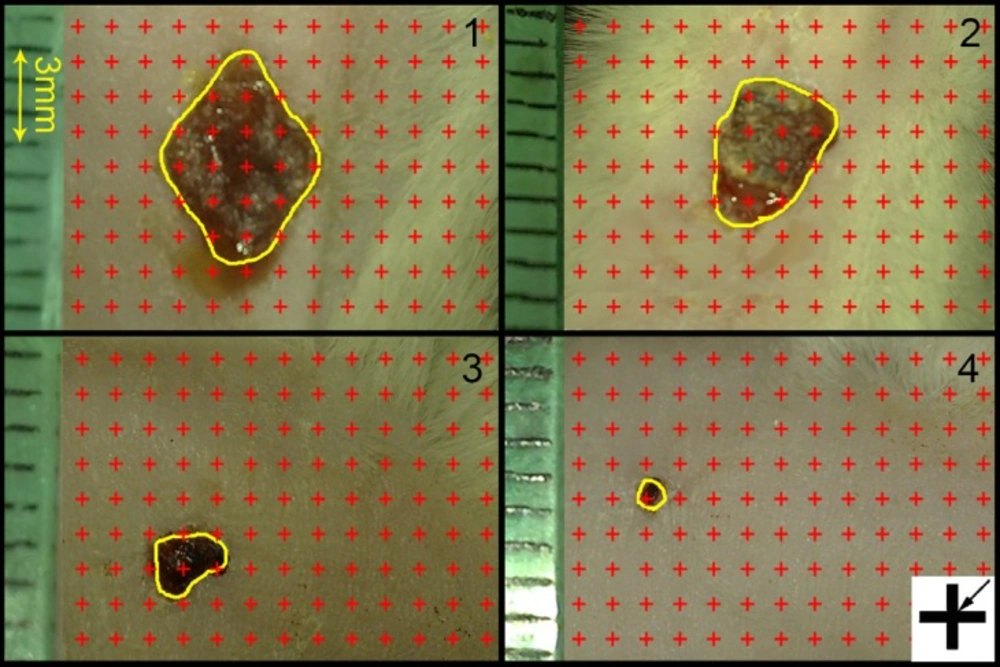
To determine the wound closure rate, images were captured from the wound surfaces every four days with a digital camera. To calibrate the magnification, a standard ruler was set at the level of the wound in each photograph, and the wound area at each visit was estimated by using a stereology software composed of a point grid (
Figure 1) and by using the following formula: Area = ∑ P× a/p; where ∑P was the total points laid on the wound area and a/p, the area surrounded by every four crosses, was considered as the area per point (mm
2) (
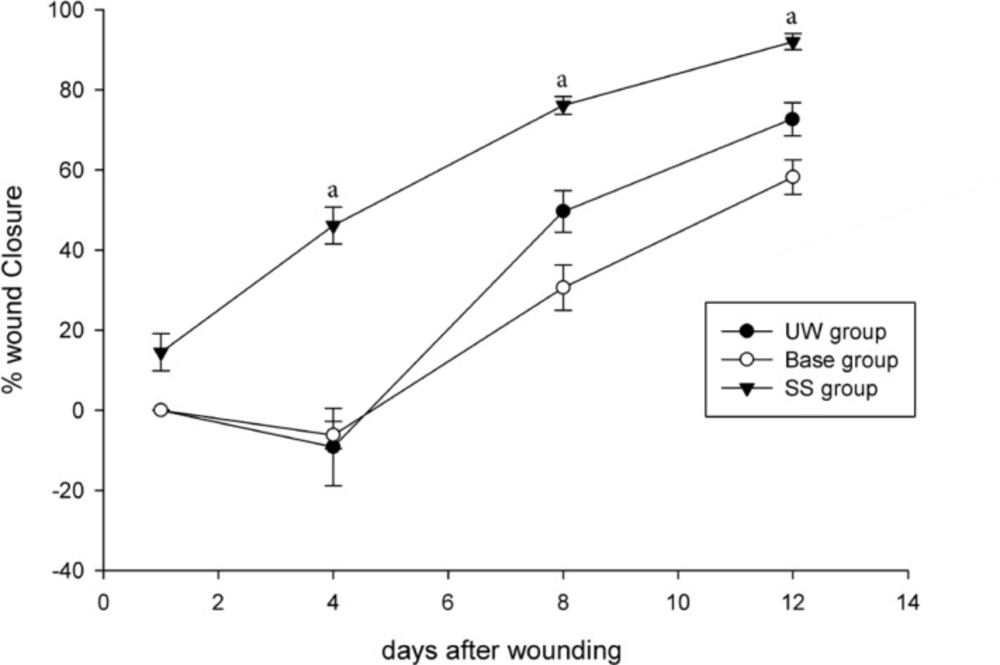
8). Thereafter, the wound closure rate was calculated as:
Wound closure rate (%) = ((area at visit 1 – area at each visit) / area at visit 1) ×100
Digital photographs were captured from the wound surfaces every four days to measure the wound area. The total number of points within the wound borders (yellow line) was counted. As it is shown at the corner of this Figure, the right upper corner of the cross is considered as the point (arrow), and it is counted only if the right upper corner hits the wound surface. (1): day 1, (2): day 4; (3) day 8; (4) day 12 of Simvastatin-treated group
Tissue preparing and processing
In a systematic random sampling manner (first with a random starting place and others with equal distances), nine pieces of the skin samples were cut and prepared for stereological analysis, each about 1 mm
2. The pieces were embedded in a cylindrical paraffin block. The cylindrical blocks were sectioned using orientator methods for generating isotropic uniform random sections (
9). The sections with 5 µm and 15 μm thickness were obtained and stained with both Hedenhain's azan and hematoxylin and eosin stains. Microscopic analyses of the dermis were done by using a video-microscopy system made up of a microscope (E-200, Nikon™, Japan) linked to a video camera, and a flat monitor.
Stereological analysis
The volume densities of the collagen bundles (Vv; fraction of the unite volume of the dermis which is occupied by the collagen bundles) were estimated at final magnification of «×450» by using point counting method and the following formula (
10,
11):
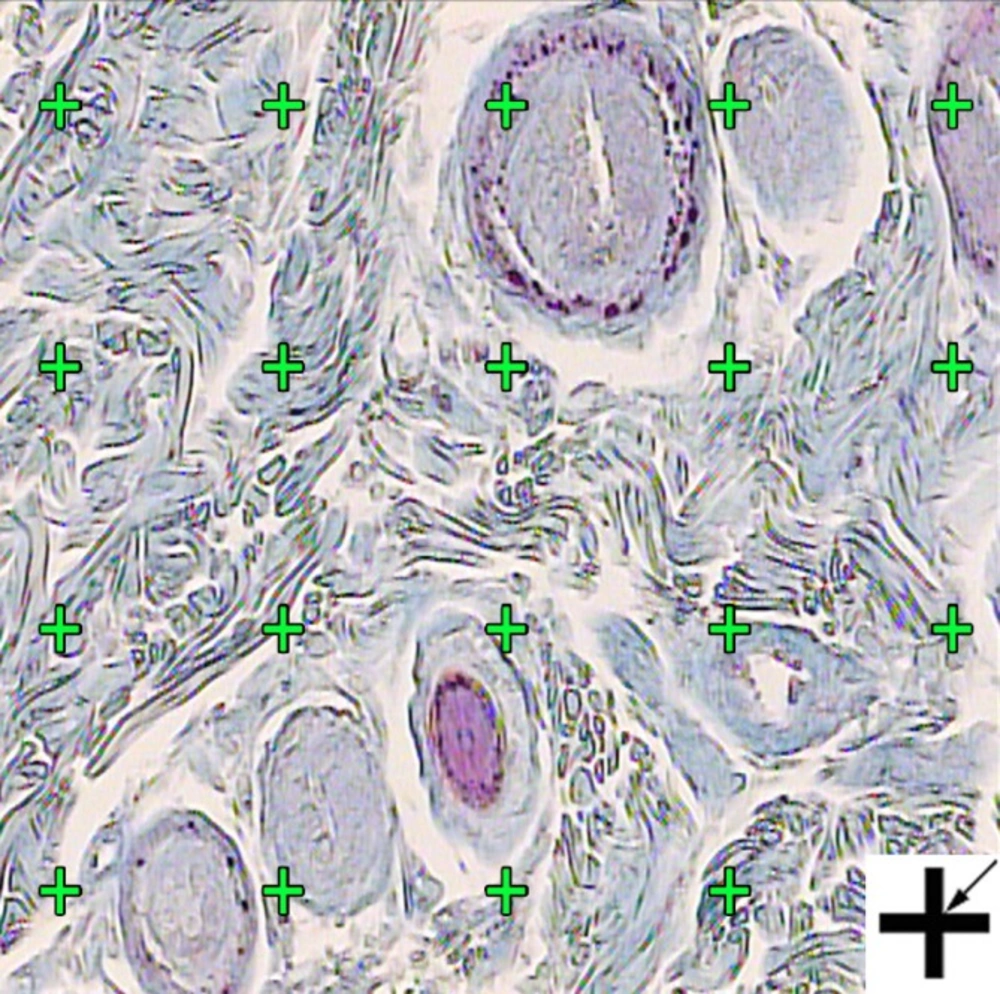
Vv (collagen/dermis) = P (collagen)/P (dermis)
The P
(collagen) was the number of points hitting the profiles of the collagen and P
(dermis) was the number of points hitting the dermis (
Figure 2).
The length density of the vessels (Lv) and their mean diameter were estimated at final magnification of «×450» and by using the following formula (
10,
11):
Lv = 2×ΣQ/ ((a/f) ×Σf)
The volume density (Vv (collagen/dermis)) of the collagen fibers was estimated using a grid of points on the live image of dermis. The total number of points hitting the bundles is counted and divided by the total number of points hitting the reference space (dermis). A cross is presented at the corner of this figure. The cross is counted only if the right upper corner (arrow) hits the tissue. (Hedenhain's azan stain) (×450).
Where "∑
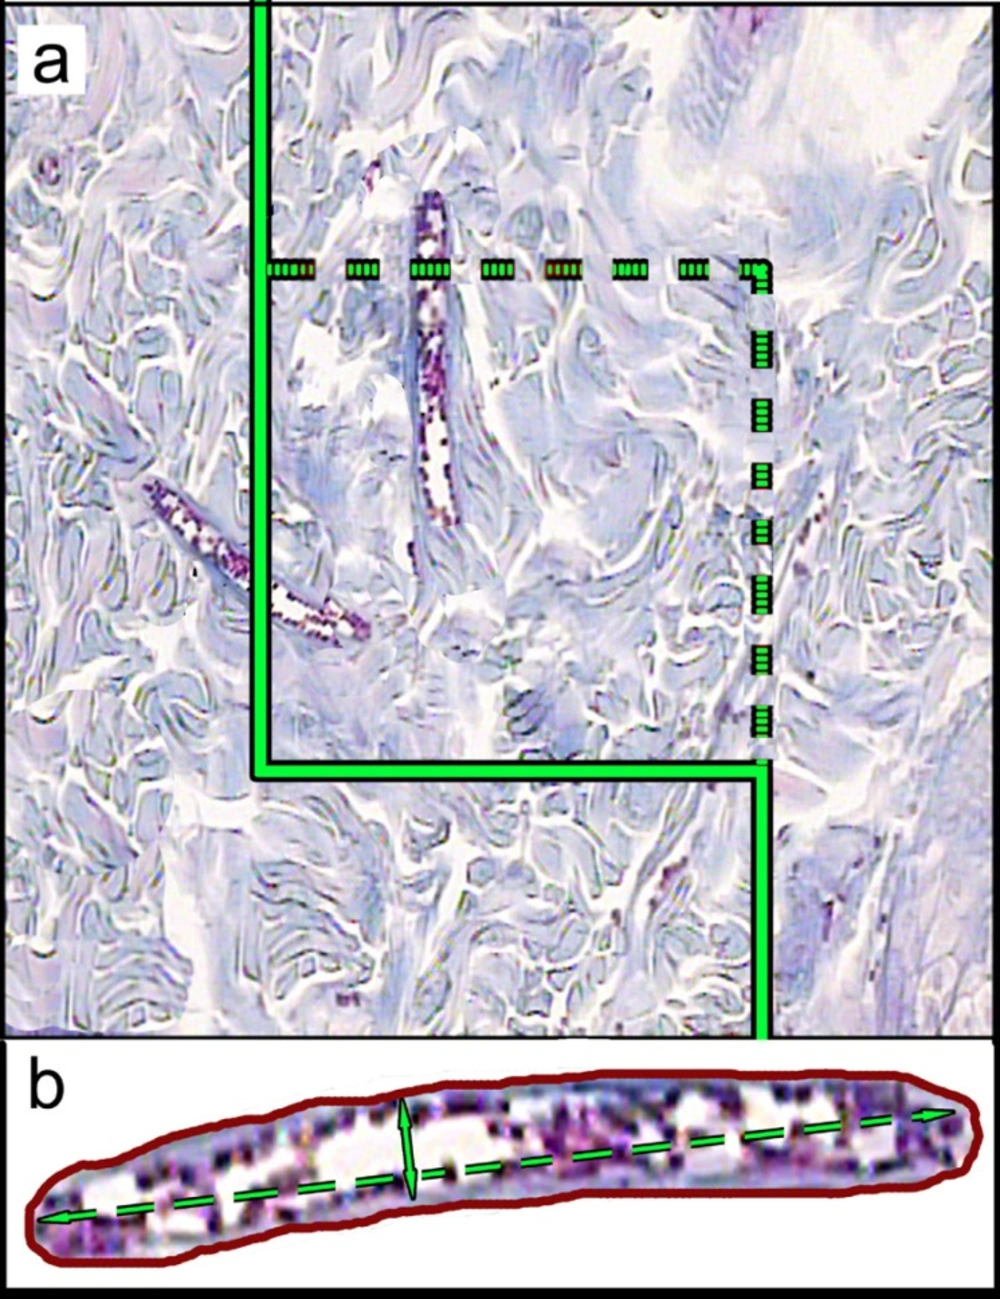
Q" was the total number of vessel profiles counted per rat sample, (a/f) was the area of the counting frame, and "∑f" is the total number of frames counted per animal. Mean diameters of the vessels were calculated by measuring the short axis of a sampled vessel as its diameter (
Figure 3). For these purposes, 5 µm sections were employed.
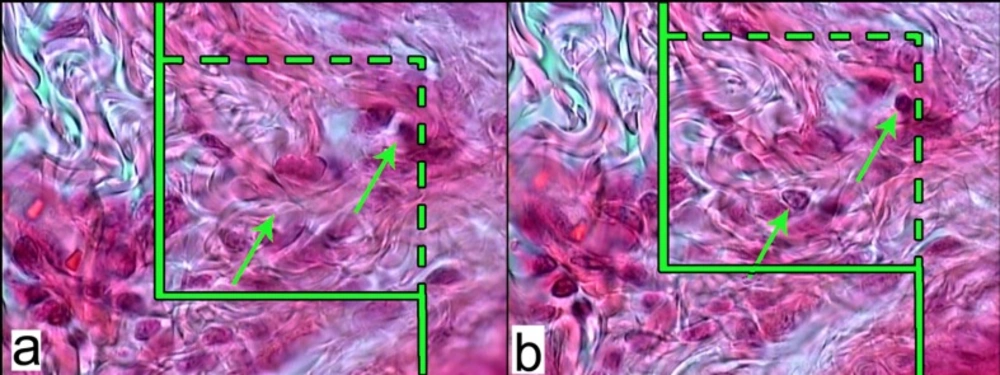
The numerical density (Nv; number of the cells per unit volume of the dermis) of the fibroblasts was estimated by employing 15 μm sections at magnification of ×2000 (
Figure 4), the “optical disector” method and the following formula (
10,
11):
Nv = ΣQ/ΣA× h
Where "ΣQ" was the number of nuclei coming into focus in the dissector height, "ΣA" was the total area of the unbiased counting frame in all microscopic fields and "h" was the height of disector (5 μm here).
A: An unbiased counting frame is laid on the monitor image of wound dermis at final magnification of 450 randomly for estimation of the vessel’s length density (LV) and mean diameter. Any vessel lied in the counting frame or touched the inclusion borders (dotted lines) are selected. The vessels touched the exclusion borders (bold continuous lines), are omitted. B: Mean diameter of the vessel is estimated by measuring the short axis of the vessel (short double arrow). (Hedenhain’s azan stain
a: An unbiased counting frame laid on the image of the sections to estimate the numerical density (NV) of the fibroblasts. The nucleuses are unclear at the first 5 µm optical section (height of disector). b: As above, any nucleus lied in the counting frame or touched the inclusion borders (green dotted lines) and did not touch the exclusion borders (continuous green lines) and come into maximal focus within the next traveling 5 µm optical section (height of disector) are counted (the two green arrows). (Hedenhain’s azan stain ×2000).
Statistical analysis of the data
Data were collected, analyzed and reported as mean and standard deviation (mean ± SD). Statistical comparisons between stereological outcomes of groups were carried out by using SPSS software (ver. 16.0, Chicago, IL, USA). One-way analysis of variance (ANOVA) followed by Tukey’s post test were used to analyze the data. P ≤ 0.05 was considered as statistically significant.