General
Column and flash column chromatography were performed on Merck silica gel (70-230 and 230-400 mesh, respectively). Analytical TLC experiments were performed on Merck silica gel 60 F254. Preparative TLC was performed on Merck silica gel 60F254 self-prepared on glass plates. Folin-Ciocalteau reagent, BF3 solution, cholesterol, nutrient broth and oleic acid were from Merck, DPPH from Fluka, quercetin and chloramphenicol were from Sigma-Aldrich. Sabouraud dextrose (SBD) agar and nutrient agar were from Liofilchem and fluid SBD and the paper discs were from Himedia laboratories.
Algal material, extraction and purification of compounds
The algae were collected from Qeshm Island coastal area and identified by one of us, JS (7). After grinding, 250 g of the dried
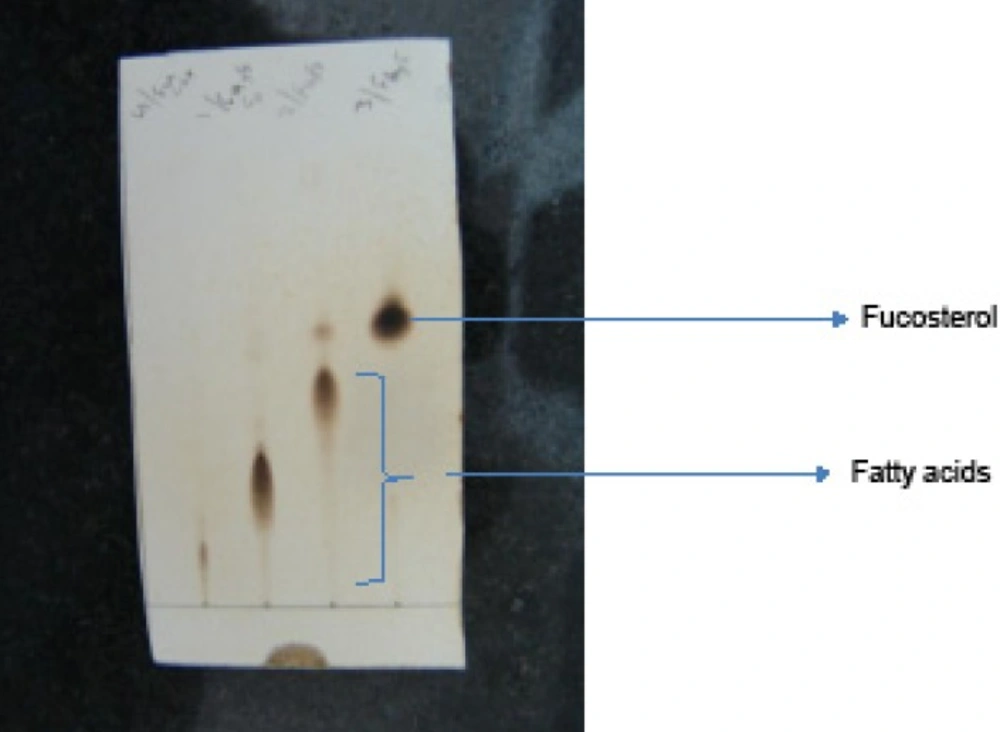
C. myrica were extracted using 1 L dichloromethane (DCM) for 48 h at room temperature. The DCM extract was evaporated under reduced pressure to yield 3.3 g dry syrup which was subjected to column chromatography over a silica gel column (100 g, Merck, 70-230 mesh). The column was eluted with pure hexane and then the polarity of the mobile phase was increased with DCM followed by methanol. The similar fractions eluted with a mixture of DCM and hexane (rich in DCM) were combined (0.8 g) and then subjected to flash column chromatography over silica gel column using different ratios of hexane and chloroform as the mobile phase. Three fatty acids (their structures were not determined due to low concentrations) and fucosterol (9 mg) were purified by flash column chromatography and preparative TLC on AgNO
3 impregnated silica gel (5% w/w) using chloroform or 5 percent acetone in chloroform as the mobile phases (
Figure S.1).
The fractions collected from flash column chromatography on Ag-Silica gel column and further purified by AgNO3 impregnated silica gel TLCs. The compounds corresponding to fatty acids were either degraded before GC-MS analyses or not sufficient to record the mass spectra
Determination of the free radical scavenging activity of the algal extracts by spectrophotometeric methods
The free radical scavenging activity of the algal extracts was measured by the method of Blois (
11) with some modifications (
12,
13) and compared to that for quercetin as a standard radical scavenger. Because of solubility problems, 2 mL of a 100 μM solution of DPPH in methanol were added to 100-400 μL water algal extracts (100 mg algae was extracted in 1 mL water for 24 h) and then the final volume was adjusted to 4 mL with water. After 30 min shaking of the solutions in the darkness, the absorptions of the DPPH solutions were measured at 517 nm. The percentage of the reduced DPPH was calculated by the following equation:
Percentage of DPPH reduction = ((A0 – A1)/ A0) x 100), that A0 is the absorbance of the control (2 mL DPPH solution + 2 mL water), and A1 is the absorbance in the presence of sampl. The IC50s were calculated by linear regression equations of the DPPH inhibition percentage from different concentrations of the algal extracts , the standard antioxidants, using Microsoft Excel and Curve Expert statistical programs and expressed as: mg algae extracted with solvent/ 1 mL 0.5 × 10⁻⁴ M DPPH.
Determination of the total phenol content in the algal extracts
The total phenol contents of the algal extracts were determined by the Folin-Ciocalteau method as described previously with some modifications (
14,
15). Briefly, to a 40 μL solution of the algal extract was added 3.16 mL water and 200 μL Folin-Ciocalteau reagent.The mixture was shaken well. 600 μL of a 0.25% sodium carbonate was added to this solution after 8.5 min incubation at room temperature. The above solution was further incubated at RT for 2 h and its absorbance was measured at 765 nm against the blank. The concentrations of the total phenolics were measured against a series of gallic acid standard solutions and expressed as mg equivalent of gallic acid in 1 g dry algal material (mg EG/g AM) (
16).
Antibacterial and antifungal agar disc diffusion method
To examine the antibacterial activity of the algal extracts, three gram-negative bacteria (Escherichia coli: PTCC1330, Klebsiella pneumonia: PTCC1053 and Salmonella typhi: PTCC1609) and three gram-positive bacteria (Staphylococcus aureus: PTCC1112, Staphylococcus epidemidis: PTCC1114, Bacillus subtilis: PTCC1023) were chosen and tested in agar disc diffusion (ADD) bioassays. The minimum inhibitory concentrations (MIC) of the active extracts were determined using nutrient broth micro-dilution (NBMD). For antifungal bioassays the extracts were tested against the growth of Aspergillus niger: PTCC5010 and Candida albicans: PTCC5027 in ADD bioassays.
Bacteria were grown in nutrient broth (Merck) overnight at 37ºC. Before seeding the agar plates, their optical density were measured at 600 nm and adjusted to 0.1. The crude extracts (methanol, 80% methanol in water, dichloromethane and water) and the compounds separated from the preparative TLCs, were dissolved in the respective solvent and applied (5 mg) onto paper disc of 6 mm diameter. The dried papers were placed on agar seeded with 1 ml of the above bacteria suspension in a Petri dish. The Petri dishes were placed for 5 h at 4 °C that the metabolites could diffuse in the medium. The plates were incubated at 37°C for 18 h. The antibacterial activity was determined by measuring the diameters of the clean inhibitory zone (IZ) around each paper disc. Chloramphenicol was used as the positive control (
17). The antifungal bioassay were performed with two test organisms
A. niger and
C. albicans with the procedure described previously (
18). The microorganisms were grown in sabouraud dextrose broth (SDB) at 25 ºC for 48 h. sterile paper discs (charged with 10 mg algal extracts) placed on the agar media which was seeded with 1 mL fungi suspension in the SDB. The antifungal potential of the extracts measured as the clear IZ diameter around the paper discs after 48 h incubation at 25ºC and compared with standard chlotrimazol discs.
Antibacterial TLC bioautography
Different algal crude extracts were analyzed by silica gel TLC plates (ethyl acetate-hexane=1:1 v/v, as the mobile phase) and the extracts were subjected to antibacterial TLC bioautography as described previously (
17,
19). Briefly, a suspension of the gram positive bacteria
Staph. aureus,
Staph. epidemidis and
B. subtilis, and the gram negative bacteria
E. coli in nutrient broth were sprayed on the developed TLC plates. TLC plates were incubated for 4 hr at 37°C. The TLC plates were then sprayed with
p-iodonitrotetrazolium violet (INT) solution (0.5 g/ 100 mL H
2O) and incubated 1 h to visualize the purple color. White zones, representing the antibacterial constituents, were observed in case of
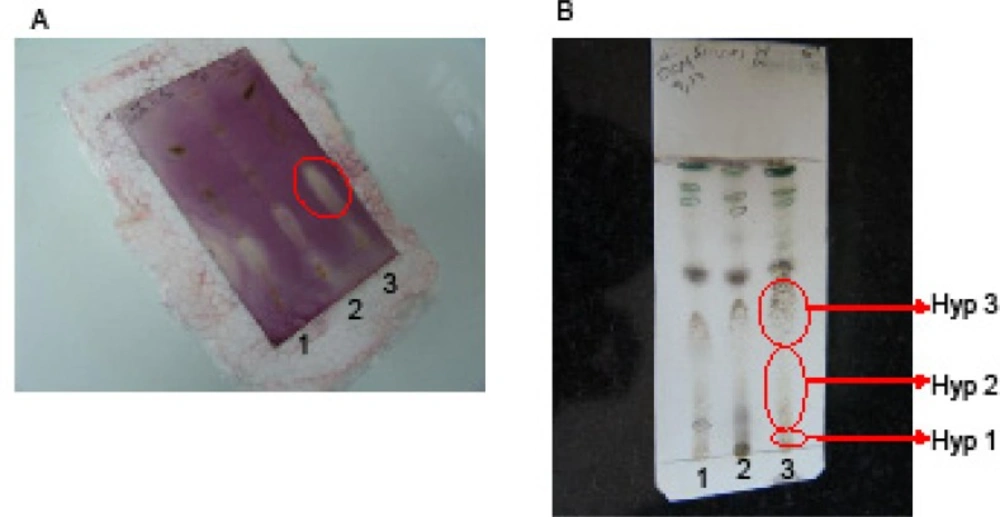
B. subtilis (
Figure S.2).
The corresponding bands in the preparative-TLC plates to the antibacterial zones on the TLC bioautography were divided into three parts from the baseline (
Figure S.2). Each silica-gel band was extracted with chloroform and subjected to antimicrobial MIC bioassay and GC-MS analyses. Chloramphenicol was used as the standard antibacterial.
A) TLC bioautography on dichloromethane (DCM) extract of the algae (100 μg/spot; 1) Sargassum boveanum 2) Cystoseira myrica and 3) Hypnea flagelliformis) on a silica gel plate, and the plate immersed in Staphylococcus aureus suspension and after incubation at 37 ºC sprayed with iodonitrotetrazolium chloride solution (INT). The pale zones indicated the presence of antibacterial compounds. B) Silica gel TLC using 5% acetone in chloroform as the mobile phase visualised by vanillin-sulphuric acid solution which was then used as a guide to separate the antibacterial constituents on the preparative-TLC in three bands for the algal extracts. Hyp stands for Hypnea flagelliformis
Antibacterial minimum inhibitory concentration (MIC) using nutrient broth micro-dilution (NBMD)
NBMD was performed by using serial two-fold dilution of the algal extracts added to bacterial suspension in nutrient broth as described previously (
20,
21). The algal extract or positive control was dissolved in DMSO in different concentrations and was added (5 μL) to 95 μL of fresh media and 100 μL of bacterial suspension (OD=0.1 at 600 nm) in a 96-well microplate. The microplates were incubated at 37 ºC for 24 h in a shaking incubator and then 10 μL of 0.5% INT solution in water was added to each well and incubated for further 30 min at the above condition. The MIC was considered as the lowest concentration of the extract or antibacterial standard which discolored the purple color of the INT solution.
Gas chromatography-mass spectrometry (GC-MS) and GC-flame ionization detector (FID)
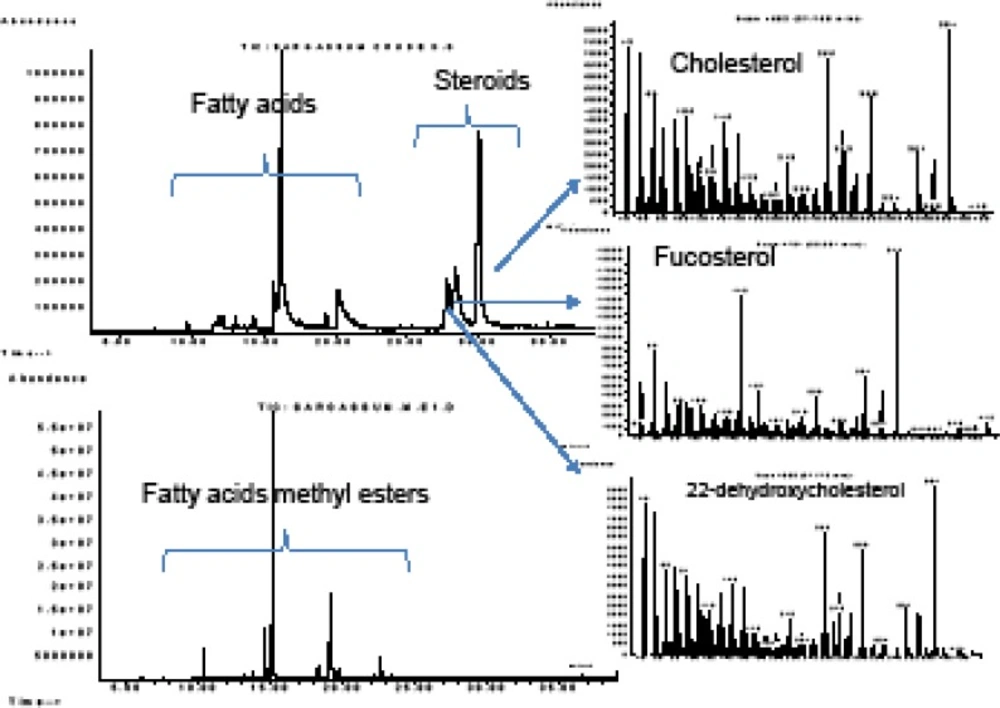
GC-MS analysis was carried out on an Agilent 7890A GC coupled to HP-6890 mass spectrometer operating in EI mode at 70 ev. The GC was equipped with a DB-5 MS (J & W Scientific column, 30 m X 0.25 mm i.d., 0.25 μm film thickness). To analyze the fatty acids, the oven temperature was programmed from 150 °C and after 4 min, rose to 250 °C at 4 °C/min and kept for 10 min at 250 °C. For steroidal analyses the oven temperature was set at 265 °C for 40 min. The carrier gas was helium (He) with a flow rate of 1 mL/min and the injector temperature was set at 260 °C in split mode (1:10). The injection volume was 0.1 μL for all of the samples. The GC-FID analyses were performed on the above instrument with the same analytical conditions, but the temperature of FID was set at 250 °C.
Fatty acids methyl esterification
The FFAs in the algal extracts were analyzed by GC-MS and after identification of the main FFAs in the crude extracts, they were transformed to their methyl ester derivatives using treatment of the crude algal extract with BF
3 in MeOH (
22). Briefly 250 μL 10% BF
3 in methanol was added to 20 μg of the crude extract and heated on a boiling water bath for 1 h in a sealed glass vial. Three ml hexane and 1 mL water were added to the above solution, followed by extraction of the water layer with further 2 mL hexane after separation of the first hexane layer. The organic layer was dried over dry Na
2SO
4, evaporated under a nitrogen stream and dissolved in 1 mL hexane containing 0.1 mg thymol as internal standard and then subjected to GC-FID analyses.
Identification of the constituents
The free fatty acids or their methyl esters were identified by comparing their retention times, indices (
23) and mass spectra recorded on GC-MS with those published in the
literature (
24,
25). The steroids were identified by comparison of their mass spectra and their retention times with those recorded for authentic sample.