Introduction
Rapid gastrointestinal transit could result in incomplete drug release from the device above the absorption zone leading to diminished efficacy of the administered dose (1). Therefore, different approaches have been proposed to retain the dosage form in the stomach. These include bioadhesive systems, (2) swelling and expanding systems, (3, 4) and floating systems (5, 6). Large single-unit dosage forms undergo significant swelling after oral administration and the swollen matrix inhibits the gastric emptying even at an uncontractile state of the pyloric sphincter. Park and Park reported medicated polymeric sheets and swelling of balloon hydrogels (7). But the swelling and expanding systems may show the hazard of permanent retention. Bioadhesive systems may cause problems such as irritation of the mucous layer owing to high localized concentration of the drug (8). Hydrodynamically balanced systems were designed using effervescent mixtures.
In recent years, polyethylene oxide (PEO) has attracted much attention as a polymeric excipient that can be used in formulations for different purposes. For instance, formulations with PEO have been extruded to make different products such as swellable and erodible implants (9), scaffolds for tissue engineering (10), or, to be used in the production of micelles with amphiphilic drugs, when solid dispersions incorporating these drugs are placed in aqueous environments (11). However, PEOs are mostly used to produce controlled release solid dosage forms such as matrixes, reservoirs, or coated cores (12, 13, 14). Due to their chemical structure, PEOs are among various hydrophilic polymers that, in the presence of water, control the release of the active moiety either by swelling (large molecular weight; > 2 MDa (mega Dalton)) or by eroding and swelling (small molecular weight; < 0.9 MDa), forming a hydrogel. In both cases, water triggers the process starting the erosion and/or the swelling processes. All this attention to PEOs is due to the consequence of their physical and chemical stability, compressibility, high swelling ability, and good solubility in water. Thus, PEOs have been proposed as alternatives to cellulose or other ethylene glycol derivatives in the production of tablets or granules.
Domperidone is a synthetic benzimidazole compound that acts as a dopamine D2 receptor antagonist. Its localization outside the blood-brain barrier and antiemetic properties has made it a useful adjunct in therapy for Parkinson’s disease. There has been renewed interest in antidopaminergic prokinetic agents since the withdrawal of cisapride, a 5-HT4 agonist, from the market. Domperidone is also used as a prokinetic agent for treatment of upper gastrointestinal motility disorders (15, 16). It continues to be an attractive alternative to metoclopramide because of its fewer neurological side effects. Patients receiving domperidone or other prokinetic agents for diabetic gastropathy or gastroparesis should also be managing diet, lifestyle, and other medications to optimize gastric motility (17). It is rapidly absorbed from the stomach and the upper part of the gastrointestinal tract (18) after the oral administration and few side effects have been reported (15, 16). It is a weak base with good solubility in acidic pH but in alkaline pH solubility is significantly reduced. Oral controlled release dosage forms containing drug, which is a weak base, are exposed to environments of increasing pH and the poorly-soluble freebase may be precipitated within the formulation in the intestinal fluid. Precipitated drug is no longer capable of being released from formulation (19, 20). The short biological half-life of drug (7 h) also favors development of a sustained release formulation.
The major objective of the present investigation was to develop a gastroretentive drug delivery system containing domperidone using simplex lattice design as an optimization technique.
Experimental
Materials
Domperidone was a kind gift from Maan Pharmaceutical Ltd (Mehsana, India). Polyethylene oxide WSR 303 (Polyox® WSR 303, mw = 7×10⁶) was received as a gift sample from Dow Chemical company, New Jersey (USA), Hydroxypropyl methylcellulose (HPMC K15 M), and sodium bicarbonate were procured from Laser Chemicals (Ahmedabad, India). Magnesium stearate and talc were purchased from Apex Chemicals (Ahmedabad, India). All other ingredients used were of analytical grade and were used as received.
Methods
Preparation of domperidone floating tablets
Domperidone, the required quantity of polymers (Polyox® WSR 303 and HPMC K15M), sodium bicarbonate and starch were mixed in mortar by spatula for 15 min. The powder blend was then lubricated with talc and magnesium stearate and compressed in tablets using 8 mm flat-face round tooling on rotary tablet press (Rimek, India, Ahmedabad). Compression force was adjusted to obtain tablets with hardness in range of 4-5 Kg/cm2. The tablets weighed 145 ± 2 mg, had a round flat-face with average diameter 8 ± 0.1 mm and a thickness of 2.5 ± 0.2 mm.
Simplex lattice design
A simplex lattice design (21) was adopted to optimize the formulation variables. In this design, three factors were evaluated by changing their concentrations simultaneously and keeping their total concentration constant.
The simplex lattice design for a 3-component system is represented by an equilateral triangle in 2-dimensional space (Figure 1). Seven batches (S1-S7) were prepared (Table 1) by taking three independent variables; one at each vertex (X1, X2, X3), one at the halfway point between vertices (X1X2, X2X3, X1X3), and one at the center point (X1X2X3). Each vertex represents a formulation containing the maximum amount of 1 component, with the other 2 components at a minimum level. The halfway point between the 2 vertices represents a formulation containing the average of the minimum and maximum amounts of the 2 ingredients represented by 2 vertices. The center point represents a formulation containing one third of each ingredient.
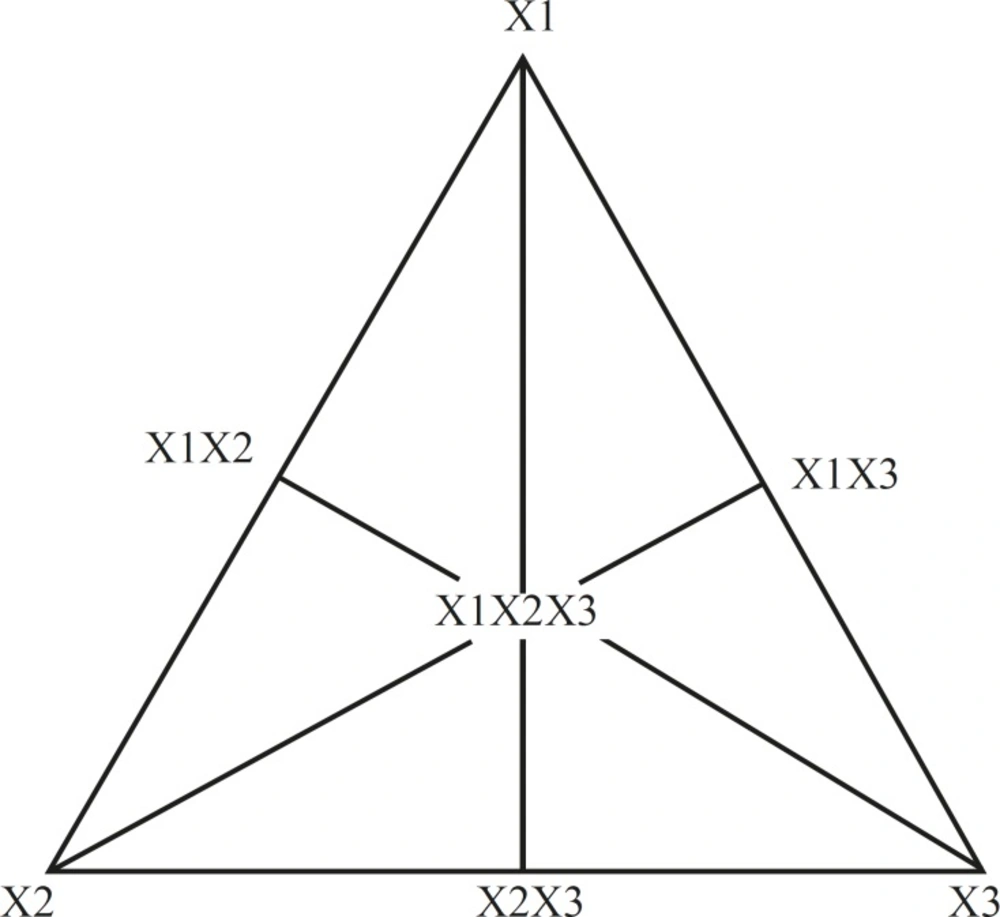
Figure 1
Equilateral triangle representing simplex lattice design for 3 components
Table 1
Formulation and evaluation of batches in simplex lattice design
| Transformed fraction of variables | Dependent Variables | |||||||||||
|---|---|---|---|---|---|---|---|---|---|---|---|---|
| Batch Code | X1 | X2 | X3 | FLT ± SD | t50% ± SD | t80% ± SD | n ± SD | k ± SD | ||||
| S1 | 1 | 0 | 0 | 20 ± 2 | 9.583 ± 1.9 | 12.344 ± 2.2 | 0.733 ± 0.045 | 6.445 ± 0.3 | ||||
| S2 | 0 | 1 | 0 | 55 ± 3 | 12.684 ± 2.3 | 17.435 ± 2.6 | 0.591 ± 0.007 | 9.853 ± 1.2 | ||||
| S3 | 0 | 0 | 1 | 10 ± 4 | 11.702 ± 0.8 | 21.527 ± 0.8 | 0.620 ± 0.004 | 9.929 ± 0.4 | ||||
| S4 | 0.5 | 0.5 | 0 | 35 ± 5 | 17.077 ± 1.7 | 26.350 ± 1.7 | 0.513 ± 0.032 | 14.435 ± 2.1 | ||||
| S5 | 0 | 0.5 | 0.5 | 98 ± 3 | 18.11 ± 1.4 | 28.49 ± 1.1 | 0.489 ± 0.0019 | 15.402 ± 0.3 | ||||
| S6 | 0.5 | 0 | 0.5 | 25 ± 2 | 11.194 ± 0.5 | 23.811 ± 0.7 | 0.635 ± 0.0021 | 10.386 ± 0.7 | ||||
| S7 | 0.33 | 0.33 | 0.33 | 39 ± 3 | 15.277 ± 1.2 | 23.071 ± 2.0 | 0.5748 ± 0.002 | 12.319 ± 1.8 | ||||
| Actual Value | ||||||||||||
| Coded Value | X1 | X2 | X3 | |||||||||
| 1 | 60 | 30 | 20 | |||||||||
| 0 | 50 | 20 | 10 | |||||||||
The amounts of matrixing agent (Polyethylene oxide WSR 303, X1), gelling agent, (HPMC K15M, X2), and gas-generating agent (sodium bicarbonate, X3) were selected as independent variables. Floating lag time (FLT), time required for 50% and 80% drug release (t50 and t80 respectively), Diffusion exponent (n), and release rate constant (k) were selected as dependent variables.
A statistical model incorporating 7 interactive terms was used to evaluate the responses.
Y = b0 + b1X1 + b2X2 + b3X3 + b1,2X1X2+ b2,3X2X3 +b1,3X1X3 + b1,2,3X1X2X3
Where Y is the dependent variable, b0 is the arithmetic mean response of the 7 runs, and bi is the estimated coefficient for the factor Xi. The main effects (X1, X2, and X3) represent the average result of changing 1 factor at a time from its low to high value. The interaction terms (X1X2, X2X3, X1X3, and X1X2X3) show how the response changes when 2 or more factors are simultaneously changed. The statistical analysis of the simplex lattice design batches was performed by multiple linear regression analysis using Microsoft Excel.
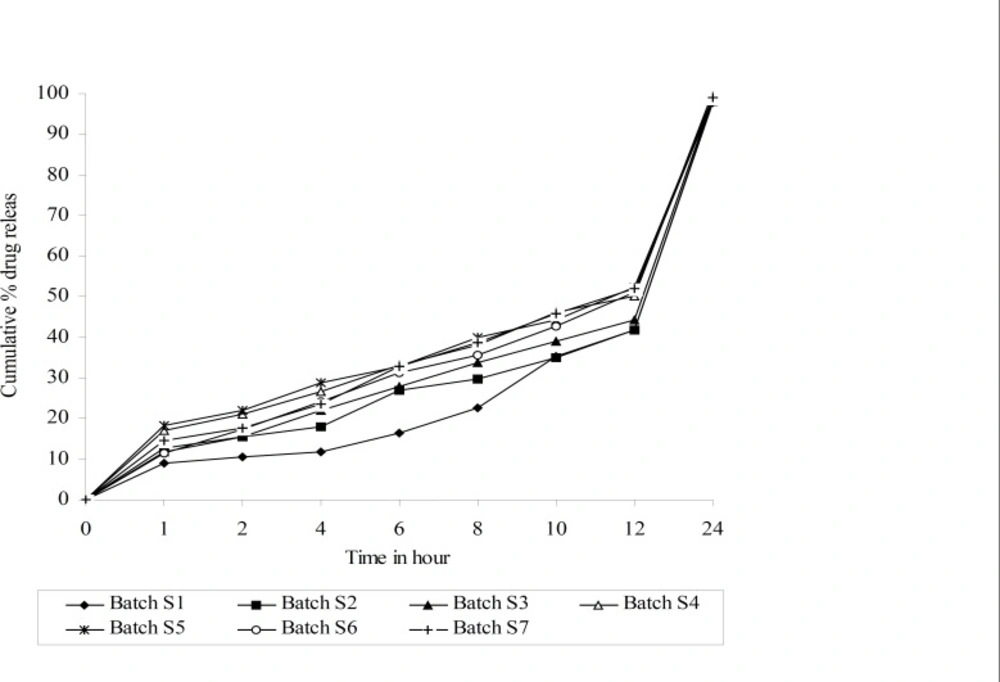
Figure 2
Drug release profiles of simplex lattice design batches
In-vitro buoyancy studies
The in-vitro buoyancy was determined by floating lag time as per the method described by Rosa et al. (22). The tablets were placed in a 100 mL glass beaker containing simulated 0.1N Hydrochloric acid, as per USP. The time required for the tablet to rise to the surface and float, was determined as the floating lag time.
In-vitro dissolution studies
The in-vitro dissolution study of domperidone tablets was performed using USP apparatus (model TDT-06T, Electrolab, Mumbai, India) fitted with paddles (50 rpm) at 37°C ± 0.5°C using Hydrochloric acid (pH 1.2, 900 mL) as a dissolution medium. At the predetermined time interval, 5 mL samples were withdrawn, filtered through a 0.45 m
Calculation of immediate release part
The pharmacokinetic parameters of domperidone were used to calculate a theoretical drug release profile for a 24 h dosage form. The immediate release part for sustained release domperidone was calculated using Equation 1 and was found to be 4.211 mg.
Immediate release part = (Css × Vd) / F (1)
Where, CSS is steady-state plasma concentration (Average Cmax), Vd is volume of distribution, and F is fraction bioavailable. Hence, the formulation should release 4.211 mg (14.04%) of drug in 1 h like conventional tablets and 1.121 mg (3.74%) per hour up to 24 h. The similarity factor, f2, given by Scale Up and Pose Approval Changes (SUPAC) guidelines for modified release dosage form was used as a basis to compare dissolution profiles (24).
Table 2
Analysis of variance table for dependent variables from simplex lattice design
| Source | SS | DF | MS | F value | Prob |
|---|---|---|---|---|---|
| Floating lag time (FLT) | |||||
| Model | 4 | 5179.885 | 1294.971 | 28.29187 | 0.03443 |
| Residual | 2 | 91.54371 | 45.77185 | ||
| Total | 6 | 5271.429 | |||
| Time required for 50% drug release (t50%) | |||||
| Model | 3 | 6.45989986 | 2.15329995 | 9.538526 | 0.048185 |
| Residual | 3 | 0.67724299 | 0.22574766 | ||
| Total | 6 | 7.13714286 | |||
| Time required for 80% drug release (t80%) | |||||
| Model | 1 | 16.814736 | 16.814736 | 6.888313 | 0.046839 |
| Residual | 5 | 12.205264 | 2.4410528 | ||
| Total | 6 | 29.02 | |||
| Model | 3 | 0.03359082 | 0.01119694 | 35.0759 | 0.007769 |
| Residual | 3 | 0.00095766 | 0.00031922 | ||
| Total | 6 | 0.03454848 | |||
| Release rate constant (k) | |||||
| Model | 2 | 57.0932443 | 28.5466222 | 10.72798 | 0.024691 |
| Residual | 4 | 10.6437974 | 2.66094936 | ||
| Total | 6 | 67.7370417 | |||
Results and Discussion
Polyethylene oxide WSR 303 was selected as a matrixing agent to impart sufficient integrity of the tablets. HPMC K 15 M was selected as a gelling agent, considering its widespread applicability and excellent gelling activity in sustained release formulations. Sodium bicarbonate generates CO2 gas in the presence of hydrochloric acid, present in dissolution medium. The generated gas is trapped and protected within the gel (formed by hydration of HPMC), leading to decrease in density of the tablet. As the density of the tablet falls below 1 (density of water), the tablet becomes buoyant. It was observed that the increase in amount of Polyethylene oxide WSR 303, leads to decrease the cumulative percentage of drug release. Hence, it was decided to optimize the amount of polyethylene oxide WSR 303 between drug, polyethylene oxide WSR 303 1 : 2 ratio. As the amount of HPMC K15M was increased from drug to polymer (1 : 1 to 1 : 3 ratio), the floating lag time increased, indicating that a high amount of HPMC is undesirable to achieve low floating lag time. Below drug to polymer 1 : 1 ratio HPMC K 15M might not give sufficient strength to the matrix to prolong drug release up to 24 h. Hence, it was decided to optimize HPMC K 15 M for drug, HPMC K 15 M in 1 : 1 ratio. Twenty mg of sodium bicarbonate was optimized as CO2 producing agent from preliminary studies.
The values for Floating lag time (FLT), time required for 50% and 80% drug release (t50% and t80% respectively), release rate constant (k) and diffusion component (n) for all 7 batches (S1-S7) showed a wide variation (Table 2). The data clearly indicate that the values of FLT, t50%, t80%, k and n are strongly dependent on the selected independent variables.
Dissolution profiles of all batches of factorial design were compared with theoretical dissolution profile. The results of similarity factor indicate that batches S2 to S7 fulfill the above criteria. But batch S7 showed highest f2 among all the batches. Hence, batch S7 more similar compare to other batches of simplex lattice design, similarity between theoretical dissolution profile and dissolution profile of S7 is shown in Figure 3.
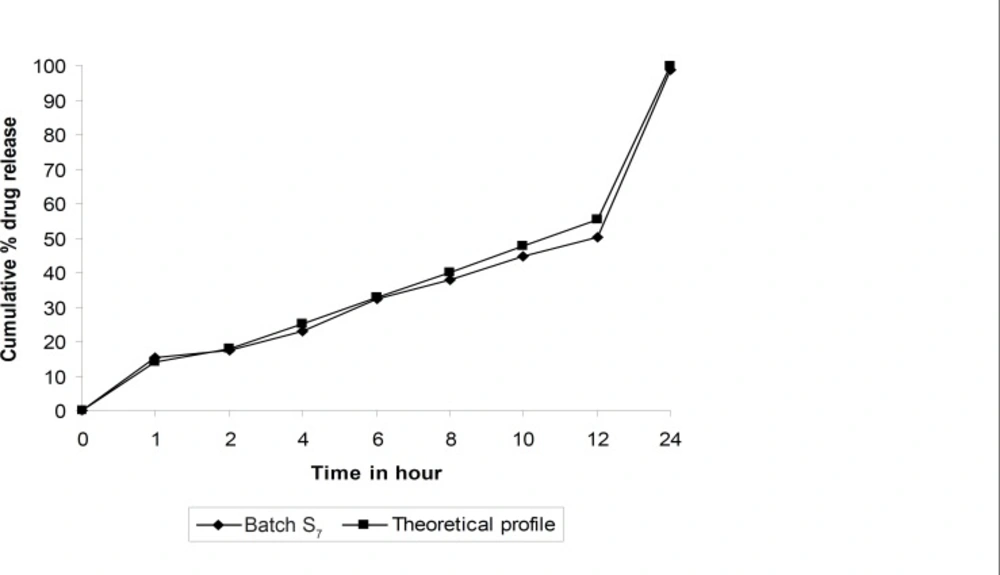
Figure 3
Comparison of in-vitro dissolution profiles of batch S7 and theoretical dissolution profile.
The fitted equation relating the responses Floating lag time (FLT), time required for 50% and 80% drug release (t50% and t80% respectively), release rate constant (k) and diffusion component (n) to the transformed factor are shown in Equations 2, 3, 4, 5 and 6, respectively.
FLT = 98.7859 - 62.4770 × X2 - 87.4770 × X3 - 62.7759 × X1X2 - 132.7759 × X2X3
R - square = 0.98263 ( 2 )
t50% = 12.4872 - 1.2714 × X3 - 9.6857 × X1X2 - 5.9428 × X2X3
R - square = 0.90511 ( 3 )
t80% = 19.1078 + 17.2948 × X1X2
R - square = 0.9418883 ( 4 )
n = 0.6422 + 0.0676 × X1 - 0.6017 × X1X2 - 0.4456 × X2X3
R - square = 0.97228066 ( 5 )
k = 9.0676 + 22.9004 × X1X2 + 24.8700 × X2X3
R - square = 0.9180772 ( 6 )
The high value of correlation coefficient for FLT, t50%, t80%, n and k indicate good fit (Table 2). The polynomial equations can be used to draw the conclusions after considering the magnitude of coefficient and the mathematical sign that it carries (i.e., positive or negative).
Tablets of all batches (S1 to S7) had floating lag time varies from 10 sec to 98 sec. Polynomial equation for floating lag time (Equation 2) suggests that the amount of sodium bicarbonate and HPMC K15M has more significant effect on floating lag time. It may due to the interaction amongst gas generating agent (NaHCO3), dissolution medium (0.1 N HCl, pH of 1.2) reduce FLT, and hydrophilic nature of HPMC, which produce easy swelling of tablets. Figure 4 shows the 3D surface plot of the amount of PEO WSR 303 (X1), amount of HPMC K 15 M (X2) and amount of sodium bicarbonate (X3) versus FLT. The plot was drawn using State-Ease (Design-Expert® version 7, Stat-Ease, Inc., Minneapolis, MN 55413). The data demonstrate that X1, X2 and X3 affect the floating lag time. It may also be concluded that the low level of X1 (amount of PEO WSR 303) and the high level of X3 (amount of sodium bicarbonate) favor the low floating lag time. The high value of X2X3 coefficient also suggests that the interaction between X2 and X3 has a significant effect on FLT. It can be concluded that the FLT changed by appropriate selection of the X2 and X3 levels.
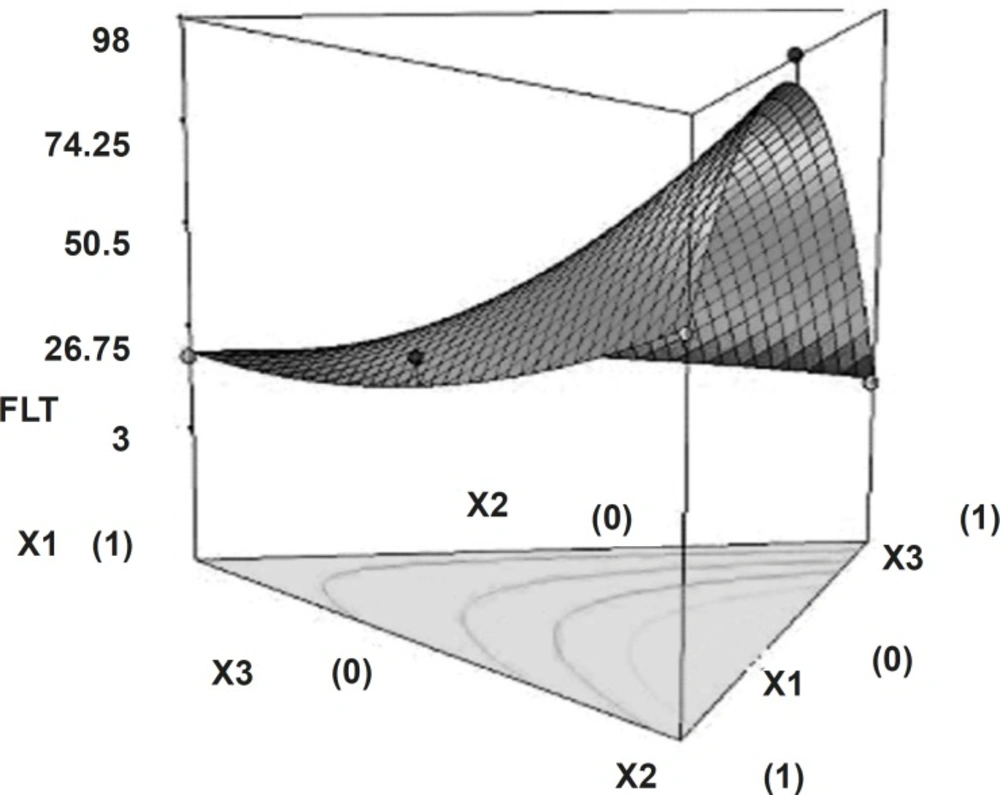
Figure 4
Response surface plot (3D) showing the effect of the amount of PEO, HPMC and sodium bicarbonate on floating lag time
The time required to release 50% of drug (t50%) and the time required to release 80% of drug (t80%) showed wide variation (Table 1). Figures 5 and 6 show the 3D surface plot of the amount of PEO WSR 303 (X1), HPMC K 15 M (X2) and sodium bicarbonate (X3) versus t50% and t80%, respectively. The data clearly indicate that the dependent variables (t50%, t80%) are strongly dependent on the independent variables. The fitted equation relating the response t50% and t80% to the transformed factors are shown in Equations 3 and 4. Data of t50% and t80% clearly indicate that increase in the amount of sodium bicarbonate leads to decrease in the time required to 50% drug release. It may due to pores formation in tablet by sodium bicarbonate which produce CO2 when interacts with dissolution medium. The high value of X1X2 coefficient also suggests that the interaction between X1 and X2 has a significant effect on t80%. It can be concluded that the t80% changed by an appropriate selection of the X1 and X2 levels.
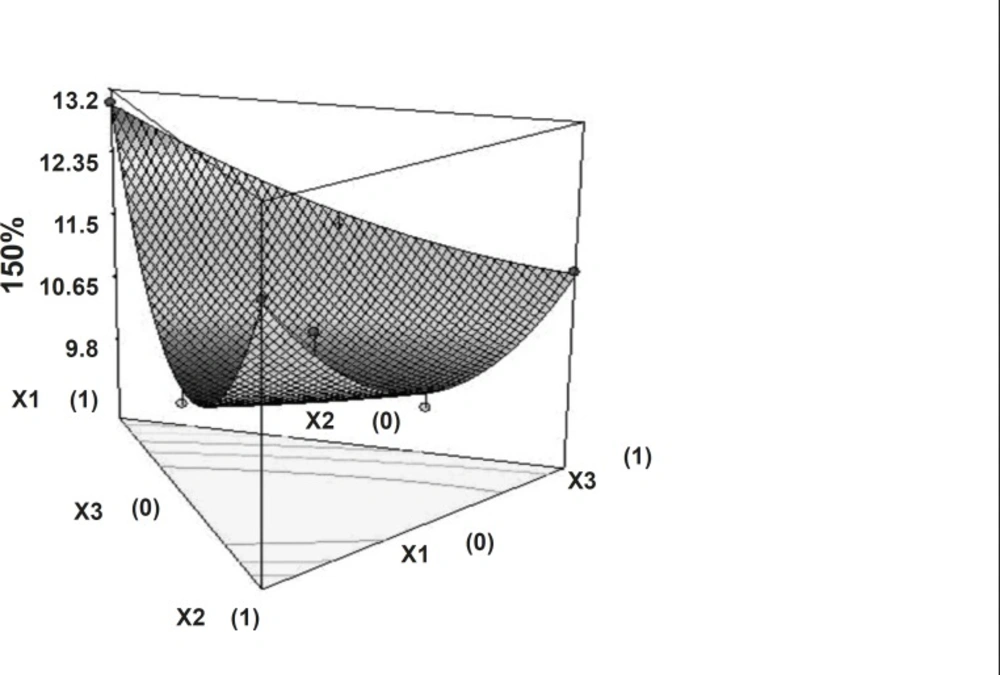
Figure 5
Response surface plot (3D) showing the effect of the amount of PEO, HPMC and sodium bicarbonate on t50%.
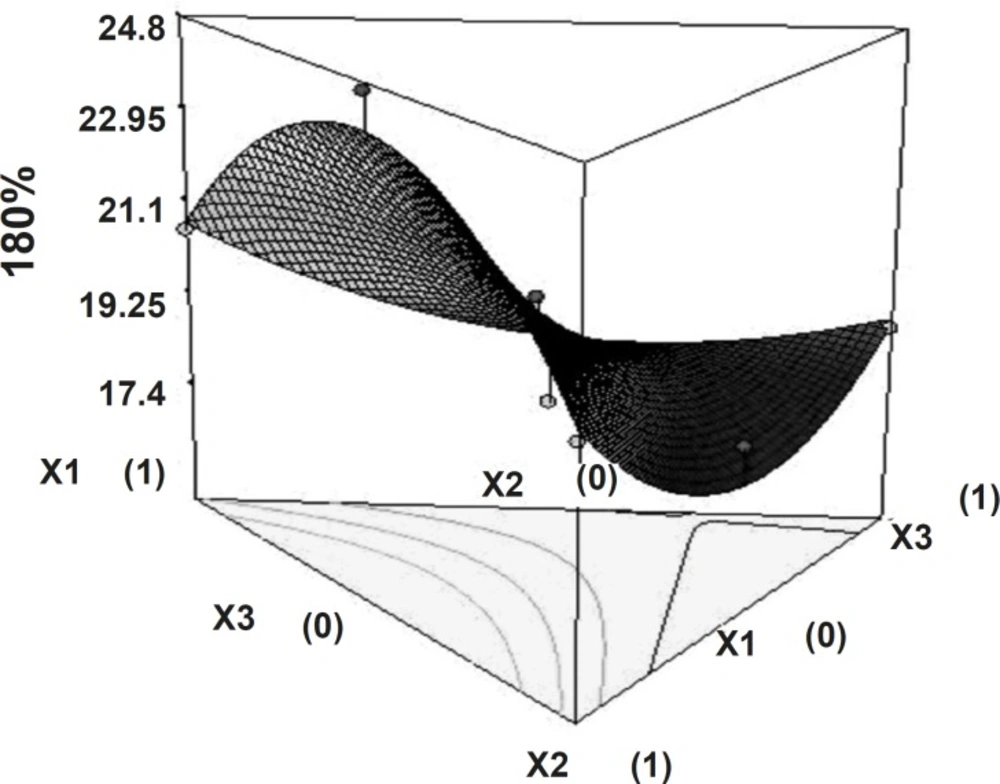
Figure 6
Response surface plot (3D) showing the effect of the amount of PEO, HPMC and sodium bicarbonate on t80%
Dissolution profiles were fitted with the power law equation given by Korsmeyer and Peppas24. Diffusion exponent value varies from 0.489 to 0.7332 indicate that drug release pattern anomalous involves the combination of swelling, diffusion and/or erosion of matrixes. This might be due to the poor water solubility of domperidone as well as the difference exists in characteristics of polymers. Non-linear relationship was obtained between the diffusion exponent and the two independent variables. Figure 7 shows the 3D surface plot of the amount of PEO WSR 303 (X1), HPMC K 15 M (X2) and sodium bicarbonate (X3) versus diffusion exponent.
Release rate constant showed that independent factors had significant influence (p < 0.05).
The high value of X1X2 and X2X3 coefficient also suggests that the interaction between X1X2 and X2X3 has a significant effect on release rate constant. It can be concluded that the release rate constant changed by appropriate selection of the X1, X2 and X3 levels. Figure 8 shows the 3D surface plot of the amount of PEO WSR 303 (X1), HPMC K 15 M (X2) and sodium bicarbonate (X3) versus release rate constant.
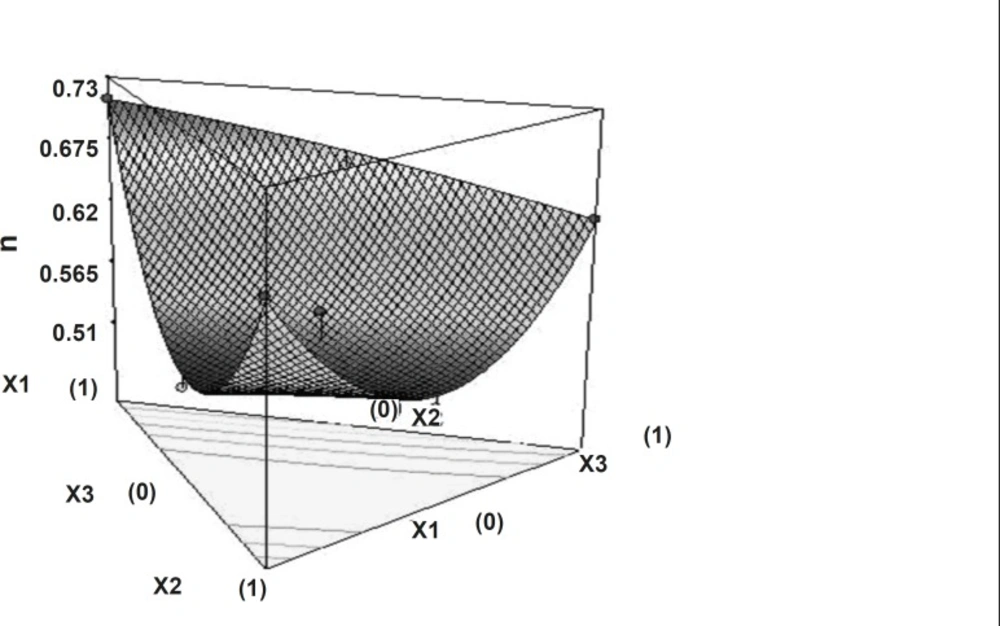
Figure 7
Response surface plot (3D) showing the effect of the amount of PEO, HPMC and sodium bicarbonate on diffusion exponent (n).
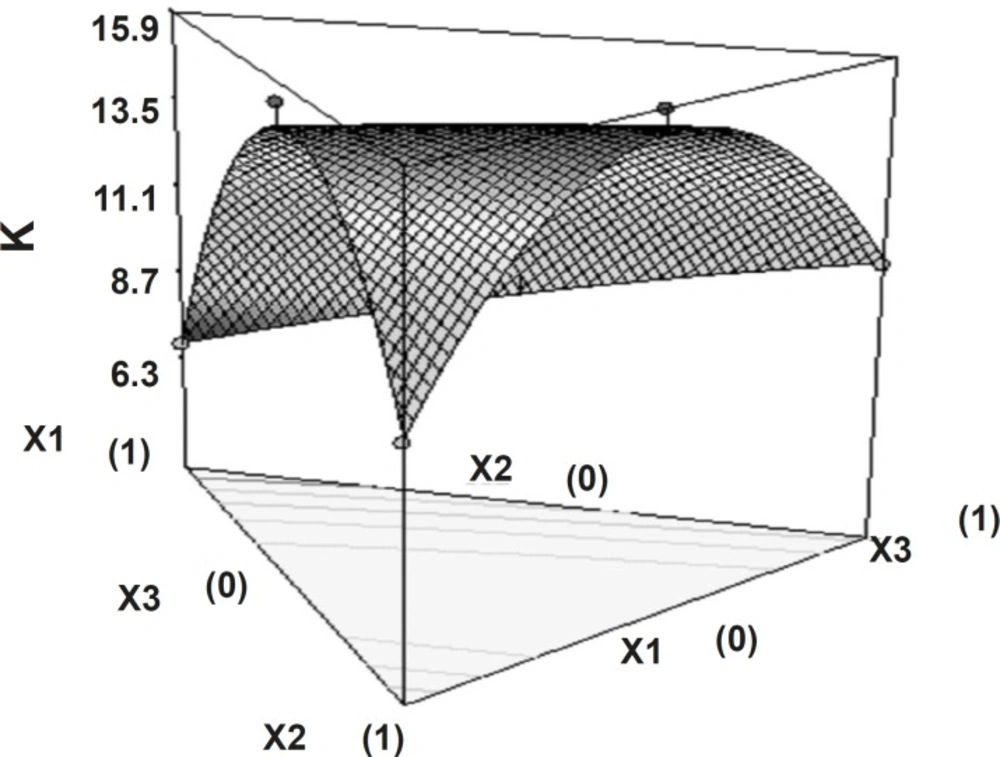
Figure 8
Response surface plot (3D) showing the effect of the amount of PEO, HPMC and sodium bicarbonate on release rate constant (k).
Conclusion
The amount of PEO and HPMC both had significant influence on the dependent variables. It was concluded that the content of PEO had a dominating role as drug release controlling factor, but using suitable concentration of sodium bicarbonate, one can tailor the desired drug release from hydrophilic matrixes for the development of floating tablets.