Introduction
Aflatoxin M1 (AFM1) is a monohydroxylated metabolite of aflatoxin B1 (AFB1) (1, 2). Feed may be contaminated with AFB1 where the environmental conditions are favorable for mold growth, and when AFB1 contaminated feed consume by dairy ruminant animals, AFB1 is transformed to AFM1 by means of microsomal cytochrome P450-associated enzymes in liver and excreted in milk at a rate of 0.3-6.2 percent of ingested AFB1, depending on the AFB1 amount of feed (2–4).
AFM1 contamination of milk and dairy products has been reported from many countries (5–8), most of which are located in the Mediterranean and the Middle East region, where environmental conditions is suitable for mold growth in agricultural products used as animal feed (6). It is noticeable that the presence of AFM1 in milk and dairy products were reported from Iran in many published articles during the last decade (7–9). Furthermore, some studies from Iran have demonstrated high frequency rate of AFM1 contamination in milk and dairy products (7).
In terms of food safety, the importance of AFM1 is due to its carcinogenic potency (1, 5). The International Agency for Research on Cancer (IARC) categorized AFM1 as a Group 2B human carcinogen in 1993 (1, 10). Therefore, the Joint FAO/WHO Expert Committee on Food Additives (JECFA) has not established a maximum tolerable daily intake (TDI) for AFM1, because AFM1 intake levels even less than 1 ng/kg body weight (BW) per day increase the risk of liver cancer, so recommended AFM1 level of milk and dairy products should be as low as reasonably achievable (ALARA) (7, 11). The greatest potential of milk for introducing AFM1 into the human diet has been demonstrated, so milk and dairy products consumption contribute significantly for the human exposure to AFM1 which is a serious public concern (Ruangwises & Ruangwises, 2010). The common AFM1 exposure assessment plan is based on the combination of the AFM1 occurrence data with milk intake data using a deterministic approach (12). However, the AFM1 levels in milk is usually low, and only long-term intake of such low levels is associated with the occurrence of diseases such as Hepatocarcinoma in humans (1). So, the main health concern is relevant to areas where have high milk consumption per capita, as well as children and adolescents who have the higher proportion of milk intake per kg of body weight. As a result, considering food consumption pattern and economic considerations (8), the legal maximum limits for AFM1 are different in various countries (2, 8, 13, 14).
Several methods have been developed for measuring AFM1 in milk such as ELISA as a screening method, and high performance liquid chromatographic techniques (HPLC) after immunoaffinity clean-up as a confirmatory method (5).
Several studies have reported the exposure to AFM1 through milk and dairy products consumption from different countries in worldwide (11, 12, 15–18). At the international level, AFM1 daily intake through milk consumption by European Union, Latin America, Far Eastern, Middle Eastern and African population was respectively estimated as 0.11, 0.058, 0.20, 0.10, and 0.002 ng/kg BW per day, within the framework of GEMS/Food regional diets (5, 19)
In Iran, AFM1 contamination of varied portion of analyzed milk samples was reported in almost all published studies so far (20) and based on the obtained results, occurrence and levels of AFM1 contamination seem to be a public health concern in winter season and humid climate regions of Iran, particularly for children (2, 21). However, AFM1 exposure through milk and traditional dairy product consumption in an adult population of four west (Kermanshah, Ilam, Hamadan, and Kurdistan) provinces is only one published report regarding AFM1 intake from Iran (21).
The purpose of this study was to determine the exposure to AFM1 through raw, pasteurized and UHT milk consumption in an adult urban population of Tehran province in Iran.
Experimental
Sampling
A total of 45 milk samples, including 25 raw and 20 Heat-treated milk (including 16 Pasteurized and 4 UHT milk) the samples were obtained from markets in different cities of Tehran province, during January and February 2017.
Raw milk samples were collected with sampler jars directly from milk-holding tanks in the traditional dairy product markets. After stirring the milk-holding tank, the equal amount of milk was collected from each tank in a market, and then pooled together, and finally, 500 mL milk sample was transferred to a disposable pet container.
Pasteurized and UHT milk samples were obtained from different supermarkets or hypermarkets in original packaging. Only one packaging was selected from each available brand. Then, 500 mL milk sample from each pack was transferred as a sample to a disposable pet container. Soon after collection, the samples were transported to the laboratory in an icebox with ice packets, and then stored at -20 °C and protected against light until further analysis for AFM1.
Apparatus, chemicals and reagents
Agilent Technologies 1200 Series HPLC system (USA) consisted of binary pumps and a fluorescence detector was used to determine AFM1 and equipped with a custom built oven column.
Separation was achieved using an Agilent Eclipse XDB- C18 column (4.6 × 150 mm, 5 μm).
Immunoaffinity column obtained from Libios (PuriFast Afla, Libios, France).
Chemicals and reagents were HPLC grade including: cetonitrile (Merck, Germany), Methanol (Merck, Germany), Deionized Water (Heal Force, China), Sodium Chloride (Merck, Germany), Potassium Chloride (Merck, Germany), Potassium Dihydrogen Phosphate (Aldrich, Germany), Disodium Hydrogen Phosphate (Carlo Erba, Italy), Nitric Acid 65% (Merck, Germany), and Potassium Bromide (Merck, Germany).
AFM1 stock standard solution was prepared from Sigma Chemical Co. (Sigma, USA) and kept frozen at −20 °C prior to the experiment. Working standard solutions AFM1 at concentrations of 0.25, 0.50, 0.75, 1.00, 1.25, and 1.50 μg/L in mobile phase were used to obtain the calibration curve.
Extractionand clean up procedure
According to the official national standard of ISIRI, No. 7133 based on ISO 14501/IDF 171 (22), the frozen milk samples were thawed using a water bath at 35 °C to 37 °C, and then liquid milk was centrifuged at 4500 × g for 15 minutes and upper fat layer discarded completely.
The skimmed milk was filtered through a paper filter (GVS Filter Technologies; Italy) and then 50 mL of it was passed through immunoaffinity column at flow rate of 1 mL/min.
Immunoaffinity column was previously brought to the room temperature by passing 10 ml of Phosphate buffered saline (PBS)]. Next, 15 mL of PBS was used for washing sample container and then passed through immunoaffinity column. The column was washed with a mixture of acetonitrile and methanol (3:2 v/v), twice (each time with 500 μL).
The eluate was collected in a conical tube and evaporated to dryness using a gentle stream of nitrogen. The residue was dissolved in 1 mL of mobile phase and then a 200μL aliquot was injected into LC system and filtered through a syringe filter (0.2 µm PTFE; USA).
Quantitativeanalysis by HPLC
The HPLC conditions for quantitative analysis of AFM1 were as follows: column temperature 40 °C and mobile phase consisted of water: methanol: acetonitrile (60:30:10 v/v) + 350 µL HNO3 4M + 120 mg/L KBr pumped at a flow rate of 1 mL/min. Excitation and emission wavelengths of fluorescence detector were 362 and 435 nm, respectively. The retention time for AFM1 was 5.8 min.
For identification of AFM1 peak in the sample chromatogram, its retention time was compared with that of the analyzed AFM1 standard under the same conditions. Using the equation of calibration curve, the area under the curve of sample chromatogram was calculated for quantitation of AFM1. The limits of detection (LOD) and quantitation (LOQ) of the current method were 0.01 and 0.03 μg/L, respectively.
Statistical Analysis
Mean, standard deviation (SD), and 95 percentile of AFM1 concentration in milk samples were statistically analyzed by the Data Analysis tools of Microsoft Excel 2010 for data analysis.
Calculation of exposure
In this study, daily intake of AFM1 was calculated using the deterministic approach explained by International Program on Chemical Safety (IPCS) (23).
Based on Global Environment Monitoring System (GEMS)/Food guidelines, as the proportion of censored data (results reported below LOD and/or LOQ) exceeded 60%, two scenarios were adopted and used for calculation purposes:
(1) the upper bound of mean (UB) computes after replacing the LOQ instead of the results that were lower than LOQ and LOD instead of the results that were lower than LOD; (2) the lower bound of mean (LB) computes by replacing the LOD instead of the results were lower than LOQ and zero instead of the results , lower than LOD (23–25).
The milk consumption per capita in Iran was calculated using the average milk consumption by a household from March 2016 to February 2017 as provided by the Household Budget Survey in Urban Areas of Iran in 2017 divided by the average size of urban households in this year (26). Then, milk consumption per capita by urban population of Tehran province was estimated by comparison whole country with Tehran household expenditure for purchasing milk types (27).
Taking into account the variability that exists in food consumption patterns within our studied population, the milk consumption per capita was calculated using coefficients obtained from the study performed by Nasimi et al. They demonstrated per capita milk consumption of two top income decile is almost three times more than two lowest income decile (28). Moreover, the pattern of household milk consumption is assumed to be raw milk or heat-treated milk or both.
Eventually, the mean and 95 percentile exposure levels (p95) to AFM1 were calculated by combining the mean and percentile 95 of the AFM1 concentrations with the milk intake using the following formula:
Daily intake [ng/kg BW /day] =
Results
Method performance
Each day a set of working standard solutions were injected to construct the calibration curve. The accepted linearity of the calibration of minimum R2> 0.98 was obtained at the working range. For quality control, recovery test was performed by spiking of the blank milk samples with known amounts of AFM1 (0.1 μg/L). Mean recovery rates and relative standard deviations were 90.6 ± 5.7%.
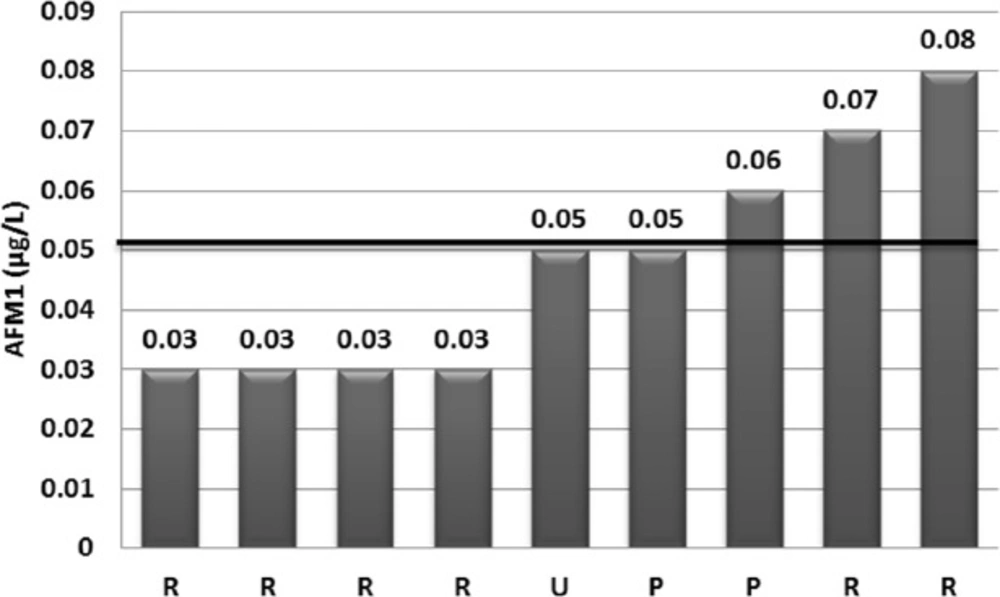
Figure 1
Distribution of AFM1 concentration of the analyzed milk samples above than the limit of quantification value (0.03 µg/kg). The mean of AFM1 concentration for these samples (0.047 µg/L) is represented with a horizontal line (R: raw milk, P: pasteurized milk, U: UHT milk)
Table 1
AFM1 contamination in different types of milk samples collected from markets of Tehran province during January and February, 2017
| Descriptive data | Raw milk | Heat-treated milk a | |
|---|---|---|---|
| Frequency rate (%) | 18/25 (72) | 18/20 (90) | |
| Mean (± SD) μg /kg | Positive samples | 0.045 (0.234) | 0.0533 (0.0057) |
| Total samples b | 0.0155- 0.0315 | 0.0156-0.0280 | |
| Percentile 95 | Positive samples | 0.075 | 0.059 |
| Total samples | 0.062 | 0.050 |
Table 2
AFM1 intake through milk consumption by each urban household’s member of Tehran province
| Milk type | Milk consumption pattern | AFM1 intake | AFM1 intake g | |||||
|---|---|---|---|---|---|---|---|---|
| Consumer group | Milk intake | Mean | Percentile | Mean | Percentile (P95) | |||
| (g/day) c | LB d | UB e | LB | UB | ||||
| Raw milk | High consumer | 222 | 3.44 | 6.99 | 13.21 | 0.05 | 0.10 | 0.19 |
| Moderate consumer | 148 | 2.29 | 4.66 | 8.86 | 0.03 | 0.07 | 0.13 | |
| Low consumer | 74 | 1.15 | 2.33 | 4.40 | 0.02 | 0.03 | 0.06 | |
| Heat-treated milk a | High consumer | 222 | 3.46 | 6.22 | 17.09 | 0.05 | 0.09 | 0.24 |
| Moderate consumer | 148 | 2.31 | 4.14 | 11.40 | 0.03 | 0.06 | 0.16 | |
| Low consumer | 74 | 1.15 | 2.07 | 5.70 | 0.02 | 0.03 | 0.08 | |
| Liquid milk b | High consumer | 222 | 3.46 | 6.56 | 14.87 | 0.05 | 0.09 | 0.21 |
| Moderate consumer | 148 | 2.30 | 4.37 | 9.92 | 0.03 | 0.06 | 0.14 | |
| Low consumer | 74 | 1.15 | 2.19 | 4.96 | 0.02 | 0.03 | 0.07 | |
Occurrence of AFM1 in milk
AFM1 was detected in 36 (80%) from 45 analyzed milk samples. However, the AFM1 level was 0.03µg/kg (LOQ) or higher in 9 (20%) samples. The concentration of AFM1 in 12 from 25 raw milk (48%) and 15 from 20 (75%) heat-treated milk positive samples were lower than LOQ. Distribution of AFM1 contamination was presented in Figure 1. As shown in this Figure, AFM1 concentration in 3 (6.66%) of the milk samples exceeded the EU maximum tolerance limit for AFM1 (0.05 µg/kg), although none of the analyzed samples were exceeded Iranian legal limit (0.1 µg/kg) (14) and the Codex Alimentarius criterion of 0.5 μg/kg (8, 13). The upper and lower limit of mean AFM1 concentrations was 0.016 and 0.030 μg/kg and its 95th percentile was 0.667 μg/kg, whereas mean (± SD) of AFM1 levels for the positive samples was 0.048 ± 0.019 μg/kg. The descriptive data of AFM1 contamination occurrence by type of sample was presented in Table 1.
AFM1 intake estimate
The milk consumption per capita by urban population of Tehran province was calculated 27, 54, and 81 kg/year (74, 148 and 222 gr/day) for population groups with high, moderate, and low milk consumption, respectively.
The average body weight for adults was assumed 70 kg. Accordingly, the mean daily exposure to AFM1 was calculated with the range between 0.03 (lower bound estimate) and 0.06 (upper bound estimate) ng/Kg BW per day for each member of the urban households in Tehran province.
The Mean and 95 percentile (p95) exposure to AFM1 through raw and heat-treated milk consumption were presented in Table 2.
Discussion
Milk and dairy products are an important part of the human diet, notably for infants and children, due to its richness in certain nutrients such as protein, calcium, riboflavin, phosphorus, potassium, vitamins A and D, and its usability at all ages (29). However, they could contain some contaminants such as AFM1(9) and AFM1 intake through milk consumption is an important health concern because of AFM1 carcinogenic properties, especially as there are no preventing procedures for the complete elimination of AFB1 in feeds, as well as suitable weather conditions for the growth of fungi and production of mycotoxins in feed. On the other hand, the resistance of AFM1 to the heat treatment and mild acidic conditions used in dairy processing were demonstrated (30, 31). So, the dairy products are contaminated with AFM1 if raw milk used for processing is contaminated with AFM1 (32, 33). The mixing of bulk milk consignments of different contamination levels is the only process currently applied (34).
Our results were lower than AFM1 exposure level reported from four west provinces of Iran (0.242 ng/kg BW per day) (21), Sao Paulo, Brazil (0.18 and 0.14 ng/kg BW per day) (15, 16), Catalania region, Spain (0.036 and 0.043 ng/ person per day for male and female, respectively) (12), and Serbia (1.420, 0.769 and 0.503 ng/kg BW per day during February, April and May 2013) (11) and higher than AFM1 exposure level reported from France (0.01 ng/kg BW per day) (17), while being agreement with a report from Rabat, Morocco (3.26 ng/person per day) (18). Level of AFM1 contamination and milk intake per capita are the most important factors affecting the exposure reported in these studies.
The estimated mean of AFM1 concentration in the present study was higher than the previous values reported from Iran by Sheikhloie and Safarpour (35) and Nowrozi and Kazemi (36), while being lower than the AFM1 average reported from Iran by kamkar et al. (37), Rezaei et al. (38) and mashak et al. (39). However, the reported results by Movassaghghazani and Ghorbiani (40) and Sohrabi and Gharahkoli (41) from Iran were similar to our results. Season of sampling and climate condition of the study area; number and type of analyzed samples, used method for AFM1 analysis were the factors influencing the AFM1 concentration reported by different researchers. It is remarkable, all samples in our study were collected in the winter season and, as reported by some researchers, the AFM1 contamination of raw milk in this season is significantly at higher level compared with other seasons. This is because of the lactating animals are fed with greater amounts of silage and concentrate feeds in cold seasons which may be contaminated with higher levels of AFB1 (21, 42, 43). However, the occurrence of AFM1 in samples collected from a modern dairy farm in winter season is higher than summer season versus traditional farm (43).
The lower consumption of milk in Iran than the recommended daily intake by optimal food basket (44) was another reason for being low AFM1 exposure that was obtained in our study. However, AFM1 intake in high consumers was up to three times more than low consumers, because of the milk and dairy products expending are strongly dependent on household income (28). Meanwhile, AFM1 exposure in children and adolescents who have more proportion of milk intake per kg of body weight are higher than adults. Moreover, AFM1 exposure in Tehran population will increase in the long term, because of an expected augment in milk consumption to the recommended daily intake by enhancing household livelihood and public knowledge.
Conclusion
This study represents one of the first insights into the AFM1 exposure through milk consumption in Iran population. Although the levels of AFM1 contamination in our collected milk samples and per capita milk consumption of our study population and so estimated AFM1 intake in an adult of Tehran population were low, the contribution of such low levels of AFM1 intake in increasing the risk of hepatocarcinoma could not be ignored, notably regarding an expected increase in milk consumption to the recommended daily intake in the long term. Therefore, systematic AFM1 monitoring program in raw milk should be performed in along the time. Moreover, as an important strategy to protect consumers against AFM1 intake, the conditions of harvest, postharvest, storage, and dairy feedstuffs production should be improved and regularly controlled in feedstuffs along the supply chain require prompt attention regarding AFB1 issues by veterinary competent authority.