


1. Background
2. Objectives
3. Methods
3.1. Materials and Reagents
3.2. Cell Grouping and Drug Treatment
3.3. Griess Nitrite Assay
3.4. Cytokine Measurement Using Enzyme-Linked Immunosorbent Assay
3.5. Measurement of Reactive Oxygen Species, Mitochondrial Superoxide, Mitochondrial Membrane Potential, and Mitochondrial Permeability
3.6. Western Blot Analysis
3.7. Molecular Docking
3.8. Molecular Dynamics Simulation Studies
3.9. Statistical Analysis
4. Results
4.1. Tanshinone IIA Inhibits the Inflammatory Response of Lipopolysaccharide-Induced Alveolar Macrophages
![Tanshinone IIA inhibits the inflammatory response of alveolar macrophages (AMs) induced by lipopolysaccharide (LPS): A, pro-inflammatory cytokine levels [nitric oxide (NO), tumor necrosis factor-alpha (TNF-α), interleukin-1β (IL-1β), interleukin-6 (IL-6)] in LPS-induced AMs; B, expression of p65, phosphorylated p65 (p-p65), NLRP3, pro-Caspase1, and cleaved Caspase1 in LPS-induced AMs [n = 3; values are presented as mean ± standard deviation (SD); *** P < 0.001 vs. the control group, @ P < 0.05, @@ P < 0.01, and @@@ P < 0.001 vs. LPS-treated group].](https://brieflands.com/journals/ijpr/articles/166272/figures/ijpr-24-1-166272-i001-preview.webp "Tanshinone IIA inhibits the inflammatory response of alveolar macrophages (AMs) induced by lipopolysaccharide (LPS): A, pro-inflammatory cytokine levels [nitric oxide (NO), tumor necrosis factor-alpha (TNF-α), interleukin-1β (IL-1β), interleukin-6 (IL-6)] in LPS-induced AMs; B, expression of p65, phosphorylated p65 (p-p65), NLRP3, pro-Caspase1, and cleaved Caspase1 in LPS-induced AMs [n = 3; values are presented as mean ± standard deviation (SD); *** P < 0.001 vs. the control group, @ P < 0.05, @@ P < 0.01, and @@@ P < 0.001 vs. LPS-treated group].")
Tanshinone IIA inhibits the inflammatory response of alveolar macrophages (AMs) induced by lipopolysaccharide (LPS): A, pro-inflammatory cytokine levels [nitric oxide (NO), tumor necrosis factor-alpha (TNF-α), interleukin-1β (IL-1β), interleukin-6 (IL-6)] in LPS-induced AMs; B, expression of p65, phosphorylated p65 (p-p65), NLRP3, pro-Caspase1, and cleaved Caspase1 in LPS-induced AMs [n = 3; values are presented as mean ± standard deviation (SD); *** P < 0.001 vs. the control group, @ P < 0.05, @@ P < 0.01, and @@@ P < 0.001 vs. LPS-treated group].
4.2. Tanshinone IIA Inhibits the Oxidative Damage of Lipopolysaccharide-Induced Alveolar Macrophages
![Tanshinone IIA inhibits the oxidative damage of alveolar macrophages (AMs) induced by lipopolysaccharide (LPS): A, intracellular reactive oxygen species (ROS) levels; B, mitochondrial MitoSOX content in LPS-induced AMs; C, expression of Nrf2 and heme oxygenase-1 (HO-1) in LPS-induced AMs [n = 3; values are presented as mean ± standard deviation (SD); *** P < 0.001 vs. the control group, @ P < 0.05, @@ P < 0.01, and @@@ P < 0.001 vs. LPS-treated group].](https://brieflands.com/journals/ijpr/articles/166272/figures/ijpr-24-1-166272-i002-preview.webp "Tanshinone IIA inhibits the oxidative damage of alveolar macrophages (AMs) induced by lipopolysaccharide (LPS): A, intracellular reactive oxygen species (ROS) levels; B, mitochondrial MitoSOX content in LPS-induced AMs; C, expression of Nrf2 and heme oxygenase-1 (HO-1) in LPS-induced AMs [n = 3; values are presented as mean ± standard deviation (SD); *** P < 0.001 vs. the control group, @ P < 0.05, @@ P < 0.01, and @@@ P < 0.001 vs. LPS-treated group].")
Tanshinone IIA inhibits the oxidative damage of alveolar macrophages (AMs) induced by lipopolysaccharide (LPS): A, intracellular reactive oxygen species (ROS) levels; B, mitochondrial MitoSOX content in LPS-induced AMs; C, expression of Nrf2 and heme oxygenase-1 (HO-1) in LPS-induced AMs [n = 3; values are presented as mean ± standard deviation (SD); *** P < 0.001 vs. the control group, @ P < 0.05, @@ P < 0.01, and @@@ P < 0.001 vs. LPS-treated group].
4.3. Tanshinone IIA Inhibits the Mitochondrial Damage of Lipopolysaccharide-Induced Alveolar Macrophages
![Tanshinone IIA inhibits the mitochondrial damage of alveolar macrophages (AMs) induced by lipopolysaccharide (LPS): A, mitochondrial membrane potential levels; B, mitochondrial permeability in LPS-induced AMs; C, expression of dynamin-related protein 1 (DRP1), optic atrophy 1 (OPA1), and mitofusin 2 (Mfn2) in LPS-induced AMs [n = 3; values are presented as mean ± standard deviation (SD); *** P < 0.001 vs. the control group, @ P < 0.05, @@ P < 0.01, and @@@ P < 0.001 vs. LPS-treated group].](https://brieflands.com/journals/ijpr/articles/166272/figures/ijpr-24-1-166272-i003-preview.webp "Tanshinone IIA inhibits the mitochondrial damage of alveolar macrophages (AMs) induced by lipopolysaccharide (LPS): A, mitochondrial membrane potential levels; B, mitochondrial permeability in LPS-induced AMs; C, expression of dynamin-related protein 1 (DRP1), optic atrophy 1 (OPA1), and mitofusin 2 (Mfn2) in LPS-induced AMs [n = 3; values are presented as mean ± standard deviation (SD); *** P < 0.001 vs. the control group, @ P < 0.05, @@ P < 0.01, and @@@ P < 0.001 vs. LPS-treated group].")
Tanshinone IIA inhibits the mitochondrial damage of alveolar macrophages (AMs) induced by lipopolysaccharide (LPS): A, mitochondrial membrane potential levels; B, mitochondrial permeability in LPS-induced AMs; C, expression of dynamin-related protein 1 (DRP1), optic atrophy 1 (OPA1), and mitofusin 2 (Mfn2) in LPS-induced AMs [n = 3; values are presented as mean ± standard deviation (SD); *** P < 0.001 vs. the control group, @ P < 0.05, @@ P < 0.01, and @@@ P < 0.001 vs. LPS-treated group].
4.4. Tanshinone IIA Regulates the M1/M2 Polarization of Lipopolysaccharide-Induced Alveolar Macrophages
![Tanshinone IIA regulates the M1/M2 polarization of alveolar macrophages (AMs) induced by lipopolysaccharide (LPS): A, expression of M1 polarization markers [CD86, cyclooxygenase-2 (COX-2), inducible nitric oxide synthase (iNOS)] in LPS-induced AMs; B, expression of M2 polarization markers [CD206, arginase-1 (ARG-1)] in LPS-induced AMs [n = 3; values are presented as mean ± standard deviation (SD); *** P < 0.001 vs. the control group, @ P < 0.05, @@ P < 0.01, and @@@ P < 0.001 vs. LPS-treated group].](https://brieflands.com/journals/ijpr/articles/166272/figures/ijpr-24-1-166272-i004-preview.webp "Tanshinone IIA regulates the M1/M2 polarization of alveolar macrophages (AMs) induced by lipopolysaccharide (LPS): A, expression of M1 polarization markers [CD86, cyclooxygenase-2 (COX-2), inducible nitric oxide synthase (iNOS)] in LPS-induced AMs; B, expression of M2 polarization markers [CD206, arginase-1 (ARG-1)] in LPS-induced AMs [n = 3; values are presented as mean ± standard deviation (SD); *** P < 0.001 vs. the control group, @ P < 0.05, @@ P < 0.01, and @@@ P < 0.001 vs. LPS-treated group].")
Tanshinone IIA regulates the M1/M2 polarization of alveolar macrophages (AMs) induced by lipopolysaccharide (LPS): A, expression of M1 polarization markers [CD86, cyclooxygenase-2 (COX-2), inducible nitric oxide synthase (iNOS)] in LPS-induced AMs; B, expression of M2 polarization markers [CD206, arginase-1 (ARG-1)] in LPS-induced AMs [n = 3; values are presented as mean ± standard deviation (SD); *** P < 0.001 vs. the control group, @ P < 0.05, @@ P < 0.01, and @@@ P < 0.001 vs. LPS-treated group].
4.5. Tanshinone IIA Regulates the Poly (ADP-ribose) Polymerase-1 Signaling Pathway in Lipopolysaccharide-Induced Alveolar Macrophages
![Tanshinone IIA regulates the poly (ADP-ribose) polymerase-1 (PARP-1) pathway in alveolar macrophages (AMs) induced by lipopolysaccharide (LPS): A, expression of PARP-1, inhibitor of kappa B-α (IκB-α), and phosphorylated inhibitor of kappa B-α (p-IκB-α) in LPS-induced AMs; B, schematic diagram of molecular docking of tanshinone IIA with PARP-1 [n = 3; values are presented as mean ± standard deviation (SD); *** P < 0.001 vs. the control group, @ P < 0.05, @@ P < 0.01, and @@@ P < 0.001 vs. LPS-treated group].](https://brieflands.com/journals/ijpr/articles/166272/figures/ijpr-24-1-166272-i005-preview.webp "Tanshinone IIA regulates the poly (ADP-ribose) polymerase-1 (PARP-1) pathway in alveolar macrophages (AMs) induced by lipopolysaccharide (LPS): A, expression of PARP-1, inhibitor of kappa B-α (IκB-α), and phosphorylated inhibitor of kappa B-α (p-IκB-α) in LPS-induced AMs; B, schematic diagram of molecular docking of tanshinone IIA with PARP-1 [n = 3; values are presented as mean ± standard deviation (SD); *** P < 0.001 vs. the control group, @ P < 0.05, @@ P < 0.01, and @@@ P < 0.001 vs. LPS-treated group].")
Tanshinone IIA regulates the poly (ADP-ribose) polymerase-1 (PARP-1) pathway in alveolar macrophages (AMs) induced by lipopolysaccharide (LPS): A, expression of PARP-1, inhibitor of kappa B-α (IκB-α), and phosphorylated inhibitor of kappa B-α (p-IκB-α) in LPS-induced AMs; B, schematic diagram of molecular docking of tanshinone IIA with PARP-1 [n = 3; values are presented as mean ± standard deviation (SD); *** P < 0.001 vs. the control group, @ P < 0.05, @@ P < 0.01, and @@@ P < 0.001 vs. LPS-treated group].
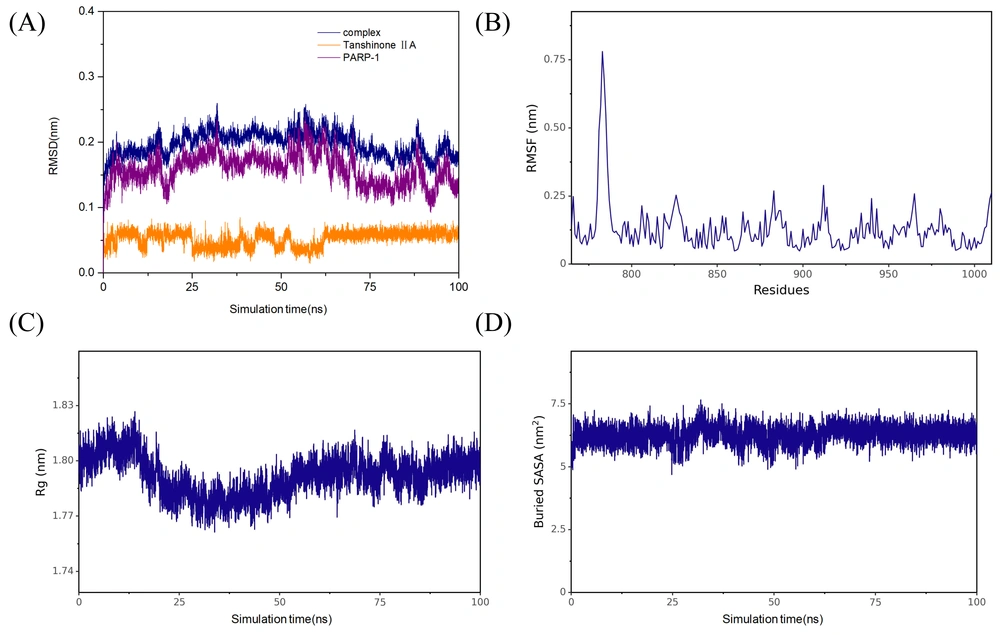
Molecular dynamics (MD) simulation results of tanshinone IIA and poly (ADP-ribose) polymerase-1 (PARP-1): A, root mean square deviation (RMSD) of the protein backbone, B, root mean square fluctuation (RMSF) of amino acid residues in the protein; C, radius of gyration of the protein backbone; and D, solvent-accessible surface area of the protein.





