4.1. Synthesis and Characterization of the MAX-HEDP Ligand
The target ligand, MAX-HEDP (C8H13NNa4O8P2S2), was successfully synthesized and isolated as a white crystalline solid in an excellent yield of 91%. The compound exhibited a high melting point (>300 °C), characteristic of ionic, thermally stable metal-chelating agents. The structure and purity of the ligand were unequivocally confirmed using a suite of spectroscopic and analytical techniques. The obtained product, HEDP-MAX, was identified by NMR spectroscopy. White crystals. Yield: 91%; MP = >300 °C; 1H-NMR (D2O): 0.9 (s, 3H, CH3), 1.22 (t, 3H, CH3CH2), 3.58 (s, 3H, OCH2), 4.88 (s, H_2O), 3.99 (s, 2H, CH2S), 8.27 (s, 1H, NH); 31P-NMR (D2O): 19.76 (2 P; P-OH). IR (νmax, cm-1): 3500 (OH), 2800 - 2900 (NH), 2395 (P-H), 1650 (C = O), 1600 (O = P-O-H), 1250 (C-N), 1100 (CS2), 1140 (P = O).
4.1.1. Nuclear Magnetic Resonance Spectroscopy
1H-NMR (D2O, 400 MHz): The spectrum confirmed the proposed molecular framework. Signals corresponding to aliphatic methyl (δ 0.9 and 1.22 ppm) and methoxy (δ 3.58 ppm) groups were present. A characteristic singlet for methylene protons adjacent to sulfur (δ 3.99 ppm, CH2S) and a broad singlet for an amide/protonated amine proton (δ 8.27 ppm, NH) were observed, confirming the incorporation of sulfur and nitrogen into the structure. The peak at δ 4.88 ppm was attributed to residual water (HOD) in the deuterated solvent.
31P-NMR (D2O, 108 MHz): A single, sharp resonance at δ 19.76 ppm was observed. This signal is definitive for phosphonate groups (-PO32-) and indicates that the two phosphorus atoms in the molecule are chemically equivalent, consistent with a symmetric bisphosphonate core, a crucial feature for effective metal chelation.
4.1.2. Fourier Transform Infrared Spectroscopy
The IR spectrum provided a functional group fingerprint. Key absorptions included a broad band at approximately 3500 cm-1 (O-H/N-H stretch), a P-H stretch at 2395 cm-1, a carbonyl (C = O) stretch at 1650 cm-1, and strong P = O stretching vibrations at 1140 cm-1. Bands corresponding to C-N (1250 cm-1) and C-S (1100 cm-1) stretches further validated the molecular scaffold containing nitrogen and sulfur atoms.
4.1.3. High-Resolution Mass Spectrometry
Electrospray ionization mass spectrometry in negative mode provided definitive proof of the molecular formula and salt form. The spectrum was dominated by multiply charged ions, a hallmark of polyanionic compounds. The doubly charged ion [M-2Na+H]2- observed at m/z 254.9581 and the triply charged ion [M-Na]3- at m/z 163.6262 perfectly matched the theoretical isotopic distribution for C8H_13NNa4O8P2S2. The observed mass accuracy and the pattern of sequential sodium loss confirm the compound's identity as a tetrasodium salt.
4.1.4. Elemental Analysis
The elemental analysis results showed outstanding agreement with the theoretical composition calculated for C8H13NNa4O8P2S2, as summarized below. The minimal deviations for carbon (C), hydrogen (H), nitrogen (N), and sulfur (S) were within the instrumental margin of error, confirming both the proposed molecular formula and a high degree of chemical purity (>98%) of the synthesized ligand.
The convergent data from 1H/31P NMR, FT-IR, HR-MS, and elemental analysis conclusively confirm the successful synthesis of the pure tetrasodium MAX-HEDP ligand with the correct molecular structure. The confirmed presence of the bisphosphonate motif, together with the nitrogen and sulfur donor atoms, validates its design as a suitable chelator for subsequent radiolabeling with rhenium-188 (188Re).
4.2. Quality Control of 188Re-MAX-HEDP
Preparing tin chloride (SnCl
2) and ascorbic acid solutions immediately before labeling is essential to prevent side reactions and increase the yield, because these reagents can degrade under ambient conditions (
27). The radiochemical purity of free
188ReO
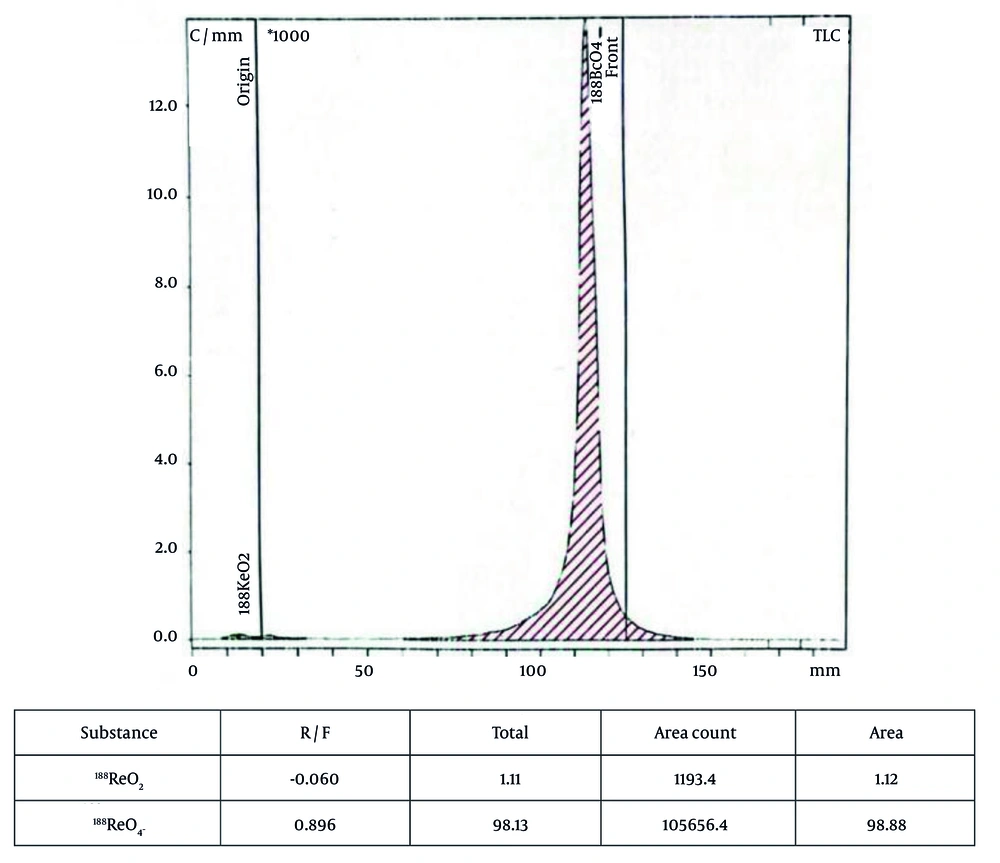
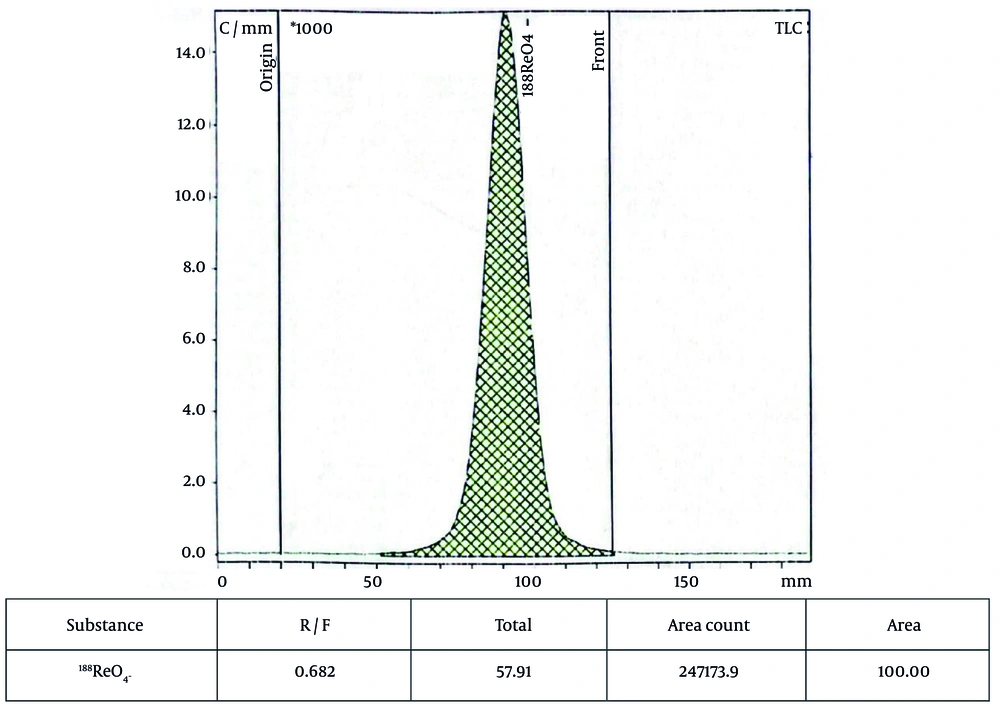
4- in the final product was 0.28% and 0.21% using methanol:acetone and 0.9% saline as the mobile phase, respectively (
Figures 2 and
3). The chromatogram in saline (
Figure 3) showed only free
188ReO
4- without impurities. The radiochemical purity and labeling yield of the
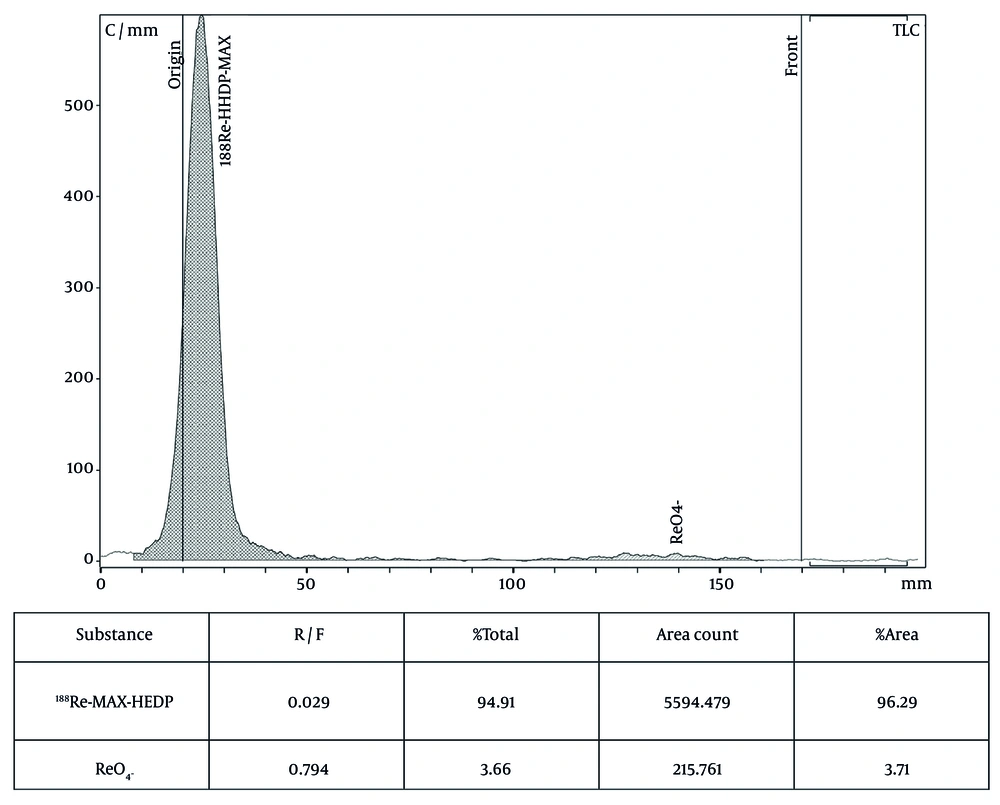
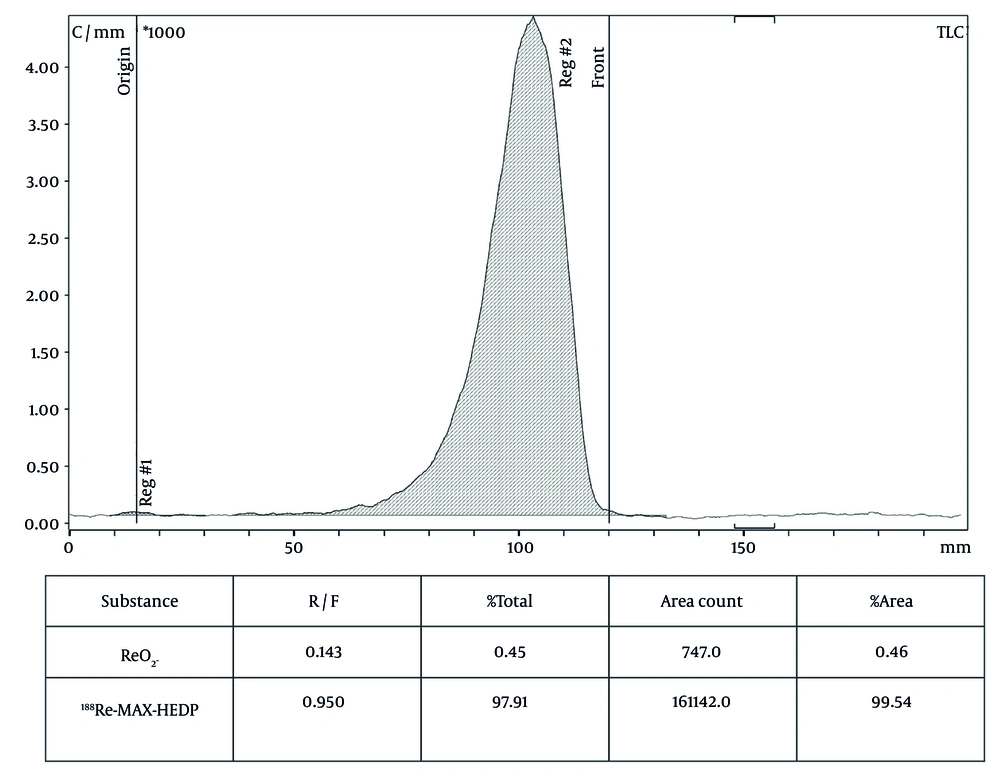
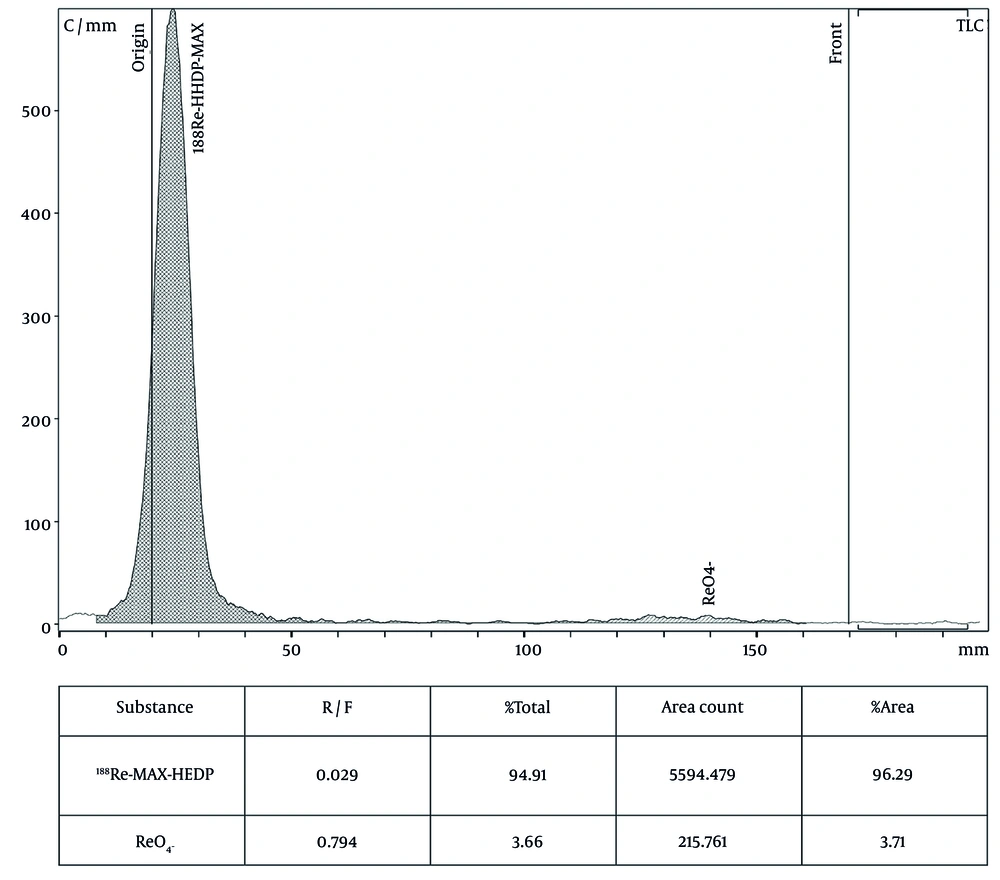
188Re-MAX-HEDP complex were determined by chromatography (1-µL sample, paper, methanol:acetone/saline mobile phase), as shown in
Figures 4 and
5. Finally, the stability of the labeled compound was assessed in human serum to simulate a biologically relevant environment.
Chromatogram and integrated TLC data for free 188ReO4 in methanol:acetone as the mobile phase and Whatman paper as the stationary phase.
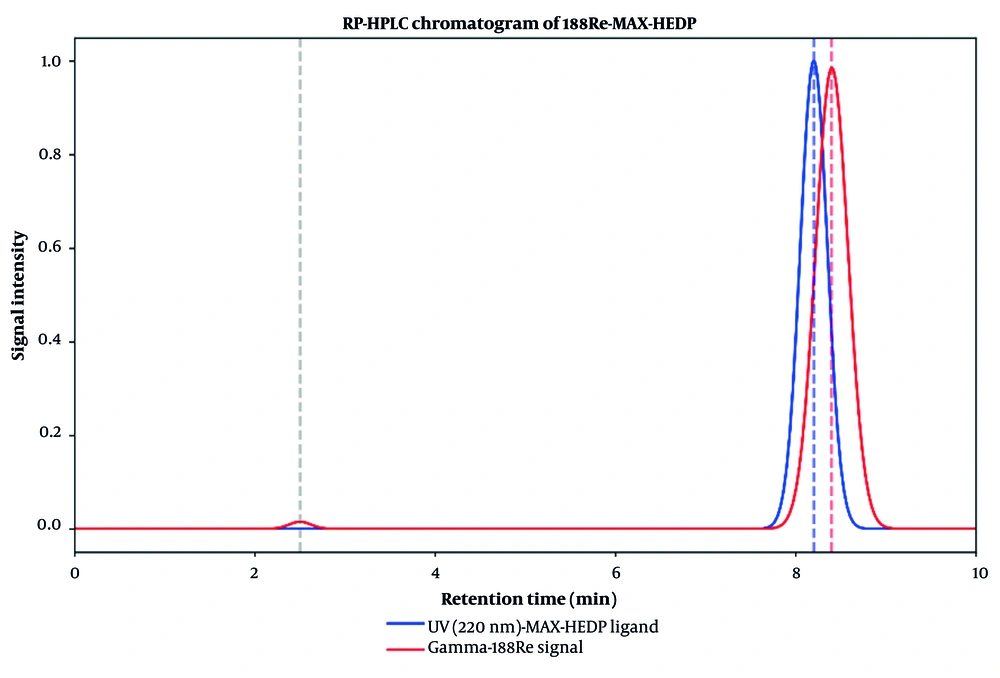
HPLC chromatogram of 188Re-MAX-HEDP.
188Re-MAX-HEDP chromatogram in methanol:acetone solution as the mobile phase and Whatman paper as the stationary phase.
188Re-MAX-HEDP chromatogram in 0.9% saline solution as the mobile phase and Whatman paper as the stationary phase.
4.2.1. HPLC Method Specification for Radiochemical Purity of 188Re-MAX-HEDP
The RP-HPLC chromatographic profile of
188Re-MAX-HEDP, as shown in
Figure 6 and analyzed using dual detection (UV at 220 nm and gamma detection), confirms efficient radiolabeling and high radiochemical purity. The UV chromatogram shows a sharp MAX-HEDP ligand peak at R
t 8.1 - 8.2 minutes, whereas the gamma chromatogram exhibits a dominant co-eluting
188Re-MAX-HEDP peak at R
t 8.3 - 8.5 minutes (major peak at 8.4 minutes). A minor gamma peak at approximately 2.4 - 2.6 minutes corresponds to free perrhenate (
188ReO
4-), indicating only trace unbound radionuclide. The main radiocomplex peak accounts for 98.5 ± 0.5% radiochemical purity, calculated from gamma peak integration, with negligible impurity (<5%). The close overlap between the UV and gamma signals confirms stable complex formation and intact ligand coordination after radiolabeling. System suitability criteria were met, demonstrating good peak shape, baseline stability, and clear separation between the complex and free perrhenate. Overall, these results confirm the successful synthesis of
188Re-MAX-HEDP with high purity and suitability for further biological and preclinical evaluation as a bone-targeting radiopharmaceutical.
HPLC chromatogram of 188Re-MAX-HEDP.
4.3. Labeling Efficiency and Stability Study
The labeling efficiency of
188Re to MAX-HEDP was measured by ascending RTLC using Whatman sheets (Whatman, NJ, USA). RTLC was performed using a 1-µL sample of the final fraction, spotted onto a chromatography paper strip and developed in methanol:acetone and 0.9% saline solutions as the mobile phases. Labeling efficiency was calculated using the following equation (
28):
In the RTLC chromatogram, the horizontal axis (x) represents the advancement rate of each species in millimeters, whereas the vertical axis indicates the count value in millimeters. These measurements were used to derive additional parameters. For instance, the R
f value was determined using the horizontal axis. During the counting process, both the spotting point and the solvent advance point (in millimeters) were identified. Based on these points, the retention factor for each species was calculated and reported as the primary parameter in RTLC. The vertical axis enabled computation of the area under the peak for each separated species by integrating the count value per millimeter. This area was then used to assess the radiochemical purity of the sample. The spectra obtained using each mobile phase are shown in
Figures 2-
6.
4.4. Stability Testing of Radiolabeled 188Re-MAX-HEDP in Human Serum
For the serum stability assessment, 10 mL of human blood was centrifuged at 6000 rpm (4032 relative centrifugal force [RCF], or g-force) for 20 minutes, and 1 mL of serum was collected. Then, 100 µL of
188Re-MAX-HEDP was added to 1 mL of serum and incubated at 37 °C for up to 20 hours. Labeling efficiency and radiochemical purity were assessed.
Figure 7 and the data below illustrate the stability testing under biological conditions and showed excellent results: at room temperature, the compound retained more than 96% integrity, and even at 37 °C, it showed minimal degradation, with less than a 10% reduction.
Stability chromatogram of 188Re-MAX-HEDP after 20 hours. Evaluation of biological stability revealed that the compound remained highly stable, retaining more than 96% integrity under ambient conditions and undergoing less than 10% degradation at 37 °C.
4.5. Biodistribution
The in vivo biodistribution profile of
188Re-MAX-HEDP confirms its effective bone-seeking behavior and favorable pharmacokinetics, supporting its potential as a therapeutic agent for skeletal metastases. As shown in
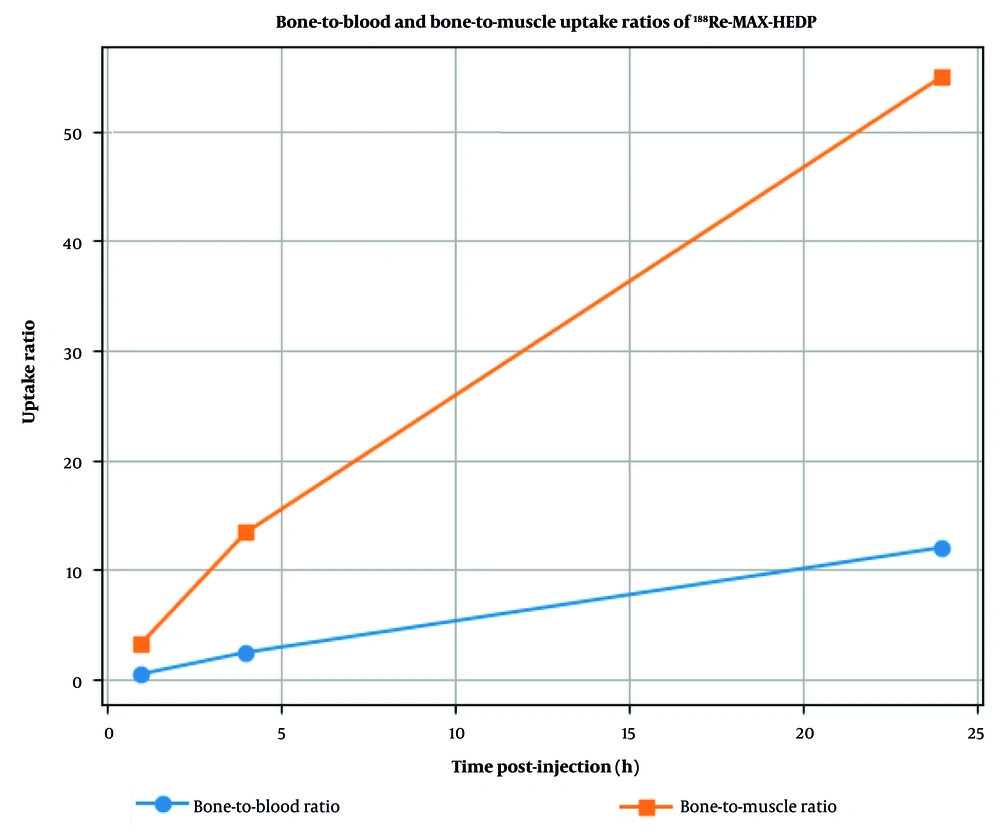
Figure 8, the complex exhibits a characteristic time-dependent pattern of skeletal accumulation. Although initial blood activity is observable at 1 hour postinjection (p.i.), reflecting the circulation phase, rapid clearance from blood and soft tissues occurs. Concurrently, significant and progressive uptake in bone is observed, reaching 2.41 ± 0.36%ID/g at 4 hours and 3.85 ± 0.52%ID/g at 24 hours. This pharmacokinetic profile results in excellent target-to-background ratios, a critical metric for therapeutic efficacy. Both the bone-to-blood and bone-to-muscle uptake ratios increase substantially over time (
Figure 7). The rising bone-to-blood ratio indicates efficient blood clearance and selective retention in bone. Similarly, the increasing bone-to-muscle ratio demonstrates high specificity for osseous tissue over general soft tissue, which is essential for minimizing off-target radiation exposure.
Bone-to-blood and bone-to-muscle uptake ratios of 188Re-MAX-HEDP. The complex exhibits a time-dependent pattern of skeletal accumulation, with early blood-phase activity observed at 1 hour postinjection (p.i.), followed by swift clearance from the vascular compartment and soft tissues.
The biodistribution kinetics of 188Re-MAX-HEDP align with the established profile of bisphosphonate-based radiopharmaceuticals, such as 188Re-HEDP, in which maximal bone uptake is typically achieved several hours after administration. This confirms that integration of the MAX chelator successfully enhances the complex's stability in vivo without impairing the innate affinity of the HEDP moiety for hydroxyapatite, the mineral component of bone.