Although conventional MRI is very useful in the diagnosis of LDD, such as Pfirrmann scale with T2WI (
10), it is useless for assessing early LDD, while ultra-structural alterations are difficult to be identified in T2WI (
11). Therefore, this study aimed to investigate the potential of DWI, DTI and T2* mapping for the detection of microstructural characteristics of early LDD. It has been universally acknowledged that LDD begins at approximately 16 - 20 years old in human beings, and its initiation is caused by physiological degeneration (
1). Based on this background, we designed this original research as a prospective cohort study for assessment of the hypothesis of early LDD, and investigated whether DWI, DTI and T2* mapping could be used to detect minimal changes of early LDD within young healthy adults. The subjects of this study were selected from young asymptomatic college students, and all the subjects were younger than 30 years, which meant they were at the starting stage of intervertebral disc physiology degeneration. Therefore, it was hypothesized that early LDD had already occured in the participants. Finally, we found that DWI, DTI and T2* mapping could act as sensitive and noninvasive methods for quantitative characterization of the biochemical status of NP, while the increase of the mean values of ADC, FA, and T2* of NP could act as imaging markers of early LDD.
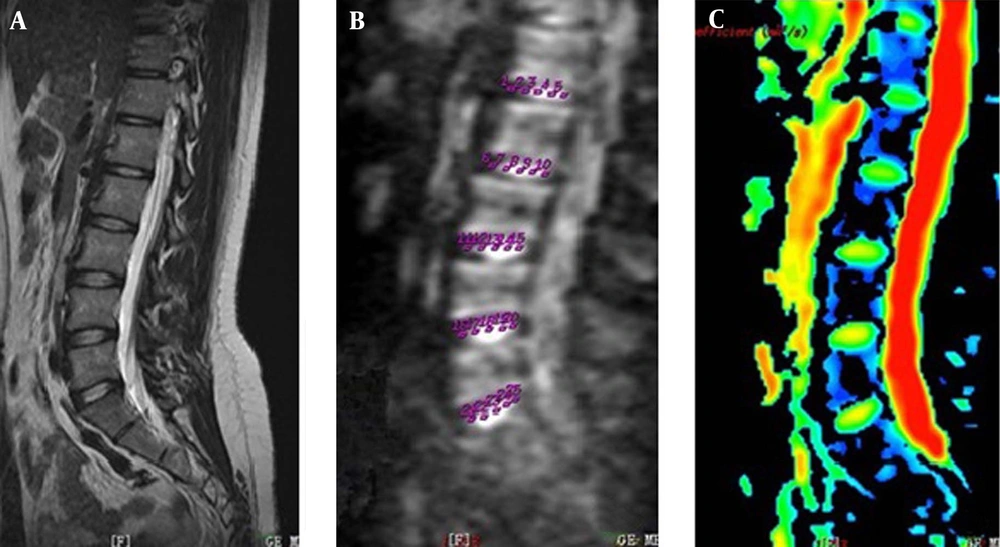
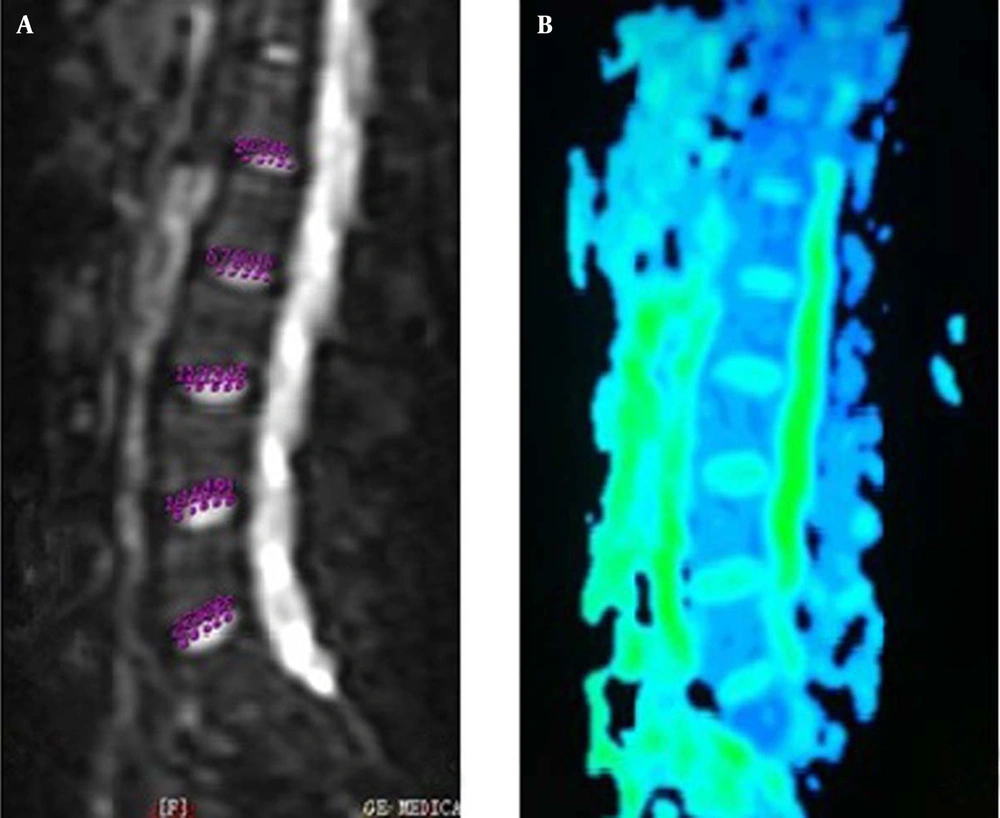
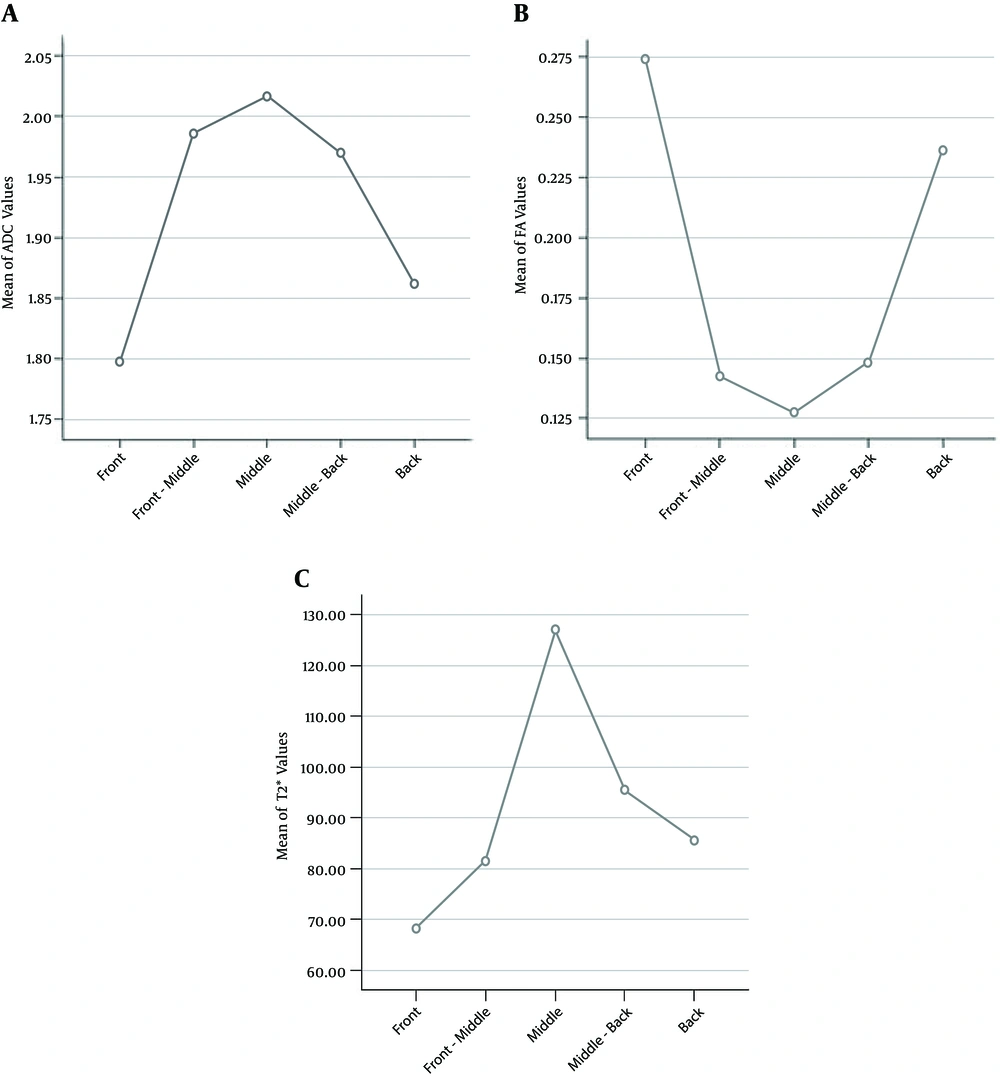
Furthermore, DWI and DTI reflect the microstructural changes of tissue through describing the diffusion of water molecules. The diffusion of water molecules is divided to isotropic and anisotropic types. Isotropic diffusion is proportional to the mean ADC values in each direction; and FA values reflect the proportion of anisotropic diffusion within the total diffusion tensor. Diffusion weighted imaging is used to detect the capacity of water diffusion and generates ADC images for contrast; DTI describes the directional characteristics of water diffusion and produces FA images. In the present study, the differences in the mean ADC and FA values of different ROIs in 200 NPs closely coincided with the biochemical characteristics of NP (
12), i.e. higher contents of PG and water appeared in the NP center (high ADC values and low FA values in the middle, see
Figure 4), and water content gradually declined and collagen fibers increased in the periphery (low ADC values and high FA values in the periphery, see
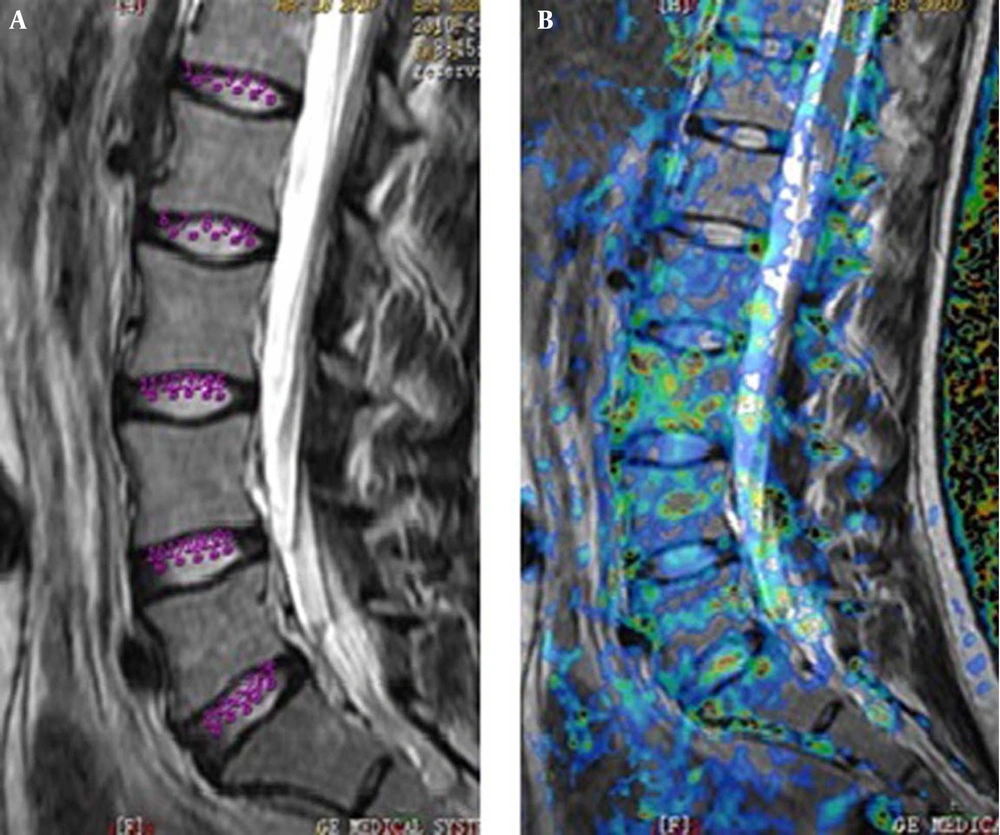
Figure 4), suggesting that ADC and FA values can be used to effectively monitor the activity of water molecules in NP. T2* mapping of intervetebral discs is a relatively new technique. T2 mapping of NP correlates well with microstructural variations in PG, water content and collagen (
7,
13); T2* mapping is based on T2 mapping with a clearer imaging contrast and a higher signal-to-noise ratio (SNR) (
14,
15). In this study, T2* mapping was applied to detect biochemical changes of NP. Our results showed that T2* values changed among different ROIs (
Table 3) which were consistent with DWI and DTI image information, i.e. higher water content in the center, and lower water content yet higher content of collagen fibers in the periphery. Obviously, DWI, DTI, and T2* mapping can validate each other for reflecting the characteristics of biochemical composition.
Some researchers have already used DWI to study LDD. Kealey et al. (
16) contrasted normal and degenerated discs using DWI and showed that the ADC values of degenerated discs were reduced by 9% as compared with those of normal discs. The study of Wu et al. (
17) also showed that the ADC values of degenerated discs were significantly reduced, and the ADC values of lower lumbar discs were less than those of the upper discs. However, our study results revealed that differences existed among the ADC values of corresponding ROI at different levels (
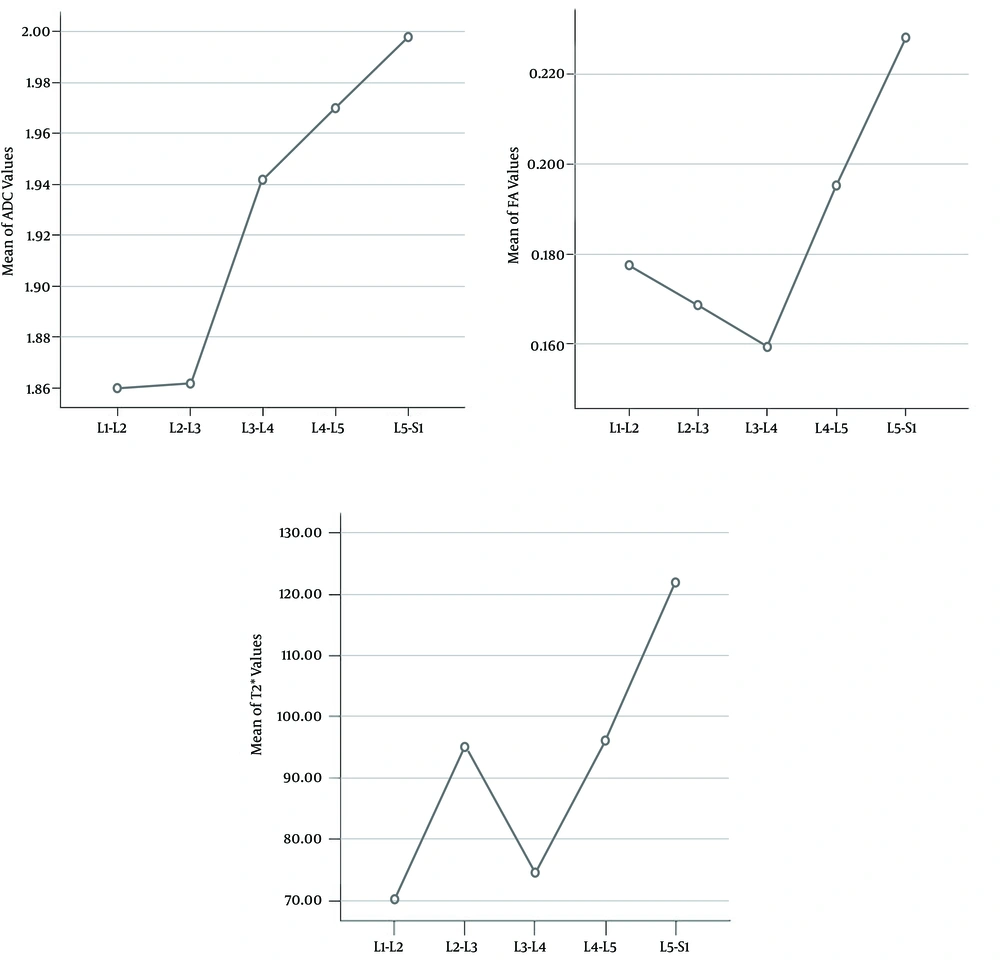
Table 1), mostly manifesting as a gradual increase of ADC values with the lowering of anatomical location, and that the mean ADC values of lower discs were significantly elevated when compared with those of upper discs (
Figure 5). Our analysis suggested that increased ADC values might indicate early LDD, which was in contradiction with the results of Kealey (
16) and Wu (
17). Such inconsistency may be due to differences amongst the study subjects. The subjects of Kealey et al. (
16) were elder patients with severe LDD, while the subjects of our study were young healthy adults, which may have had early LDD. The initiating factors of early LDD are the regression of PG and the destruction of collagen cross-linking in NP (
10,
18). Especially with PG degradation, the bound water molecules will be released, and lead to an increase of free water volume, which hence enhances the capacity of water diffusion, giving rise to an increase in ADC and T2* values. With the development of LDD, the water content of NP decreased gradually, and thus the ADC value was accompanied by this decrease (
16,
17). Therefore, our results seemed to be in contradiction with previous studies. Our results showed that the increases of ADC values at corresponding ROIs in different planes might indicate the occurrence of early degeneration, and it is the same reason that T2* values also increased in the lower lumbar discs (
Tables 1 -
3). Based on the mutual corroboration between DWI and T2* mapping, we suggest that the above results could be explained by the biochemical changes during early LDD. In addition, a study on early degeneration of articular cartilage showed that the reduction of PG might cause an increase in T2 values and elevated T2 values may reflect the decrease in PG concentration; these results were supported by histological evidence (
19). The increased T2* values in our study might thus indicate PG content loss in NP and the occurrence of early degeneration. With regards to FA values, degenerative matrix alterations and the disruption of the collagen network in NP led to an increase in anisotropic water diffusion during early LDD (
18), and thus elevated FA values could be obtained by using DTI. In this study, differences existed among the FA values at corresponding ROIs in different planes (
Table 2), and the increases of mean FA values from L1-L2 to L5-S1 were considered to reflect LDD (
Figure 5). The results of Zhang et al. (
11) also indicated that increased FA values were correlated with LDD, and these results were consistent with that of our study. Therefore, FA values may quantitatively assess disc degeneration, and an increase in FA values may be a sign of LDD. Moreover, the comprehensive analysis of the present study indicated that the mean ADC, FA and T2* values of lower discs (L4-L5 and L5-S1) were accompanied by a synchronized increase (
Figure 5), and all three indices indicated early LDD, thus suggesting that the study results were objective and accurate. Regarding the biomechanics point of view, lower lumbar discs suffer from a higher probability of degeneration under the influence of higher mechanical stress, thus, L4-L5 and L5-S1 were more susceptible to degeneration (
20). Therefore, the mean ADC, FA and T2* values of L4-L5 and L5-S1 were higher than upper discs, and the study of Kealey et al. (
16) also stated that the degree of lower discs degeneration was more significant than cephalic discs.
It is important to mention that the limitation of our study was the lack of histological evidence and control group for comparing the results.
In our study, it was hypothesized that all the subjects were at the initial stage of intervertebral disc physiology degeneration while the microstructural changes were not detected in conventional MRI (
1,
11), however, we could evaluate the biochemical changes of early LDD by using DWI, DTI, and T2* mapping, moreover, lower discs L4-L5 and L5-S1 were more prone to degeneration, therefore,
we believe that early LDD should probably occur at L4-L5 and L5-S1 discs. Therefore, L4-L5 and L5-S1 discs may be used as parameters of degeneration for assessment. Despite all the rhetoric results, such speculations surely warrant further investigations. Furthermore, there were still other factors of influence, such as activity, mechanical stress, disc size, etc. Thus, there should be a separate measurement for LDD.
In conclusion, although the study results need further histological verifications, they still clearly demonstrated that DWI, DTI and T2* mapping could prospectively act as sensitive tools to detect microstructural changes of early LDD, respectively, and that a combination of the above three indices can enhance the accuracy of imaging diagnosis.