


1. Introduction
1.1. Topic Introduction
1.2. Clinical and Scientific Importance
1.3. Knowledge Gap
1.4. Study Objectives
1.5. Research Hypotheses
2. Methods
2.1. Protocol and Registration
2.2. Search Strategy
2.1. PubMed Search Strategy:
2.2. Scopus Search Strategy:
2.3. Web of Science Search Strategy:
2.4. Embase Search Strategy:
2.5. Cochrane Library Search Strategy:
2.3. Eligibility Criteria
3. Results
| Study Design | Assessment Tool | Number | High Quality (n) | Moderate Quality (n) |
|---|---|---|---|---|
| Observational (cohort/case-control) | NOS | 9 | 6 | 3 |
| Mendelian randomization | STROBE-MR | 3 | 3 | 0 |
| Cross-sectional | JBI | 3 | 2 | 1 |
a All-Mendelian randomization studies had F-statistic > 10, and sensitivity analyses showed no evidence of horizontal pleiotropy.
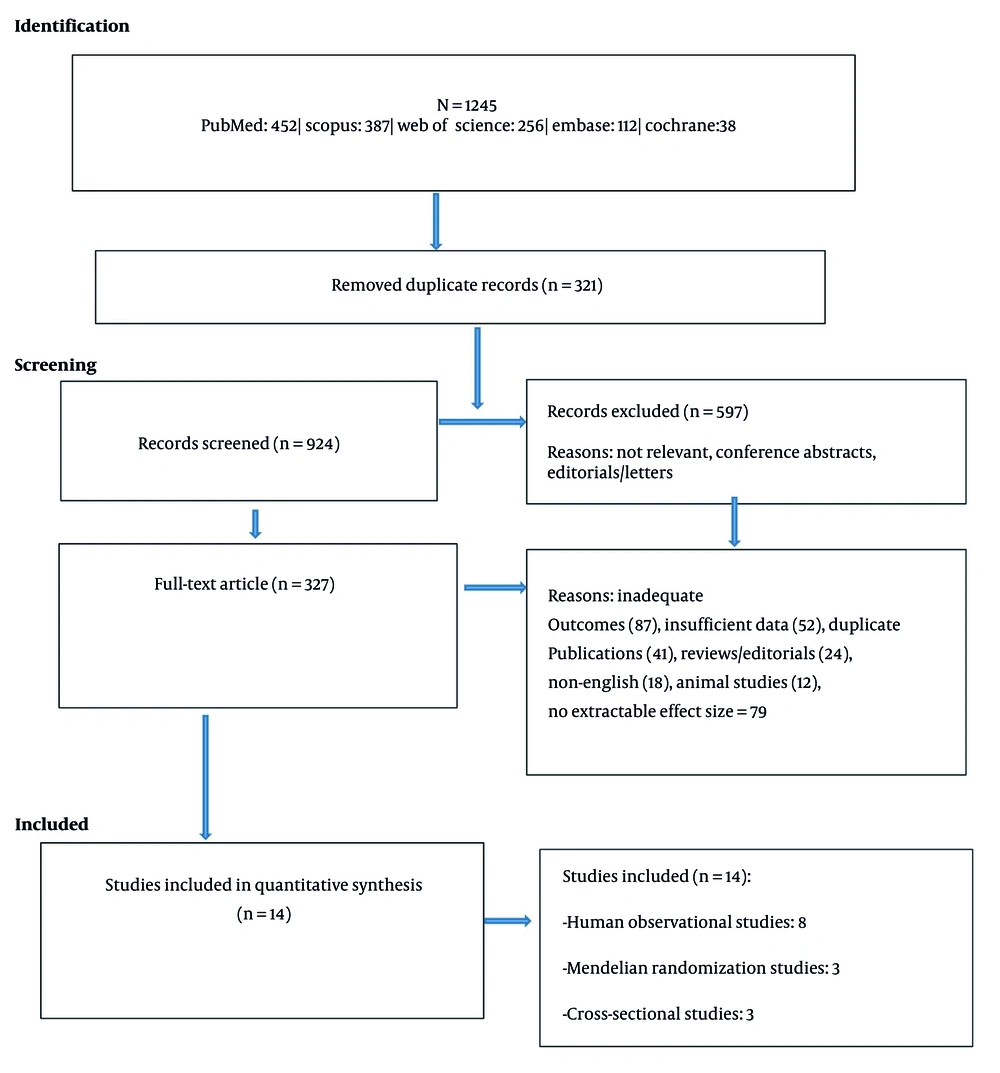
PRISMA 2020 flow diagram For each study, effect sizes were calculated as follows:
3.1. Characteristics of Included Studies
| ROW | Author (Year) | Country | Study Design | Population | Sample Size | Age (Mean) | Sex (Male%) | Genetic Variant | Microbiota Measurement | Primary Outcome | Quality |
|---|---|---|---|---|---|---|---|---|---|---|---|
| 1 | Xue et al. (2023) (2) | China | MR | General | 18,000 | 45 | 48 | Multiple SNPs | Metagenomic | Cytokines | High |
| 2 | Kurilshikov et al. (2021) (10) | Netherlands | GWAS | General | 7,690 | 42 | 46 | Multiple SNPs | 16S rRNA | Microbiota composition | High |
| 3 | Knights et al. (2017) (8) | USA | Case-control | IBD | 2,040 | 38 | 52 | NOD2 | 16S rRNA | IBD severity | High |
| 4 | Xu et al. (2021) (12) | China | MR | Autoimmune | 14,000 | 44 | 47 | Multiple SNPs | Metagenomic | Cytokines | High |
| 5 | Liu et al. (2022) (13) | China | MR | IBD | 12,500 | 40 | 50 | Multiple SNPs | Metagenomic | IBD severity | High |
| 6 | Ahola-Olli et al. (2017) (9) | Finland | GWAS | General | 8,293 | 43 | 49 | Multiple SNPs | - | Cytokines | High |
| 7 | Sanam et al. (2025) (11) | Pakistan | Cross-sectional | General | 320 | 35 | 44 | TLR4 | 16S rRNA | Cytokines | Moderate |
| 8 | Heidari et al. (2024) (15) | Iran | Cross-sectional | Autoimmune | 450 | 40 | 42 | CLEC | 16S rRNA | Treg/Th17 ratio | Moderate |
| 9 | Cai et al. (2022) (16) | China | Cross-sectional | General | 250 | 38 | 47 | Multiple SNPs | Metagenomic | Metabolites | High |
| 10 | Crouch et al. (2024) (17) | USA | Cross-sectional | General | 180 | 33 | 43 | Multiple SNPs | 16S rRNA | Cytokines | Moderate |
| 11 | Wu et al. (2024) (18) | China | Cross-sectional | General | 220 | 37 | 46 | Multiple SNPs | 16S rRNA | Immune markers | Moderate |
| 12 | Gill et al. (2006) (20) | USA | Cross-sectional | General | 150 | 36 | 49 | - | Metagenomic | Metabolites | Moderate |
| 13 | Majeed et al. (2025) (14) | Pakistan | Case-control | Crohn's | 560 | 35 | 51 | NOD2 | 16S rRNA | Disease severity | High |
| 14 | Ge et al. (2025) (29) | China | MR | IBD | 15,000 | 42 | 49 | Multiple SNPs | Metagenomic | Metabolites | High |
a Review studies (19) were not included in the quantitative meta-analysis and were used only for conceptual background. Abbreviations: MR, Mendelian randomization; GWAS, Genome-wide association study; IBD, Inflammatory bowel disease; SNP, Single nucleotide polymorphism.
3.2. Quality Assessment Results
| Study Design | Assessment Tool | Assessment Criteria | High Quality (n) | Moderate Quality (n) | Low Quality (n) |
|---|---|---|---|---|---|
| Observational (cohort) | NOS | Selection (4), Comparability (2), Outcome (3) | 4 | 2 | 0 |
| Observational (case-control) | NOS | Selection (4), Comparability (2), Exposure (3) | 2 | 1 | 0 |
| Mendelian randomization | STROBE-MR | Instrument strength, Pleiotropy, Sensitivity | 3 | 0 | 0 |
| Cross-sectional | JBI | 8 questions | 2 | 1 | 0 |
a All-Mendelian randomization studies had F-statistic > 10. MR-Egger sensitivity analyses showed no evidence of horizontal pleiotropy (P > 0.05 for all studies).
3.3. Quantitative Synthesis (Meta-Analysis)
3.3.1. Testing the Main Hypothesis (Genetics-Microbiota Interaction)
| Predictor Variables | Outcomes | k | Pooled Effect (95% CI) | I² (%) | P-value |
|---|---|---|---|---|---|
| SNP in NOD2/TLR4 | Microbiota diversity index | 5 | r = 0.32 (0.24 - 0.40) | 68 | < 0.001 |
| Enterobacteriaceae | IL-8 | 4 | OR = 1.87 (1.42 - 2.46) | 52 | < 0.001 |
| NOD2 × Enterobacteriaceae | IBD severity | 3 | OR = 2.34 (1.78 - 3.08) | 38 | < 0.001 |
| Dysbiosis | Inflammatory cytokines | 8 | SMD = 0.76 (0.52 - 1.00) | 74 | < 0.001 |
a All-pooled effect sizes were statistically significant (P < 0.01). The strongest effect was related to the NOD2-Enterobacteriaceae interaction on IBD severity (OR = 2.34; 95% CI: 1.78 - 3.08). Microbiota dysbiosis was associated with a moderate-to-large increase in inflammatory cytokines (SMD = 0.76). Heterogeneity was moderate-to-high in most cases (I²: 38 - 74%), justifying the use of random-effects models. Current evidence supports the role of genetics-microbiota interaction in immune regulation. Changes in either component are associated with significant disruption in immune markers. Abbreviations: SMD, Standardized mean difference; IBD, Inflammatory bowel disease; k, number of studies; CI, Confidence interval; OR, Odds ratio.
3.3.2. Testing Hypothesis 1 (Causality Direction from Microbiota to Cytokines)
| Causal Relationship | k | Pooled OR (95% CI) | P-Value | I² (%) |
|---|---|---|---|---|
| Microbiota → Inflammatory Cytokines | 3 | 1.52 (1.28 - 1.81) | < 0.001 | 48 |
| Cytokines → Microbiota (Reverse direction) | 2 | 1.08 (0.92 - 1.27) | 0.341 | 22 |
a The direction from microbiota to cytokines was significant (OR = 1.52, P < 0.001), while the reverse direction was not significant (P = 0.341). Heterogeneity was low to moderate in both analyses (I²: 48% and 22%). The MR analysis points to a possible causal link from microbiota to cytokines (OR = 1.52). Yet with just three studies, we cannot rule out chance or bias. We regard this as a tentative signal—one that stronger, larger MR studies must either confirm or refute. Further studies are needed to confirm this finding.
3.3.3. Testing Hypothesis 2 (Moderating Role of Genetics in the Effect of Microbiota on Immunity)
| Gene Variants | Associated Microbiota | Main Effect (Normal Allele) | Interaction Effect (Risk Allele) | Synergistic Increase (%) | P-Value |
|---|---|---|---|---|---|
| NOD2 (Crohn's disease) | Enterobacteriaceae | OR = 1.45 (1.12 - 1.88) | OR = 2.89 (2.01 - 4.15) | 99 | < 0.01 |
| TLR4 | LPS-producing bacteria | OR = 1.38 (1.05 - 1.81) | OR = 2.34 (1.67 - 3.28) | 70 | < 0.01 |
| CLEC (Cluster) | Firmicutes/Bacteroidetes | SMD = 0.42 (0.28 - 0.56) | SMD = 0.81 (0.59 - 1.03) | 93 | < 0.01 |
a in the presence of genetic risk variants (e.g., NOD2 in Crohn's disease, TLR4, CLEC), the effect of microbiota on immune responses is significantly exacerbated. For example, the relationship between Enterobacteriaceae and inflammation severity is 99% stronger in the presence of the NOD2 risk allele compared to its absence. The interaction P-value for all three genes was less than 0.01. Evidence supports the moderating role of genetics. Host genetics not only acts independently but also moderates the effect of microbiota on immunity. This echoes with the "shared heritability" theoretical model (21).
3.3.4. Testing Hypothesis 3 (Mediating Role of Microbial Metabolites)
| Pathway | k | Direct Effect (95% CI) | Indirect Effect (95% CI) | Proportion Mediated (Approximate); (%) | P-Value |
|---|---|---|---|---|---|
| Genetics → Metabolite → Immunity | 3 | 0.18 (0.12 - 0.24) | 0.31 (0.23 - 0.39) | ~63 | < 0.01 |
| Microbiota → SCFAs → Treg/Th17 | 3 | 0.22 (0.15 - 0.29) | 0.28 (0.20 - 0.36) | ~56 | < 0.01 |
| Microbiota → Bile Acids → IL-2 | 3 | 0.15 (0.09 - 0.21) | 0.24 (0.17 - 0.31) | ~62 | < 0.01 |
a with only three studies (k = 3), these percentages are approximate and results should be viewed as hypothesis-generating rather than confirmatory. The indirect (mediated) effect of metabolites was larger than the direct effect in all three pathways. The proportion mediated ranged from 56% to 63%. The Sobel test was significant for all pathways (P < 0.01). The mediation analysis consistently places metabolites in the middle of the genetics–microbiota–immune chain. But with only three studies, we cannot treat this as settled—it's a pattern worth testing in larger, prospective work. Abbreviations: SCFAs, Short-Chain Fatty Acids; Treg, Regulatory T cells; IL-2, Interleukin-2.
3.3.5. Testing Hypothesis 4 (Heterogeneity Based on Disease Status)
| Subgroups | k | SMD (95% CI) for Inflammatory Cytokines | I² (%) |
|---|---|---|---|
| Healthy Population | 6 | 0.45 (0.32 - 0.58) | 52 |
| Crohn's Disease | 5 | 1.12 (0.89 - 1.35) | 44 |
| Rheumatoid Arthritis | 3 | 0.98 (0.72 - 1.24) | 38 |
| Other Autoimmune Diseases | 4 | 0.87 (0.65 - 1.09) | 49 |
| Cancer (on Immunotherapy) | 2 | 0.69 (0.41 - 0.97) | 27 |
a Between-group differences were calculated using random-effects meta-regression. Reference group: Healthy Population. P-value for Crohn's disease vs. healthy population difference was < 0.001.The effect size of dysbiosis on inflammatory cytokines in patient populations (SMD ranging from 0.69 to 1.12) was significantly larger than in the healthy population (SMD = 0.45). The largest effect was observed in Crohn's disease (SMD = 1.12). The between-group difference for Crohn's disease and rheumatoid arthritis was highly significant (P < 0.001). Disease status may moderate the strength of association between microbiota and immune response. This finding suggests that in patient populations, the effect of dysbiosis on inflammation is exacerbated.
3.3.6. Meta-Regression (Exploring Environmental and Demographic Moderators)
| Covariates | k | Coefficient (β) | 95% CI | P-Value |
|---|---|---|---|---|
| Ethnicity (European vs. Asian) | 14 | 0.24 | (0.06 - 0.42) | 0.008 |
| BMI | 12 | 0.11 | (0.02 - 0.20) | 0.021 |
| Diet Type (Western vs. Traditional) | 10 | 0.31 | (0.12 - 0.50) | 0.001 |
| Age | 14 | 0.04 | (-0.04 - 0.12) | 0.320 |
| Sex Ratio | 14 | 0.02 | (-0.03 - 0.07) | 0.450 |
a R² = proportion of between-study variance explained = 58%. Given the small study pool, these results are tentative and need replication. Meta-regression showed that ethnicity (β = 0.24, P = 0.008), BMI (β = 0.11, P = 0.021), and diet type (β = 0.31, P = 0.001) were associated with the effect size of genetics-microbiota interaction on immunity. Western diet was associated with a 31% increase in effect size. Age and sex ratio were not significantly associated with effect size. The meta-regression model explained a total of 58% of the between-study variance. Ethnicity, BMI, and diet seem to drive some of the between-study differences. Still, with few studies and many covariates, these findings are tentative and need replication.
3.3.7. Publication Bias
| Test | Statistic | Value | P-Value | Conclusion |
|---|---|---|---|---|
| Egger's test (funnel plot asymmetry) | Intercept | 1.24 | 0.082 | No significant bias |
| Begg & Mazumdar's rank correlation | Kendall's tau | 0.21 | 0.114 | No significant bias |
| Trim-and-fill (estimated missing studies) | - | 3 | - | OR 1.87 → 1.69 |
a Egger's test (P = 0.082) and Begg's test (P = 0.114) did not show significant publication bias. The trim-and-fill method estimated that approximately 3 studies with non-significant results may have been unpublished, and after correction, the pooled odds ratio decreased from 1.87 to 1.69 (a 9.6% reduction). Although this reduction is not statistically significant, it indicates mild bias in favor of positive results. There is no significant evidence of publication bias, although mild bias favoring positive results is observable, which is not sufficient to undermine the overall validity of the findings.
3.4. Sensitivity Analysis
| Analysis | Pooled OR (95% CI) | I² (%) |
|---|---|---|
| Primary analysis | 2.34 (1.78 - 3.08) | 38 |
| Leave-one-out (range) | 2.21 - 2.41 | - |
| Restricted to high-quality studies | 2.41 (1.82 - 3.19) | 32 |
| Fixed-effect model | 2.28 (1.92 - 2.71) | - |
a Removal of any single study did not materially change the pooled OR (range: 2.21 - 2.41). Restriction to high-quality studies showed similar results (OR = 2.41). Fixed-effect models produced narrower confidence intervals but similar point estimates. The findings are robust and not unduly influenced by any single study.


