
1. Background
The bioindustry ropivacaine hydrochloride contains the effective ingredient ropivacaine hydrochloride, which belongs to a group of drugs called local anesthetics. Local anesthetics are used to numb a part of the body (1). Ropivacaine 7.5 mg/mL and 10 mg/mL are used in adults and children 12 years of age and older to numb parts of the body during surgery (2, 3). The effect and duration of ropivacaine depend on the treatment, and vasoconstrictors such as adrenaline do not affect it. This drug can be prescribed for an epidural block, a peripheral nerve block, and anesthesia. High doses of this drug are used for surgical anesthesia, and lower doses are used to relieve acute pain, such as labor pain and pain after surgery (4).
A significant topic in studies is the physical interaction of proteins that leads to their compilation in large interconnected networks. Protein interaction networks are useful for improving biological and biomedical applications due to the creation of basic scientific abstractions. Based on the central role of proteins in biological function, their interactions determine the molecular and cellular mechanisms that control healthy and disease states in organisms (5).
Therapeutic cells are a promising treatment for destructive musculoskeletal problems due to the nutritional, mitotic, and immune-modulating capacity of mesenchymal stem cells (MSCs). Local anesthesia is usually used for pain relief in interventional approaches, but local anesthesia may have a negative effect on MSCs' function (6).
Using new technologies, determination of gene profile, including methods based on sequencing, microarray, bioinformatics, and their analysis to identify biomarkers, is possible. The vital genetics involved in the development of drug resistance can be used for prognosis and predicting the outcome of treatment. Specific and more efficient treatment protocols will be useful (7). Identifying the signaling pathways of protein and regulatory networks involved in the occurrence of drug resistance, in addition to finding altered genes and predicting factors of treatment outcome, plays an effective role in choosing the optimal treatment method (8).
Today, the use of systems biology will be helpful, considering that the life and functioning of each cell depend on the molecular interactions within cells and the communication of different biological networks (9). Advances in the field of genomics and proteomics will help researchers in choosing the best treatment method for each patient (10).
2. Objectives
This research aims to find the altered genes following the use of ropivacaine in the treatment of MSCs (11), to screen the altered genes using bioinformatics methods, to find pathways and molecular events related to the key elements of the altered expression, and finally, to assess the feasibility of changing the protocol. Therefore, the primary purpose of the current study was to identify key targets and molecular mechanisms involved in ropivacaine exposure in MSCs using an integrated gene expression analysis and protein network-based approach. Particularly, we aimed to recognize differentially expressed genes (DEGs), specify central nodes through protein interaction network analysis, and decipher enriched functional links to present systems-level information.
3. Methods
3.1. Data Collection
The Gene Expression Omnibus (GEO) dataset GSE31827, consisting of four ropivacaine-treated samples (100 µM) and four untreated control samples of bone marrow MSCs, strain C57B6/J, was selected from the GEO database (11).
3.2. Data Pre-evaluation
Gene expression profiles of the treated cells versus controls were assessed via the GEO2R program. A volcano plot was applied to visualize the significant DEGs. The separation of treated samples from controls was evaluated using Uniform Manifold Approximation and Projection (UMAP) analysis. A Venn diagram was applied to identify the dysregulated genes.
3.3. Network Analysis
The significant DEGs were decoded and assessed via “Protein query” of the STRING database by Cytoscape software v 3.7.2. The protein-protein interaction (PPI) network was analyzed via the “Network analyzer” application of Cytoscape software to find the hubs and bottleneck nodes. Regulatory relationships between elements of the main connected component were evaluated using an action map by CulePedia v1.5.7. The significant DEGs were enriched via gene ontology by ClueGO v 2.5.7 to explore the relative biological processes. The biological processes were extracted from “GO_BiologicalProcess-EBI-UniProt-GOA-ACAP-ARAP_08.05.2020_00h00” source.
3.4. Statistical Analysis
The significant DEGs were identified based on adjusted P-value (Padj) < 0.05 and fold change > 1.1. The PPI network was constructed based on a confidence score = 0.1. The gene ontology terms were identified in view of term P-value, term P-value corrected with Bonferroni step down, group P-value, and group P-value corrected with Bonferroni step down less than 0.05. The kappa score threshold was set to 0.4. Medium “Network specificity” was applied. Merged redundant groups with > 50% overlap were considered.
4. Results
To visualize the significant DEGs that differentiate the treated cells from controls, a volcano plot was provided (Figure 1). As depicted in Figure 1, there are considerable numbers of significant DEGs that separate the treated samples from controls. UMAP analysis confirms the results of volcano plot assessment (Figure 2). As depicted in Figure 3, among 17521 dysregulated genes, there are 71 significant DEGs. A total of 70 significant DEGs were decoded and included in the STRING database to create a PPI network.

Figure 1.
Volcano plot for compared gene expression profiles of treated mesenchymal stem cells (MSCs) versus controls

Figure 2.
Uniform manifold approximation and projection of the compared gene expression profiles of treated mesenchymal stem cells (MSCs) versus controls

Figure 3.
Venn diagram for compared gene expression profiles of treated mesenchymal stem cells (MSCs) versus controls; adjusted P-value < 0.05
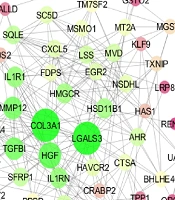
Among the 70 significant DEGs (Appendix 1 in Supplementary File), 63 individuals were recognized by the STRING database (Appendix 2 in Supplementary File) and the PPI network, including a pair of DEGs, and a main connected component of 61 nodes and 254 edges was constructed. The main connected component of the PPI network, which is layout-based on degree value, is shown in Figure 4. To find the central DEGs, the top 10% of nodes based on degree value and betweenness centrality were introduced as hubs and bottlenecks, respectively (Table 1). The common hubs and bottlenecks were identified as hub-bottlenecks. The action map for the elements of the main connected component is shown in Figure 5. A total of 20 significant DEGs appear in the action map. Activation, inhibition, expression, reaction, and catalysis are the relationships between the assessed DEGs.

Figure 4.
The main connected component of the protein-protein interaction (PPI) network includes 61 nodes and 254 undirected edges. Nodes are layout based on degree value
Table 1.
List of Central Differentially Expressed Genes of the Protein-Protein Interaction Network
| No. | Display Name | Degree | Betweenness Centrality | Centrality |
|---|---|---|---|---|
| 1 | COL3A1 | 23 | 0.146 | Hub-bottleneck |
| 2 | LGALS3 | 23 | 0.130 | Hub-bottleneck |
| 3 | HGF | 19 | 0.071 | Hub-bottleneck |
| 4 | MMP12 | 17 | 0.040 | Hub |
| 5 | TGFBI | 17 | 0.069 | Hub |
| 6 | IL1R1 | 15 | 0.028 | Hub |
| 7 | HSD11B1 | 14 | 0.104 | Bottleneck |
| 8 | GRN | 11 | 0.083 | Bottleneck |
| 9 | CTSA | 9 | 0.070 | Bottleneck |

Figure 5.
Action map of the elements of the main connected component; green, red, yellow, black, and purple refer to activation, inhibition, expression, reaction, and catalysis
Gene ontology enrichment revealed that 31 biological processes are related to the elements of the main connected component. The biological processes were grouped into 10 clusters. The cholesterol biosynthetic process, including 15 biological processes, appeared as the main biological process cluster (Figure 6 and Figure 7).

Figure 6.
Results of gene ontology assessment; the associated genes are labeled in red

Figure 7.
Percentage of terms per group for the 10 clusters of biological processes
5. Discussion
Pre-evaluation analysis showed 71 significant DEGs separate the treated MSCs with 100 µM ropivacaine from control cells. Based on the investigation of Lucchinetti et al., 100 µM concentration and higher concentrations of ropivacaine inhibit cell proliferation in MSCs (11). Yan et al. published a document about the regulation of heme oxygenase-1 function and expression by ropivacaine (12). Wang and Li's investigation indicates that ropivacaine plays a role in the inhibition of proliferation and migration of colorectal cancer cells via ITGB1 (13). Compared to previous studies that investigated single molecular targets of ropivacaine, results of this integrated analysis highlight network-based information, indicating that changes in lipid and cholesterol-associated pathways may underlie the observed antiproliferative and functional effects.
To explore critical targets of ropivacaine, nine central genes, including COL3A1, LGALS3, HGF, MMP12, TGFBI, IL1R1, HSD11B1, GRN, and CTSA, were introduced via PPI network analysis. As shown in Figure 5, five central DEGs were presented in the action map. It can be concluded that the critical roles of the central DEGs were confirmed by action map analysis. Although action map analysis provided valuable insights into the regulatory relationships between a subset of the core genes, it should be noted that confirmed interactions were observed for only a limited number of these core nodes. This limitation reflects the support of this analysis on molecular interactions that have been previously published and are now found in public databases, not meaning a lack of functional interaction for other genes.
The potent central gene is collagen, type III, alpha 1 (COL3A1), which is an upregulated DEG. COL3A1, as an important gene, is essential for normal brain development (14). As shown in Figure 6, this gene is involved in collagen fibril organization. It is reported that upregulation of COL3A1 is associated with radiation of breast cancer cells (15).
The second hub-bottleneck gene is lectin, galactose binding, soluble 3 (LGALS3), which is downregulated by ropivacaine. As depicted in Figure 6, this gene is associated with the “Regulation of extrinsic apoptotic signaling pathway via death domain receptors” cluster of biological processes. Fermino et al. showed lack of galectin-3 upsurges Jagged1/Notch activation in bone marrow-derived dendritic cells and is accompanied by dysregulation of T helper cell polarization (16).
Hepatocyte growth factor (HGF) is the third central gene that is involved in two clusters of biological processes. This gene is upregulated by ropivacaine. It is reported that upregulation of HGF is associated with angiogenesis and the development of metastasis (17, 18).
Matrix metallopeptidase 12 (MMP12) is a downregulated hub of ropivacaine effect. Possible effect of ropivacaine on the reduction of matrix metallopeptidases activities is reported by researchers (19). Involvement of MMP12 in the “Negative regulation of innate immune response” cluster of biological processes is presented in Figure 6.
Transforming growth factor, beta induced (TGFBI) is another upregulated hub gene. The role of TGFBI in the promotion of breast cancer metastasis has been reported by researchers (20).
IL1R1 is the last hub gene. The relationship between IL1R1 level and intestinal damage is reported by Cox et al. (21).
Hydroxysteroid 11-beta dehydrogenase 1 (HSD11B1) is a downregulated bottleneck in response to ropivacaine. As shown in Figure 6, HSD11B1 is connected to the “Cholesterol biosynthetic process”. This cluster, as the main group, includes 48.39% of biological processes (Figure 7). Gene ontology analysis revealed cholesterol biosynthesis processes as the dominant process in the function of the central elements of the network. These results are biologically significant, given previous reports indicate the pivotal role of cholesterol in the regulation of membrane structure, fluidity, and lipid trafficking, which in turn plays a role in balancing the function of membrane-associated proteins, including ion channels and signaling molecules. Local anesthetics such as ropivacaine exert their effects both through direct interaction with voltage-gated sodium channels and through indirect changes in membrane lipid composition and microdomain organization (22-24).
Granulin (GRN) is another downregulated bottleneck. Granulin is linked to two clusters of biological processes. A wide range of diseases, from dementia to cancers, are counted as the relative diseases for GRN (25).
The last downregulated bottleneck is cathepsin A (CTSA). A close relationship between cathepsin A and several cancers is reported in the literature (26). Decrement of cathepsin D level in the cells that were treated with ropivacaine is reported by Zhang et al. (27). It seems that the presence of ropivacaine leads to essential changes in the gene expression pattern of MSCs.
Taken together, the simultaneous increase in the expression of extracellular matrix-related and growth-related central nodes and the decrease in the expression of central nodes related to immune and metabolic processes suggest that ropivacaine causes a coordinated regeneration of functional networks of MSCs. In fact, rather than acting through a single target, ropivacaine appears to act through the regulation of interconnected pathways, which may account for its experimentally reported antiproliferative effects.
5.1. Limitations
This study is a re-analysis of available transcriptome data and is therefore limited by the lack of independent experimental validation. Also, the quality of interactions from online databases may affect data information. Nevertheless, by integrating differential gene expression with PPI network and functional enrichment analyses, our findings give a mechanistic insight into the antiproliferative effects of ropivacaine previously reported by Lucchinetti et al. (11), and generate a series of hypotheses for future experimental investigations of local anesthetic exposure.
5.2. Conclusions
In conclusion, this study provides a systems-level insight into the transcriptional alterations and network interactions induced by ropivacaine in MSCs. By integrating differential gene expression, protein interaction, and functional enrichment, key molecular hubs and biological processes were identified that may influence various cellular functions. Despite the exploratory nature of these findings, they provide researchers with conceptual framework clues for future experimental studies to further understand cellular mechanisms and effects.