
1. Background
Icterus in neonates is a common and unavoidable physiologic phenomenon that happens in 60% of term neonates within the first week of the neonate’s life (1).
However, icterus is considered pathologic in any of these cases: if it occurs within the first 24 hours after birth, the total serum bilirubin level rises by more than 5 mg/dL per day or if higher than 17 mg/dL, or the signs and symptoms suggestive of serious illness exist (2).
Increase in serum indirect bilirubin level and its accumulation inside the brain tissue causes damage to this tissue, especially in the basal ganglia, and as a result, kernicterus may occur in the neonate. This causes an increase in neonatal mortality rate or may cause the long-term neurological effects like cerebral palsy or neurological hearing loss in surviving neonates (3, 4).
To prevent the negative health effects of hyperbilirubinemia, the icteric neonates should receive medical treatments to avoid the serum indirect bilirubin levels to reach neuro-toxic levels. So far, the most common treatment method to reduce the level of serum indirect bilirubin has been phototherapy (5, 6). However, the need for hospitalization of the neonate and recurrent blood draw, and the need for the presence of mothers alongside their neonates in the hospital, increase the chances of psychological problems, depression, postpartum pain among mothers, and financial burden on families. Additionally, the needs for hospital equipment and skilled nurses increase when the treatment takes longer than expected (5-7).
Studies show that in addition to phototherapy, other therapeutic methods have been applied, including immunoglobin-therapy, blood exchange, albumin injection, and administration of clofibrate (8, 9). More recent therapies include administration of bilirubin chelators. Metalloporphyrins act as competitive inhibitor of bilirubin production (10). However, they are expensive and still not easily available worldwide. Additionally, zinc chelators need to be injected, which causes stress for the patients and families (8, 9). Clofibrate is low cost and is administered orally in a single dose, which brings convenience.
2. Objectives
Since there is still no agreement in scientific references on the role of clofibrate in treating jaundice, this present study investigated the effects of clofibrate on reducing the serum bilirubin level in neonates who were under phototherapy. The novelty of this study is that it further evaluated the possible short-term side effects of clofibrate, including its effects on lipid profile and hepatic function.
3. Methods
In this randomized-controlled clinical trial, during one year in 2016, 90 term icteric neonates (gestational age or GA more than 38 weeks) who were within 14 days of age and were breast-fed were matched (as much as possible) for age (based on birth date), weight, gender, and GA, and each newborn took the assignment of one of the three groups. Newborns all had high serum total bilirubin levels (up to 20 mg/dL) diagnosed based on their age, GA, and weight, and according to the Bhutani Nomogram table (16), they were admitted to the neonate department of either Loghman-Hakim or Taleghani hospitals in Tehran, Iran. Neonates with any hemolytic disease (Rh or ABO incompatibility and a positive Coombs test), congenital anomaly, infection, dehydration, G6PD deficiency, anemia, severe asphyxia, conjugated bilirubin more than 1.5 mg/dL, or exceeding 15% of total serum bilirubin were excluded. The treatment was performed based on the criteria for serum total bilirubin levels defined by the Bhutani Nomogram table (16).
3.1. Intervention
Each group included 30 neonates. The first group took the placebo and started phototherapy. The second group took a single dose of 50 mg/kg clofibrate orally (from 500 mg capsule) before the start of phototherapy, and the third group took a single oral dose of 100 mg/kg clofibrate before starting phototherapy.
3.2. Outcomes
Serum bilirubin levels were measured at admission and then after 6, 12, 24, and 48 hours. Clofibrate’s side effects were assessed among the three groups by measuring hepatic enzymes aspartate transaminase, alanine transaminase (AST/ALT), and lipid profile (triglyceride and cholesterol) on the first day of admission and 48 hours after.
3.3. Sample Size
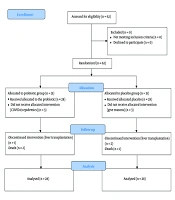
Equation 1 determined the sample size where the confidence level was set at 95%, the margin of error (E) was 8%, and standard deviation (σ) was 1. After recruiting 164 newborns, due to lost to follow-up or identifying exclusion criteria, only 90 newborns stayed in the study.
3.4. Randomization, Allocation, and Blinding
When a newborn was randomly assigned to one of the trial groups, the next matching two patients were each randomly assigned to one of the remained two groups using a random numbers table. The study was a double blinded randomized clinical trial (only the research team knew which patient received what dose/placebo to minimize bias). The study evaluated whether clofibrate, and with which dose, affected the decrease in the newborn’s serum bilirubin levels, which was measured every 6 hours.
3.5. Statistical Methods
For analyzing quantitative data, SPSS software (version 23, IBM Corporation) was used. Student’s t-tests and ANOVA were used to test the differences between three participant groups’ means for continuous data. Pearson correlation was used to identify the associations between continuous parameters and chi-squared was used for categorical parameters. Student’s t-tests were used to compare the slopes of regression lines (17). Participants with missing data were eliminated from the statistical analysis. Significance was defined at P < 0.05.
The study was approved by the Research Ethics Committee of the Clinical Research and Development Unit of Loghman-Hakim Hospital and financial support was provided by the Shahid Beheshti University of Medical Sciences, Tehran, Iran. Informed consents were obtained from the parents of the neonates (SBMU.RETECH.1396.77, IRCT 32992). This study has been carried out in accordance with the code of ethics of the World Medical Association (Declaration of Helsinki) for experiments involving humans.
4. Results
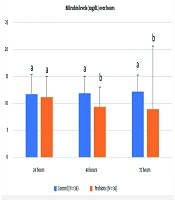
Of the 90 newborns enrolled during 2016, 51 (56.7%) were male and 39 (43.3%) were female. The average age (days) was 4.45 ± 2.2 (range 2 - 10 days). There was no difference between three groups for gender, age, birth weight (average 3193.46 ± 395.14 g), and weight at the time of admission (average 3131.21 ± 398.69 g). Paired-samples t-test showed that the average bilirubin level decreased in 90 neonates after 48 hours t (89) = 21.40, P = 0.000 (Figure 1). Data showed that after 48 hours, the newborns who received a single dose of 50 mg/kg of clofibrate did not have as much reduction in serum bilirubin levels as newborns who received a single dose of 100 mg/kg of clofibrate or even as much as the control group did (Table 1).
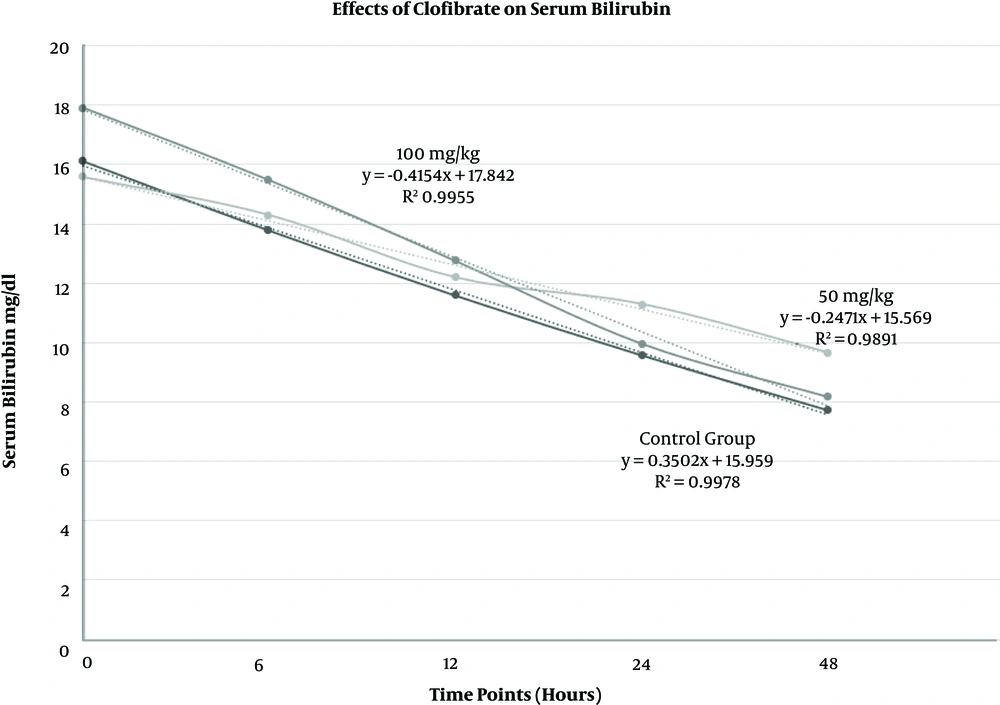
Figure 1.
Effects of a single oral dose of 100 mg/kg and 50 mg/kg of clofibrate as well as no clofibrate on neonates’ serum total bilirubin levels when administered in addition to phototherapy. Since the R-squared values are close to 100%, the linear models fit our data well (n = 90, including 30 neonates in each group).
Table 1.
Averages for Total Bilirubin, Triglyceride, Cholesterol, Aspartate Transaminase (AST), and Alanine Transaminase (ALT) Measured at Different Time Points Before and After a Single Oral Dose of Clofibrate in Neonates’ Serum (N = 90, 30 Patients in Each Group)a
| Average Measurements | Placebo (Control Group) | 50 mg/kg Clofibrate | 100 mg/kg Clofibrate | P Value |
|---|---|---|---|---|
| Bilirubin at time 0, mg/dL | 16.123 | 15.577 | 17.903 | 0.007b |
| Bilirubin after 6 hours | 13.780 | 14.293 | 15.467 | 0.06 |
| Bilirubin after 12 hours | 11.587 | 12.193 | 12.753 | 0.282 |
| Bilirubin after 24 hours | 9.573 | 11.297 | 9.973 | 0.025b |
| Bilirubin after 48 hours | 7.720 | 9.663 | 8.187 | 0.001b |
| Triglyceride at time 0, mg/dL | 94.93 | 78.43 | 79.73 | 0.274 |
| Triglyceride after 48 hours | 93.67 | 103.07 | 79.13 | 0.161 |
| Cholesterol at time 0, mg/dL | 97.13 | 100.60 | 99.07 | 0.919 |
| Cholesterol after 48 hours | 96.93 | 112.03 | 93.87 | 0.057 |
| Aspartate transaminase at time 0, U/L | 47.43 | 43.33 | 42.3 | 0.691 |
| Aspartate transaminase after 48 hours | 43.87 | 37.10 | 39.80 | 0.519 |
| Alanine transaminase at time 0, U/L | 22.13 | 24.63 | 20.03 | 0.665 |
| Alanine transaminase after 48 hours | 21.27 | 22.80 | 19.47 | 0.795 |
aANOVA tests showed that here was a statistically significant difference for serum bilirubin at time zero between group 100 mg/kg and two other groups, and additionally, for bilirubin after both 24 hours and 48 hours, between group 50 mg/kg and two other groups.
bSignificance was defined at P < 0.05.
Although comparing the slopes for the amount of reduction in the serum bilirubin levels did not show any statistically significant differences, (for control and 50 mg/kg groups P = 0.654, for control and 100 mg/kg groups P = 0.646, and for groups of 50 mg/kg and 100 mg/kg P = 0.905), the repeated tests that compared the slopes of regression lines showed significance as follows.
For the control group, the reduction in serum bilirubin level was faster compared to the group who took a single dose of 50 mg/kg of clofibrate (t (58) = 2.67, P = 0.010) (Figure 1).
Taking a single dose of 100 mg/kg of clofibrate expedited the reduction in serum bilirubin levels after 48 hours compared to the control group (t (58) = -2.73, P = 0.043) or the group who took a single dose of 50 mg/kg of clofibrate (t (58) = -4.261, P = 0.000).
As Table 2 presents, compared to the control group, in the group who took 50 mg/kg of clofibrate, a higher number of neonates showed an increase in serum triglyceride levels (χ2(1, N = 90) = 6.46, P = 0.0111 (95% CI 7.77 to 52.96)), and similarly, a higher number of neonates showed an increase in serum cholesterol levels after 48 hours (P = 0.0196).
Table 2.
Number and Percent of Newborns with Changes in Measurements After 48 Hours of Treatment (N = 90, 30 Patients in Each Group)a
| Measurement Results After 48 Hours of Treatment | Placebo (Control Group) | 50 mg/kg Clofibrate | 100 mg/kg Clofibrate |
|---|---|---|---|
| Had reduction in serum bilirubin levels | 30 (100) | 26 (87) | 30 (100) |
| Had increase in serum triglyceride levels | 9 (30) | 19 (63) | 7 (23) |
| Had increase in serum cholesterol level | 8 (27) | 17 (57) | 7 (23) |
| Had increase in aspartate transaminase | 8 (27) | 9 (30) | 6 (20) |
| Had increase in alanine transaminase | 10 (33) | 10 (33) | 7 (23) |
aValues are expressed as No. (%).
The number of newborns who had an increase in serum AST levels after 48 hours (P = 0.3751 and P = 0.5260 respectively) or had an increase in serum ALT levels after 48 hours (P = 0.5424) showed no statistical significance among groups (Table 2).
Pearson correlation showed that there was no correlation between the neonate’s birth weight and the serum bilirubin level at the admission time (r = 0.087, n = 88, P = 0.416). Birth weight did not correlate with the amount of change in the serum bilirubin level after 48 hours (P = 0.334).
There was no correlation between gender and the amount of change in serum bilirubin levels after 48 hours (r = 0.040, n = 88, P = 0.705).
Older age correlated with more reduction in the serum bilirubin level. Pearson correlation showed that the neonate’s age correlated with the amount of change in the serum bilirubin level after 48 hours (r = 0.444, n = 88, P = 0.000).
Although for the purpose of this study all patients were hospitalized for at least 48 hours in order to make collecting blood samples possible, the actual time-period to achieve the treatment’s goal was shorter for most newborns. The numbers for newborns who achieved serum bilirubin levels of 10 mg/dL or lower within 24 hours are presented here, however, newborns were further evaluated if they needed to be discharged based on their birth weight and age; (research’s funding paid for all the hospitalization costs).
After 24 hours of treatment, the following numbers show how many (percent) newborns achieved serum bilirubin level of 10 mg/dL or less, 17 (57%) for 100 mg/kg dose, 13 (43%) for 50 mg/kg dose, and 19 (63%) for the control group. However, 100 mg/kg group had higher bilirubin levels to start with at the baseline.
5. Discussion
This study showed that compared to the control group, with only phototherapy, administering a single dose of 100 mg/kg of clofibrate expedited the reduction of serum bilirubin levels in neonates. However, a single dose of 50 mg/kg of clofibrate did not accelerate the reduction in serum bilirubin levels, and even compared to a single dose of 100 mg/kg of clofibrate and control group the serum triglyceride and/or cholesterol in a higher number of patients increased, which we do not have any explanation for. However, this group had a lower average for serum bilirubin at the baseline (admission time).
Neonate’s age and not birth weight or gender correlated with the amount of reduction in serum bilirubin level after 48 hours.
None of the patients needed exchange transfusion and no patient retuned to our center due to gastrointestinal or any other complications during following months after our trial.
Clofibrate is a lipid-lowering agent used for controlling the high cholesterol and triglyceride levels in the blood. To promote the conversion of VLDL to LDL, clofibrate increases lipoprotein lipase activity, and as a result, reduces the level of VLDL; it may increase the level of HDL as well (18). Fibrates also may increase bilirubin conjugation and excretion through induction of glucuronyl transferase activity (19). Although the possible side effects of clofibrate (like gastrointestinal effects in adults) were not seen in neonates who took a single dose, due to lack of enough research in this regard, this study aimed to identify the possible side effects of clofibrate in neonates in addition to comparing the benefits of two different doses of clofibrate in treating neonates with indirect hyperbilirubinemia.
A study published in 2012 in the Journal of Indian Pediatrics showed that clofibrate had reduced the need for/or duration of phototherapy and had reduced the serum total bilirubin levels (20). This finding may help in reducing the duration and cost of hospitalization. Clofibrate may offer short-term benefits in full-term newborns who do not have hemolytic diseases, however, a long-term follow up is needed to evaluate its safety and long-term effects. Currently, there is no evidence to show that clofibrate can change the possibility of death, kernicterus (21), or long-term neuronal growth defect.
In another study in 2013 published in the Excli Journal, 90 newborns were divided into three groups. Two groups received clofibrate in addition to phototherapy: one group received 25 mg/kg and the second group received 50 mg/kg. The third group was counted as the control group and received only phototherapy. In groups treated by clofibrate, the serum total bilirubin level decreased, however, there was no statistically significant difference between groups who took two different clofibrate doses. In groups who took clofibrate, the duration of phototherapy and hospitalization reduced compared to the control group who was only under phototherapy (22).
A study published in 2015 in the Clinical Neonatology Journal included 60 neonates who were divided into two groups. One group who was counted as the control group only received phototherapy and the second group received clofibrate (10 mg/kg single dose), in addition to phototherapy (1). Their results showed that the group that took clofibrate had more reduction in the level of serum total bilirubin, and additionally, shorter duration of phototherapy and hospitalization (1).
Another study in 2012 published in the Iranian Red Crescent Medical Journal showed that a single dose of 100 mg/kg clofibrate in full-term neonates who were breastfed better reduced the level of serum bilirubin compared to the control group (15).
We measured serum aminotransferases AST and ALT to evaluate if hepatocyte damage had occurred possibly due to side effects of administered clofibrate and we found no change in those enzymes compared to the control group (23).
Due to the fact that in other studies both single doses of either 50 or 100 mg/kg of clofibrate have shown bilirubin-reducing effects, and since our data did not show that 50 mg/kg dose can reduce serum bilirubin better compared to the control group, further clinical trials are recommended (14, 15, 24).
5.1. Study Limitations
Since newborns were randomly assigned to treatments and sample size was small, the average value for serum bilirubin at the admission time happened to be higher in the group who received 100 mg/kg of clofibrate compared to the other two groups. Larger sample size may minimize differences between groups’ measurements at the time of assignments to avoid bias. In addition, long-term side effects of clofibrate were not studied. Due to limited logistics, we could not measure serum bilirubin, lipids, and hepatic enzymes after 72 hours of starting treatment, as those measurements could possibly provide more information.
5.2. Generalizability
The study findings may be valid for all term neonates under 14 days of age who are breastfed and who have developed non-hemolytic jaundice.
5.3. Conclusions
A single oral dose of 100 mg/kg of clofibrate better reduced the serum total bilirubin levels compared to the group who took a single dose of 50 mg/kg of clofibrate and the control group who was only under phototherapy. A single dose of 50 mg/kg of clofibrate increased serum triglyceride and/or cholesterol levels in higher numbers of neonates compared to the control and 100 mg/kg groups. A single dose of 50 mg/kg of clofibrate did not show any benefit in the group with moderately increased serum total bilirubin. A single oral dose of 50 or 100 mg/kg of clofibrate, in full-term icteric neonates, showed no increase in hepatic enzymes (AST/ALT) after 48 hours.