


1. Background
2. Objectives
3. Methods
3.1. Patients and Controls
3.2. Genotyping
| Variables and Primers | Sequence (5ʹ → 3ʹ) | Product Size (bp) |
|---|---|---|
| rs1899663 | 247 | |
| Wild type forward C allele primer | AAGCCTCTAATTGTTGTCATC | |
| Mutant forward A allele primer | AAGCCTCTAATTGTTGTCATA | |
| Generic reverse primer | TAATCAAATCCTCTTCCTTTGT | |
| rs12826786 | 140 | |
| Wild type reverse C allele primer | GAGGGAAGGAGCTTAGGATAAATG | |
| Mutant reverse T allele primer | GAGGGAAGGAGCTTAGGATAAATA | |
| Generic forward primer | ATCTGTCCAGTCGCTCGTC |
3.3. HOTAIR Gene Expression Analysis
| Primers | Sequence (5ʹ → 3ʹ) | Product Size (bp) | NCBI Reference |
|---|---|---|---|
| HOTAIR | 140 | ||
| F | ACCAGCAATTACACCCAAGC | ||
| R | TGCATTTCTCTGCGTGGTTC | ||
| GAPDH | 129 | ||
| F | TCACCAGGGCTGCTTTTAAC | ||
| R | TGACGGTGCCATGGAATTTG |
3.4. Statistical Analysis
4. Results
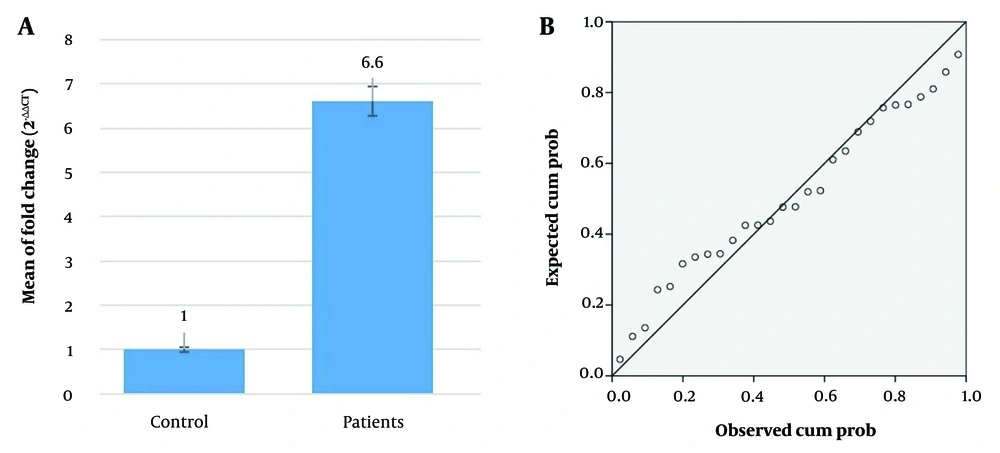
The relative expression of HOTAIR gene in diabetes mellitus type 2 (T2DM) patients compared to healthy control. A, the mean of fold change (2-ΔΔCT) values between the control and patient’s groups. The error bars represent the standard deviation. This graph shows a significant difference in the mean fold change between the two groups; B, the normal P-P plot of regression standardized residual for the dependent variable "ΔCT patients". The plot demonstrates that the residuals follow a normal distribution, which is an important assumption for the regression analysis performed. Data are expressed as mean ± SD (n = 3). P-values < 0.05 indicate statistically significant differences.
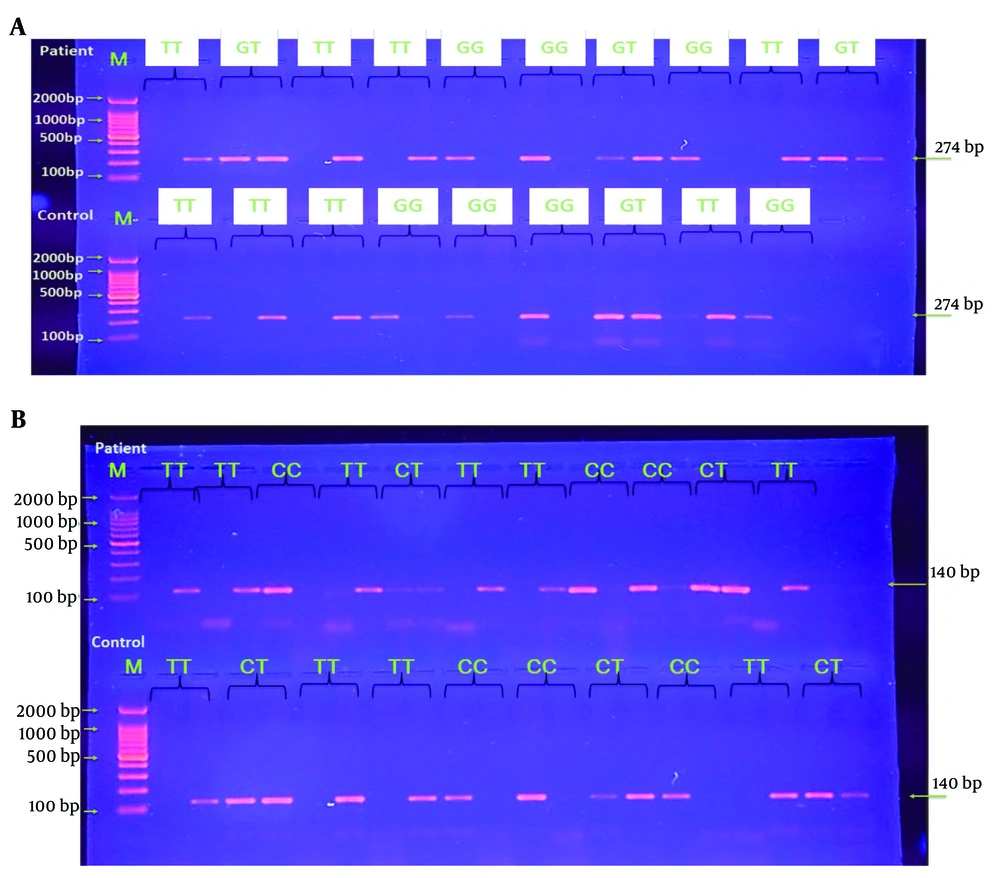
Amplicons for A, rs1899663; and B, rs12826786 HOTAIR gene single nucleotide polymorphism. M: Molecular ladder.
| Variables | T2DM Patients | Control | OR | CI 95% | P-Value a |
|---|---|---|---|---|---|
| rs1899663 (G > T) | |||||
| Genotype frequency | |||||
| GG | 9 (50) | 9 (50) | 0.57 | 0.176 - 1.89 | 0.36 |
| GT | 11 (64.7) | 6 (35.3) | 1.5 | 0.44 - 5.11 | 0.5 |
| TT | 8 (61.5) | 5 (38.5) | 1.2 | 0.32 - 4.4 | 0.78 |
| Allele frequency | 0.71 | 0.31 - 1.62 | 0.42 | ||
| G | 29 (54.7) | 24 (45.3) | |||
| T | 27 (62.8) | 16 (37.2) | |||
| Recessive model | 0.83 | 0.22 - 3.06 | 0.78 | ||
| GG+GT | 20 (57.1) | 15 (42.9) | |||
| TT | 8 (61.6) | 5 (38.4) | |||
| Dominant model | 0.57 | 0.17 - 1.89 | 0.36 | ||
| GG | 9 (50) | 9 (50) | |||
| TT+GT | 19 (63.3) | 11 (36.7) | |||
| rs12826786 (C > T) | |||||
| Genotype frequency | |||||
| CC | 9 (45) | 11 (55) | 0.3876 | 0.1185 - 1.2681 | 0.117 |
| CT | 8 (57.1) | 6 (42.9) | 0.933 | 0.2648 - 3.2895 | 0.9145 |
| TT | 11 (78.6) | 3 (41.4) | 3.66 | 0.86 - 15.5 | 0.077 |
| Allele frequency | 0.37 | 0.15 - 0.87 | 0.023 | ||
| C | 26 (48.1) | 28 (51.9) | |||
| T | 30 (71.4) | 12 (28.6) | |||
| Recessive model | 0.27 | 0.06 - 1.15 | 0.07 | ||
| CC+CT | 17 (50) | 17 (50) | |||
| TT | 11 (78.6) | 3 (41.4) | |||
| Dominant model | 0.7 | 0.244 - 2.19 | 0.57 | ||
| CC | 9 (45) | 11 (55) | |||
| TT+CT | 19 (52.7) | 17 (47.3) | |||
Abbreviations: T2DM, diabetes mellitus type 2; OR, odds ratio; CI, confidence interval.
a P-value was calculated by chi-square test and statistically significant at ≤ 0.05.
| Variables | Reference Value | Genes | Genotype | N | Mean ± SD | P-Value a |
|---|---|---|---|---|---|---|
| BMI | 18.5 - 24.9 | rs1899663 | GG | 9 | 28.9 ± 4.9 | 0.093 |
| GT | 11 | 33.2 ± 5.7 | ||||
| TT | 8 | 27.9 ± 4.8 | ||||
| rs12826786 | CC | 9 | 28.4 ± 4.7 | 0.028 | ||
| CT | 8 | 34.81 ± 6.5 | ||||
| TT | 11 | 28.72 ± 4.9 | ||||
| HbA1c (%) | 4 - 5.6 | rs1899663 | GG | 9 | 8.24 ± 1.7 | 0.149 |
| GT | 11 | 9.55 ± 3.6 | ||||
| TT | 8 | 8.08 ± 4.4 | ||||
| rs12826786 | CC | 9 | 8.27 ± 1.3 | 0.6 | ||
| CT | 8 | 9.2 ± 4.7 | ||||
| TT | 11 | 8.72 ± 4.7 | ||||
| Total Cholesterol (mg/dL) | Less than 200 | rs1899663 | GG | 9 | 181.88 ± 22.2 | 0.78 |
| GT | 11 | 190.54 ± 32.3 | ||||
| TT | 8 | 172 ± 42.4 | ||||
| rs12826786 | CC | 9 | 172.88 ± 23.8 | 0.82 | ||
| CT | 8 | 186.5 ± 25.7 | ||||
| TT | 11 | 187 ± 44.54 | ||||
| HDL (mg/dL) | Men: Less than 40; women: Less than 50 | rs1899663 | GG | 9 | 35.1 ± 4.1 | 0.647 |
| GT | 11 | 38.36 ± 6.2 | ||||
| TT | 8 | 37.75 ± 5.9 | ||||
| rs12826786 | CC | 9 | 37.55 ± 7.7 | 0.62 | ||
| CT | 8 | 39.04 ± 9.9 | ||||
| TT | 11 | 35.45 ± 6.4 | ||||
| Triglycerides (mg/dL) | Less than 150 | rs1899663 | GG | 9 | 181.88 ± 42.7 | 0.969 |
| GT | 11 | 174.27 ± 41.5 | ||||
| TT | 8 | 180.5 ± 34.8 | ||||
| rs12826786 | CC | 9 | 181.88 ± 45.9 | 0.93 | ||
| CT | 8 | 170.75 ± 43.6 | ||||
| TT | 11 | 181.36 ± 37.6 | ||||
| FBS (mg) | 70 - 100 | rs1899663 | GG | 9 | 224.33 ± 39.1 | 0.994 |
| GT | 11 | 219.81 ± 69.4 | ||||
| TT | 8 | 225.37 ± 80.6 | ||||
| rs12826786 | CC | 9 | 194.66 ± 43.3 | 0.68 | ||
| CT | 8 | 228.51 ± 84.2 | ||||
| TT | 11 | 241.81 ± 95.1 |
Abbreviations: BMI, Body Mass Index; HbA1c, glycated hemoglobin; HDL, high-density lipoprotein; FBS, fasting blood sugar.
a P-value was statistically significant at ≤ 0.05.


