
1. Background
The global tobacco epidemic represents one of the most serious threats to public health in modern history. Tobacco use causes more than 8 million deaths annually, of which more than 7 million are attributable to direct consumption and approximately 1.2 million to secondhand smoke exposure (1). In 2020, approximately 22.3% of the global population used tobacco products, including 36.7% of men and 7.8% of women, with more than 80% of these users residing in low- and middle-income countries (1).
Tobacco consumption is causally linked to cardiovascular disease, multiple cancer types, chronic respiratory conditions, and numerous other morbidities. All tobacco products, including cigarettes, hookah or waterpipe, cigars, and electronic nicotine delivery systems (ENDS), pose substantial health risks.
The Arbaeen pilgrimage is an annual religious mass gathering held in Karbala, Iraq, attracting tens of millions of pilgrims from across the country and abroad. It is considered one of the largest recurring human gatherings worldwide. Despite its scale, the epidemiology of tobacco use among Arbaeen attendees has not been previously studied.
2. Objectives
This study aimed to: (1) Estimate the prevalence of tobacco use among Arbaeen pilgrims in 2022; (2) assess pilgrims’ knowledge of smoking-related health hazards; and (3) identify independent sociodemographic predictors of current tobacco use by using multivariable logistic regression.
3. Methods
3.1. Study Design and Setting
A descriptive cross-sectional study was conducted during the Arbaeen pilgrimage from September 10 to 17, 2022, along the walking routes leading to Karbala, Iraq.
3.2. Data Collection Instrument
An electronic questionnaire was developed in KoboToolbox based on the World Health Organization Global Adult Tobacco Survey (GATS) instrument (2), with minor contextual adaptations. The questionnaire comprised 24 closed-ended questions organized into four domains: 1) sociodemographic characteristics; 2) tobacco use status and patterns; 3) electronic cigarette use and attitudes; and 4) knowledge of smoking-related harms. The instrument was piloted among 33 eligible individuals before the main data collection phase, and pilot data were excluded from the final analysis.
3.3. Sampling and Participants
A convenience sample of adult pilgrims aged ≥ 18 years who were walking toward Karbala was recruited. The minimum required sample size was calculated as 266 participants, based on an assumed smoking prevalence of 22% according to Iraq STEPS 2015, a 5% margin of error, and a 95% confidence level. All approached individuals provided consent to participate, and no refusals or dropouts were recorded.
3.4. Ethical Considerations
The study protocol was approved by the Scientific and Ethics Committee at the Public Health Directorate, Ministry of Health, Iraq. Verbal informed consent was obtained from each participant before data collection, and no personally identifying information was recorded.
3.5. Statistical Analysis
Data were processed and analyzed using Epi Info (version 7.1.1.14; CDC, Atlanta, GA, USA). Descriptive statistics, including frequencies and proportions, were calculated. Bivariate associations between categorical variables were assessed using the chi-square test and Fisher exact test. To identify independent predictors of current tobacco use, a multivariable binary logistic regression model was fitted, with smoking status (1 = smoker, 0 = non-smoker) as the outcome. All relevant sociodemographic variables were entered simultaneously into the model using the enter method. Results are presented as adjusted odds ratios (aORs) with 95% confidence intervals (CIs). Model fit was assessed using the likelihood ratio chi-square test and Nagelkerke pseudo-R2. Statistical significance was set at P < 0.05.
3.6. Operational Definitions
Secondhand tobacco smoke was defined as smoke emitted from the burning end of a tobacco product or exhaled by a smoker (1).
Electronic nicotine delivery systems were defined as devices that heat a liquid to generate an aerosol inhaled by the user (1).
A mass gathering was defined as an assembly of ≥ 1000 people at a specific location for a defined purpose, sufficient to strain local emergency resources (3).
4. Results
4.1. Participant Characteristics
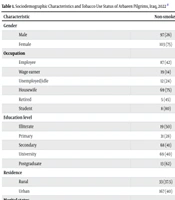
A total of 509 walking pilgrims were enrolled, and all individuals who were approached agreed to participate. The mean age was 36 ± 14 years. Sociodemographic characteristics and smoking status are presented in Table 1.
Table 1.
Sociodemographic Characteristics and Tobacco Use Status of Arbaeen Pilgrims, Iraq, 2022 a
| Characteristic | Non-smoker | Smoker | Total |
|---|---|---|---|
| Gender | |||
| Male | 97 (26) | 274 (74) | 371 (100) |
| Female | 103 (75) | 35 (25) | 138 (100) |
| Occupation | |||
| Employee | 87 (42) | 118 (58) | 205 (100) |
| Wage earner | 19 (14) | 121 (86) | 140 (100) |
| Unemployed/idle | 12 (24) | 39 (76) | 51 (100) |
| Housewife | 69 (75) | 23 (25) | 92 (100) |
| Retired | 5 (45) | 6 (55) | 11 (100) |
| Student | 8 (80) | 2 (20) | 10 (100) |
| Education level | |||
| Illiterate | 19 (50) | 19 (50) | 38 (100) |
| Primary | 31 (28) | 80 (72) | 111 (100) |
| Secondary | 68 (41) | 98 (59) | 166 (100) |
| University | 69 (40) | 104 (60) | 173 (100) |
| Postgraduate | 13 (62) | 8 (38) | 21 (100) |
| Residence | |||
| Rural | 33 (37.5) | 55 (62.5) | 88 (100) |
| Urban | 167 (40) | 254 (60) | 421 (100) |
| Marital status | |||
| Unmarried | 51 (31) | 113 (69) | 164 (100) |
| Divorced | 8 (38) | 13 (62) | 21 (100) |
| Married | 124 (43) | 163 (57) | 287 (100) |
| Widowed | 17 (46) | 20 (54) | 37 (100) |
| Total | 200 (39) | 309 (61) | 509 (100) |
a Values are expressed as No. (%).
4.2. Tobacco Use Prevalence and Patterns
Among the 509 participants, 309 (61%) were current tobacco users. Among smokers, 78% smoked daily and 22% smoked occasionally. By product type, 50% were cigarette-only smokers, 23% used hookah exclusively, and 27% used both products. Most smokers (68%) had used tobacco for more than three years, and only 4% had smoked for less than one year. The most common reasons for initiation were stress relief (39%) and peer pressure (31%). Among cigarette smokers, the mean daily consumption was 25 cigarettes (range, 10 - 40). Among hookah users, the average session duration was two hours (range, 1 - 6 hours per day). Most smokers reported smoking at home (71%), indoors (65%), and in enclosed public spaces (60%).
4.3. Smoking Status by Education Level
Chi-square analysis showed a statistically significant association between education level and smoking status (P < 0.05). The highest smoking rates were observed among participants with primary education (73%) and university-level education (60%), whereas participants with postgraduate education had the lowest rate (38%). Detailed data are presented in Table 2.
Table 2.
Tobacco Use Status by Education Level Among Arbaeen Pilgrims, Iraq, 2022 a
| Education Level | Non-smoker | Smoker | Total |
|---|---|---|---|
| Illiterate | 19 (50) | 19 (50) | 38 (100) |
| Primary | 31 (27) | 80 (73) | 111 (100) |
| Secondary | 68 (41) | 98 (59) | 166 (100) |
| University | 69 (40) | 104 (60) | 173 (100) |
| Postgraduate | 13 (62) | 8 (38) | 21 (100) |
| Total | 200 (39) | 309 (61) | 509 (100) |
a Values are expressed as No. (%).
4.4. Smoking Status by Age Group
Smoking prevalence declined with advancing age (P < 0.05). The highest rate was recorded in the 18 - 32-year age group (69%), compared with 49% among those aged 48 years and older (Table 3). No statistically significant differences in smoking prevalence were observed by marital status or residential setting.
Table 3.
Tobacco Use Status by Age Group Among Arbaeen Pilgrims, Iraq, 2022 a
| Age Group (y) | Non-smoker | Smoker | Total |
|---|---|---|---|
| 18 - 32 | 79 (31) | 172 (69) | 251 (100) |
| 33 - 47 | 56 (43) | 75 (57) | 131 (100) |
| 48 - 62 | 37 (51) | 35 (49) | 72 (100) |
| 63+ | 28 (51) | 27 (49) | 55 (100) |
| Total | 200 (39) | 309 (61) | 509 (100) |
a Values are expressed as No. (%).
4.5. Multivariable Logistic Regression: Predictors of Current Tobacco Use
To identify independent predictors of smoking while controlling for potential confounders, a multivariable binary logistic regression model was fitted, with all sociodemographic variables entered simultaneously. The overall model was statistically significant (LR χ2[df = 17] = 220.8, P < 0.001) and explained approximately 47.7% of the variance in smoking status (Nagelkerke R2 = 0.477). Results are presented in Table 4.
Table 4.
Multivariable Binary Logistic Regression: Predictors of Current Tobacco Use Among Arbaeen Pilgrims, Iraq, 2022 (N = 509) a
| Variables | β | aOR | 95% CI | P-Value |
|---|---|---|---|---|
| Sex (ref: Female) | ||||
| Male | 2.39 | 10.87 | 6.36 - 18.58 | < 0.001 b |
| Age group (ref: 18 - 32 y) | ||||
| 33 - 47 | -0.50 | 0.61 | 0.34 - 1.08 | 0.088 |
| 48 - 62 | -0.82 | 0.44 | 0.22 - 0.87 | 0.018 b |
| 63+ | -0.79 | 0.45 | 0.22 - 0.93 | 0.030 b |
| Education level (ref: Illiterate) | ||||
| Primary | 0.93 | 2.53 | 0.99 - 6.46 | 0.052 |
| Secondary | 0.64 | 1.90 | 0.79 - 4.59 | 0.155 |
| University | 0.55 | 1.73 | 0.73 - 4.11 | 0.217 |
| Postgraduate | 0.27 | 1.31 | 0.33 - 5.19 | 0.697 |
| Occupation (ref: Employee) | ||||
| Wage earner | 1.56 | 4.77 | 2.49 - 9.13 | < 0.001 b |
| Idle/unemployed | 0.86 | 2.37 | 1.05 - 5.34 | 0.037 b |
| Housewife | -1.60 | 0.20 | 0.11 - 0.38 | < 0.001 b |
| Retired | -0.31 | 0.73 | 0.18 - 2.92 | 0.657 |
| Student | -1.80 | 0.17 | 0.03 - 0.88 | 0.035 b |
| Marital status (ref: Married) | ||||
| Unmarried | 0.47 | 1.60 | 0.95 - 2.69 | 0.078 |
| Divorced | 0.42 | 1.52 | 0.47 - 4.95 | 0.482 |
| Widowed | -0.05 | 0.96 | 0.39 - 2.32 | 0.921 |
| Residence (ref: Urban) | ||||
| Rural | 0.28 | 1.33 | 0.70 - 2.49 | 0.383 |
Abbreviations: aOR, adjusted odds ratio; CI, confidence interval.
a Model fit: LR χ2(df = 17) = 220.8, P < 0.001; Nagelkerke R2 = 0.477.
b Values in the source table indicated statistical significance (P < 0.05).
Sex was the strongest independent predictor of tobacco use. After controlling for all other variables, male pilgrims had nearly 11 times the odds of being current smokers compared with female pilgrims (aOR = 10.87; 95% CI, 6.36 - 18.58; P < 0.001).
Age was significantly associated with tobacco use in a dose-response pattern. Compared with the youngest age group (18 - 32 years), participants aged 48 - 62 years (aOR = 0.44; 95% CI, 0.22 - 0.87; P = 0.018) and those aged 63 years or older (aOR = 0.45; 95% CI, 0.22 - 0.93; P = 0.030) had significantly lower odds of smoking. The difference for the 33 - 47-year age group did not reach statistical significance (aOR = 0.61; P = 0.088).
Occupation was a significant predictor of smoking. Wage earners had nearly five times the odds of smoking compared with employees (aOR = 4.77; 95% CI, 2.49 - 9.13; P < 0.001), and idle or unemployed participants had more than twice the odds (aOR = 2.37; 95% CI, 1.05 - 5.34; P = 0.037). Conversely, housewives (aOR = 0.20; 95% CI, 0.11 - 0.38; P < 0.001) and students (aOR = 0.17; 95% CI, 0.03 - 0.88; P = 0.035) had significantly lower odds of being current smokers.
Education level, marital status, and rural versus urban residence were not independently associated with current tobacco use after adjustment for other covariates (all P > 0.05).
4.6. Knowledge of Smoking-Related Harms
Most participants (92%) reported awareness of the general health hazards of smoking. Sixty percent believed that secondhand smoke is as harmful as active smoking, whereas 31% held the same view regarding thirdhand smoke. Only 18% considered hookah less dangerous than cigarettes, and 27% perceived vaping as less harmful than conventional smoking.
4.7. Electronic Cigarette Awareness and Use
Most participants (86%) had heard of electronic cigarettes. The primary information sources were friends who vape (44%), other vapers (39%), family (21%), and online advertising (16%). The most frequently cited reasons for vaping were favorable odor (69%), desire to quit smoking (40%), ability to use indoors (39%), perceived lower harm than smoking (25%), and increased availability (7%).
5. Discussion
The prevalence of tobacco use in this study was strikingly high, at nearly three times the national estimate from the Iraq STEPS Survey 2015 (4), with the rate of daily smoking approximately four times higher than the national benchmark. This pattern is broadly consistent with findings from Russia, where more than 60% of participants had tried tobacco or nicotine products (5), and suggests that the Arbaeen pilgrim population may represent a particularly high-risk subgroup within the Iraqi population.
The most salient finding of the logistic regression analysis was the overwhelming influence of sex on smoking status. Male pilgrims had nearly 11-fold higher odds of being current smokers than female pilgrims after adjustment, a magnitude that substantially exceeds that typically observed in general population studies. In the descriptive analysis, 74% of males and 25% of females were current tobacco users, a pattern consistent with findings from the Kumbh Mela mass gathering in India (6). This disparity likely reflects deeply entrenched gender norms surrounding tobacco use in Iraqi society rather than differential awareness of harm.
The inverse association between age and smoking, with younger participants aged 18 - 32 years exhibiting the highest rates, is consistent with the global trend of declining initiation in older birth cohorts. After adjustment, participants aged 48 years and older had less than half the odds of smoking compared with the youngest group. This finding underscores the importance of early-life tobacco prevention strategies, particularly given that 45% of smokers in our sample reported initiating tobacco use before the age of 26, consistent with data from Pakistan's Northern Area (8).
Occupation emerged as a significant independent predictor. Wage earners and idle or unemployed individuals were at substantially elevated risk (aOR = 4.77 and 2.37, respectively), whereas housewives and students were significantly protected. These gradients plausibly reflect differences in occupational stress, peer environments, and access to tobacco. Comparable occupational disparities have been reported in community-based studies from Pakistan (7).
Notably, education level was not an independent predictor of smoking in the multivariable model, despite showing a bivariate association. This suggests that confounding, particularly by sex and occupation, accounts for the crude association, and that education per se may not be a primary driver of tobacco use in this population once these factors are accounted for. Similarly, residence and marital status were not independently associated with smoking.
Regarding e-cigarettes, 86% of participants had heard of vaping, slightly below the 90.4% awareness reported in the United Arab Emirates (9). The primary motivation for vaping in our sample, favorable odor (69%), contrasts with the United Arab Emirates, where social influence (64.8%) predominated (9). The finding that 27% believed vaping is less harmful than conventional smoking is concerning, given the accumulating evidence of ENDS-related harms, and indicates a critical gap in public health communication.
5.1. Conclusions
This study highlights a troublingly high rate of tobacco use among Arbaeen pilgrims in Iraq, exceeding the national average by more than threefold. Most users were young men and manual laborers. Logistic regression revealed that male sex, younger age, and being either a wage earner or unemployed were significant independent risk factors for current smoking. Despite widespread awareness of the harms of tobacco, many pilgrims continued to smoke in enclosed and public areas, thereby exposing others to secondhand smoke. Vaping, an emerging concern, remains weakly regulated. There is a pressing need for targeted cessation initiatives, rigorous enforcement of smoke-free laws at mass gatherings, and the involvement of religious leaders in health promotion efforts.
5.2. Recommendations
1. Health authorities should intensify smoking cessation programs and deploy them at mass gathering events, particularly targeting young men and manual workers, who were identified as the highest-risk groups.
2. Enforcement of smoke-free legislation in enclosed and public spaces should be strengthened, especially during the Arbaeen pilgrimage.
3. Religious leaders and institutions should be engaged as health ambassadors to disseminate anti-smoking and anti-vaping messages.
4. Regulatory and taxation measures on tobacco products should be strengthened to reduce affordability and availability.
5. A nationally representative survey should be conducted to provide updated estimates of tobacco use prevalence across Iraq.
6. Dedicated surveillance and regulatory frameworks for ENDS should be developed to monitor and respond to the growing challenge of electronic cigarette use.