1. Background
The novel coronavirus 2019 (COVID-19) emerged from Wuhan in China and spread worldwide (1). More than one hundred million people got infected, and over three million people perished due to COVID-19, a mortality rate of approximately 3% (2, 3). For controlling an infectious disease without definitive treatment, non-pharmaceutical interventions (NPIs) are the only measures (4); most countries adopted different means of NPIs, including lockdowns, to control the epidemic (5). Although the lockdown remarkably contributed to maintaining the COVID-19 outbreak (6-8), it could not be continued due to its tremendous impact on the countries’ economy (6, 9, 10). Hence, vaccination had to be considered as another preventive method for controlling COVID-19.
Several vaccines against COVID-19 from different companies and countries have been developed. They are in various forms, including inactivated vaccines (11, 12), attenuated live virus vaccines, recombinant protein vaccines (11), vectored vaccines (13, 14), and DNA (15) or RNA vaccines (16, 17), that have shown different efficacy and safety profiles (13, 17-20). Although the approval of the efficacy and safety of the COVID-19 vaccines was expedited due to the emergency, most countries accepted them (21, 22). However, in each immunization program, public participation is a crucial factor; otherwise, the vaccination program would inevitably fail, as was seen in previous vaccination programs (23, 24). Several studies have shown that several factors could affect public willingness to participate in the immunization programs, such as vaccination against COVID-19 infection (23-25). Some of these factors are: reassurance about the safety and efficacy of the COVID-19 vaccines, cultural and religious beliefs, social capital, and confidence in the healthcare system (23, 25, 26).
2. Objectives
As the abovementioned factors are mainly culture-dependent, we conducted this study to determine whether the Iranian population would participate in the vaccination program against COVID-19 and the motives for their participation.
3. Methods
This cross-sectional study was conducted among the Iranian population in February 2021 before the COVID-19 vaccine was distributed in Iran. The study was conducted in two formats: face-to-face interviews and online questionnaires. The protocol of this study was approved by the ethics committee of Shiraz University of Medical Sciences (SUMS) and registered as IR.SUMS.REC.1399.1151.
3.1. Sample Size and Sampling
3.1.1. Face-to-face Interview
This part of the study was conducted between February 1st and 13th, 2021, in Shiraz, the fifth most populous city in Iran and the capital of the Fars province.
Since no similar study with a face-to-face interview method was available at the time of this study, the sample size was calculated using the Raosoft sample size online program. Hence, considering the confidence interval (95%), error (5%), dropout (60%) and response distribution (50%), design effect 1.4, and gender effect 2, the sample size was estimated at 1724.8, which was rounded to 1725 (27). A multistage cluster sampling method was used. We decided to interview the passersby so that the interviewees could trust us more, as they could not be tracked later. Therefore, we first divided Shiraz into five zones; North, South, East, West, and the Center. Then to define the proportion sample size of each zone, we measured the pedestrian traffic at the three main streets of each area during rush hours. To extrapolate the study results to Shiraz, we used the age and gender distribution of the Shiraz population yield through the last national population census in 2016.
3.1.2. Online Interview
For the online part of this study, the questionnaire was distributed among a convenience sample of WhatsApp and Telegram online communities from February 14th to 17th, 2021. No incentives were provided for this survey participation.
3.2. Data Gathering Tool
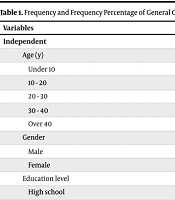
The questionnaire had three parts. The first part was socio-demographic information (16 questions) that included gender, age, living status (living alone versus living with others, including spouse, children, parents, friends, or their acquaintances), residential area (urban versus rural), education level, employment status, being a healthcare worker, monthly income and expenditure congruency (three choices: expenditure more, less, or in balance with income), self-reported socio-economic status (SES), and health insurance status.
The second section comprised seven questions about the health status of participants and their families and how they perceived susceptibility of themselves and their close family to COVID-19 infection during the following months. The third section inquired whether they wished to participate in the COVID-19 immunization program. In this part, three scenarios were presented to the participants. Some basic information about the COVID-19 vaccine’s mechanism of action, dosage, and the most frequent potential side effects was provided in the scenarios. Then the participants were asked whether they wished to participate in the immunization program against COVID-19. The face validity of this questionnaire was assessed by an expert team consisting of three health economists, a community-medicine specialist, an epidemiologist, and a health policymaker. These experts carefully evaluated the questionnaire, and if necessary, questions were revised. Finally, the final questionnaire's readability, clarity of wording, layout, style, and feasibility were confirmed. The reliability of the questionnaire was determined in a pilot study conducted among 50 individuals (Cronbach alphas was 0.86).
3.3. Statistical Analysis
Data were analyzed using the Statistical Package for Social Sciences (SPSS) version 24 (IBM, Armonk, NY, USA). Mean (± standard deviation) and frequency (percentage) were used to report quantitative and qualitative variables, respectively. The chi-square test and t-test were used as a univariate analysis to assess the associations between the outcome variable and the independent ordinal and scale variables, respectively. Variables with P- value < 0.2 were included in the binary logistic regression model to analyze their relationship with the inclination to participate in the immunization program against COVID-19. The final model was reported with adjusted odds ratios (aORs) and 95% confidence intervals (CIs). A P-value < 0.05 was considered significant.
4. Result
4.1. Participants
A total of 2071 participants, including 1020 (49.2%) males and 1051 (50.8%) females, were included in the present study. The number of individuals participating in the study through face-to-face interviews and online surveys was 1245 (60.1%) and 826 (39.9%), respectively. Participants were categorized into two groups: 1803 (87.1%) individuals were determined to participate in the immunization program against COVID-19, and 268 (12.9%) were indecisive or reluctant. In the present study, a higher percentage of participants (n = 1956, 94.4%) lived with others, including spouses and children and parents and friends and acquaintances, compared to those living alone (n = 115, 5.6%). Also, 1970 (95.1%) participants were from urban and 101 (4.9%) were from rural residential areas.
4.2. Univariable Analysis
Univariable analysis revealed that in total study population, education level (P-value = 0.01), SRH (P-value = 0.04), positive history of non-communicable diseases (NCDs) in respondents’ first degrees (P-value = 0.004), positive COVID-19 infection in the respondents’ family (P-value = 0.02), the perceived risk of getting COVID-19 infection in the next few months in respondents (P-value < 0.001) and their close family members (P-value < 0.001), and being a healthcare worker (P-value = 0.03) had a positive association with the intention to receive the vaccine.
In respondents who were interviewed, variables such as education level (P-value = 0.004), positive history of NCDs in respondents’ first degrees (P-value < 0.001), positive COVID-19 infection in the respondents’ family (P-value = 0.002), the risk of getting COVID-19 infection in the next few months in respondents (P-value < 0.001) and their close family members (P-value < 0.001), and being a healthcare worker (P-value = 0.003) had a positive association with willingness to receive the vaccine.
In respondents who filled out the online questionnaire, variables such as a positive history of NCDs (P-value = 0.001) and the risk of getting COVID-19 infection in the next few months (P-value = 0.03) had a positive association with the intention to get the vaccine. Other variables such as age, gender, living status, residential area, occupation, income and expenditure correlation, SES, and health insurance had no statistically significant association with the respondents’ decision to take the vaccine. (Table 1)
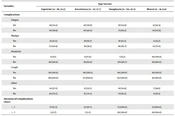
Table 1.Health Characteristics of Participants, Their Attitude Toward Transmissibility of COVID-19, and Their Intention to Take the COVID-19 Vaccine a
| Demographics | Univariable Analysis | Multivariable Logistic Regression | |||
|---|---|---|---|---|---|
| Definitely Yes (n = 1803) | Indecisive/ Definitely No (n = 268) | P-Value | Definitely Yes vs. Indecisive/ Definitely No Adjusted OR (95% CI) | P-Value | |
| Age groups (y) | |||||
| 18 - 44 | 1288 (87.7) | 181 (12.3) | 0.40 | ||
| 45 - 60 | 352 (85.2) | 61 (14.8) | |||
| > 60 | 163 (86.2) | 26 (13.8) | |||
| Gender | |||||
| Male | 895 (87.7) | 125 (12.3) | 0.39 | ||
| Female | 908 (86.4) | 143 (13.6) | |||
| Living status | |||||
| Alone | 98 (85.2) | 17 (14.8) | 0.56 | ||
| With others** | 1705 (87.20) | 251 (12.8) | |||
| Residential area | |||||
| Urban | 1710 (86.8) | 260 (13.2) | 0.17 | ||
| Rural | 93 (92.1) | 8 (7.9) | |||
| Education level | |||||
| Below high school | 434 (90.4) | 46 (9.6) | 0.01 | 2.6 (1.7 - 3.9) | < 0.001 |
| High school diploma | 618 (88.2) | 83 (11.8) | 2.1(1.4 - 2.9) | < 0.001 | |
| Undergraduate | 418 (85.1) | 73 (14.9) | 1.4 (1.01 - 2.1) | 0.04 | |
| Postgraduate | 333 (83.5) | 66 (16.5) | Reference | ||
| Job | |||||
| Employed | 974 (86.9) | 147 (13.1) | 0.84 | ||
| Unemployed | 829 (87.3) | 121 (12.7) | |||
| Healthcare worker | |||||
| Yes | 255 (91.1) | 25 (8.9) | 0.03 | 2 (1.2 - 3.1) | 0.004 |
| No | 1548 (86.4) | 243 (13.6) | Reference | ||
| Correlation between income and expenditure | |||||
| Income > expenditure | 626 (87.4) | 90 (12.6) | 0.85 | ||
| Income = expenditure | 1126 (86.9) | 169 (13.1) | |||
| Income < expenditure | 51 (85) | 9 (15) | |||
| SES # | |||||
| High | 208 (88.5) | 27 (11.5) | 0.06 | 0.7 (0.53 - 0.96) | 0.02 |
| Middle | 889 (85.3) | 153 (14.7) | 1.2 (0.70 - 1.80) | 0.60 | |
| Low | 706 (88.9) | 88 (11.1) | Reference | ||
| Health insurance | |||||
| Yes | 1478 (86.8) | 225 (13.2) | 0.49 | ||
| No | 323 (88.3) | 43 (11.7) | |||
| Self-rated health | |||||
| Good | 1276 (85.9) | 209 (14.1) | 0.04 | ||
| Fair | 486 (90) | 54 (10) | |||
| Poor | 41 (89.1) | 5 (10.9) | |||
| Positive history of chronic diseases in the respondent | |||||
| Yes | 287 (89.1) | 35 (10.9) | 0.24 | ||
| No | 1516 (86.7) | 233 (13.3) | |||
| Positive history of chronic diseases in the respondent’s first-degree family | |||||
| Yes | 733 (89.7) | 84 (10.3) | 0.004 | 1.4 (1.1 - 1.8) | 0.02 |
| No | 1070 (85.3) | 184 (14.7) | Reference | ||
| History of COVID-19 infection in respondents | |||||
| Not yet | 1394 (86.7) | 214 (13.3) | 0.09 | ||
| Yes (outpatient) | 321 (86.5) | 50 (13.5) | |||
| Yes (hospitalized) | 77 (95.1) | 4 (4.9) | |||
| Currently under treatment | 11 (100.0) | 0 | |||
| COVID-19 infection in the respondent’s family § | |||||
| Nobody | 1075 (85.7) | 180 (14.3) | 0.02 | Reference | |
| At least one | 728 (89.2) | 88 (10.8) | 1.4 (1.1 - 1.9) | 0.03 | |
| At least one outpatient | 558 (88.6) | 72 (11.4) | |||
| At least one hospitalized | 173 (89.2) | 21 (10.8) | |||
| At least one deceased | 69 (92.0) | 6 (8.0) | |||
| At least one is currently under treatment | 33 (94.3) | 2 (5.7) | |||
| Risk of getting COVID-19 in the next few months | |||||
| High | 898 (88.2) | 120 (11.8) | < 0.001 | 1.7 (1.1 - 2.7) | 0.03 |
| Intermediate | 729 (88.9) | 91 (11.1) | 1.8 (1.1 - 2.7) | 0.01 | |
| Low | 176 (75.5) | 57 (24.5) | Reference | ||
| Risk of getting COVID-19 in the next few months in your close family members | |||||
| High | 808 (88.2) | 108 (11.8) | < 0.001 | 1.6 (1.1 - 2.6) | 0.03 |
| Intermediate | 785 (89.3) | 94 (10.7) | 1.9 (1.2 - 2.9) | 0.002 | |
| Low | 210 (76.1) | 66 (23.9) | Reference | ||
a *Total number of participants was 2071; the number of interviewed participants was 1245; the number of participants in the online version was 826. **Others: Spouse and children and parents and friends and acquaintance. # SES: Socio-economic status according to the participants’ claim. § If the response was “At least one,” the respondent could choose one or more choices, including outpatient, hospitalized, deceased, and currently under treatment if applicable.
4.3. Multivariable Logistic Regression
Multivariable logistic regression showed that in the total study population, healthcare workers had two times more inclination to participate in the vaccination program (aOR = 2, 95% CI = 1.2, 3.1. P-value = 0.004). Also, in the interview group, healthcare workers had more than a fourfold tendency to be vaccinated against COVID-19 (aOR = 4.1, 95% CI = 1.4, 11.3. P-value = 0.009).
In the total study population, respondents with high SES had lower tendency to participate in vaccination compared with the middle or low SES group (aOR = 0.7, 95% CI = 0.53, 0.96. P-value = 0.02). Moreover, we found that a higher educational level was associated with a lower inclination toward vaccination. Compared to participants with postgraduate degrees, participants whose educational level was below high-school had the highest intention to receive the vaccine (aOR = 2.6, 95% CI = 1.7, 3.9, P-value < 0.001), than those with high-school diploma (aOR = 2.1, 95% CI = 1.4, 2.9, P-value < 0.001), and the lowest inclination was found among those with undergraduate degrees (aOR = 1.4, 95% CI = 1.01, 2.1, P-value = 0.04) in the total study population.
Additionally, the interview respondents with a positive NCD history had more than 1.5 times higher propensity for receiving the vaccine (aOR = 1.8, 95% CI = 1.1, 2.9. P-value = 0.01). In the online group, participants with positive history of NCDs reported 3.3 times higher positive attitudes toward vaccination (aOR = 3.3, 95% CI = 1.5, 7.2. P-value = 0.003).
In the study population, respondents with a positive history of NCDs in their first-degree relatives and at least one family member with COVID-19 had 1.4 times greater tendency for vaccination than other groups. (aOR = 1.4, 95% CI = 1.1, 1.8. P-value = 0.02 and aOR = 1.4, 95% CI = 1.1, 1.9. P-value= 0.03, respectively). In the interview group, those with a positive history of COVID-19 infection in their family were 1.8 times more willing to be vaccinated (aOR = 1.8, 95% CI = 1.2, 2.9. P-value = 0.01).
Assessing the association between the perceived susceptibility to COVID-19 infection in the next few months and the tendency toward vaccination, we found that in total and online groups, those who thought they were at risk for contracting the infection in the following months had a higher vaccination willingness. It is noteworthy that in both total and interview groups, participants who considered themselves at moderate risk for contracting the disease had a higher tendency toward vaccination. Moreover, a similar pattern was seen in the whole group and interview group respondents who believed that their family members were at high- or intermediate- risk of contracting COVID-19 in the following months. (Table 1).
4.4. Main Reasons for Participation in the COVID-19 Vaccination
We asked those determined to participate in the immunization program against COVID-19 what their main drivers were. In the entire study group, approximately half of the respondents believed that vaccination was effective in preventing COVID-19 mortality (n = 940, 52.1%), vaccination against COVID-19 decreased the transmissibility of COVID-19 (n = 880, 48.8%), and it could decrease economic loss (n = 718, 39.8%). Other mentioned reasons were fear of getting COVID-19 infection (n = 397, 22%) and being hospitalized due to corona virus-related morbidities (n = 397, 22%). Other stated drivers for inclination toward vaccination are demonstrated in Table 2. Among respondents who were interviewed, the three most common reasons for intention for vaccination were that vaccination was effective in preventing COVID-19 mortality (n = 682, 61.7%), and its potential to decrease economic loss (n = 494, 44.7%) and transmissibility of the virus (n = 449, 40.6%). In respondents who filled out the online questionnaire, the three most common reasons of intention to participate in vaccination included their belief that vaccination decreased the transmissibility of COVID-19 (n = 431, 61.7%), its effectiveness in preventing COVID-19 mortality (n = 258, 37%), and also decreased economic loss (n = 224, 32.1%). Other stated reasons are tabulated in Table 2.
Table 2.The Reasons Mentioned by the Respondents Who Were Determined to Participate in the Vaccination Program Against COVID-19 a
| Total (n = 1803) | Interview (n = 1105) | Online (n = 698) | |
|---|---|---|---|
| I am sure vaccination is effective and prevents COVID-19 mortality | 940 (52.1) | 682 (61.7) | 258 (37.0) |
| Vaccination against COVID-19 decreases the transmissibility of COVID-19 | 880 (48.8) | 449 (40.6) | 431 (61.7) |
| Vaccination against COVID-19 decreases economic loss | 718 (39.8) | 494 (44.7) | 224 (32.1) |
| I am afraid of getting COVID-19 | 397 (22.0) | 202 (18.3) | 195 (27.9) |
| I am afraid of hospitalization due to COVID-19 | 360 (20.0) | 250 (22.6) | 110 (15.8) |
| Vaccination against COVID-19 is better than being passive | 234 (13.0) | 91 (8.2) | 143 (20.5) |
| I believe that vaccination against COVID-19 is effective | 108 (6.0) | 42 (3.8) | 66 (9.5) |
| I want to prove that I am a risk-taker person | 18 (1.0) | 15 (1.4) | 3 (0.4) |
a All data is reported as frequency (%).
4.5. Main Reasons for COVID-19 Vaccine Opposition and Hesitancy
In the total study population, the two most common reasons which made participants reluctant to COVID-19 vaccination were that they thought they had a strong immune system that protected them from getting COVID-19 (n = 155, 57.8%), and vaccination against COVID-19 would not decrease the risk of disease transmissibility (n = 118, 44%). Other less frequently mentioned reasons were the immediate (n = 38, 14.2%) and long-term side effects of vaccines (n = 38, 14.2%) and their inefficacy (n = 36, 13.4%). Several less frequently mentioned reasons are demonstrated in Table 3.
Table 3.The Reasons Mentioned by the Respondents Who Were Indecisive or Were Determined not to Participate in Vaccination Program Against COVID-19 a
| Total (n = 268) | Interview (n = 140) | Online (n = 128) | |
|---|---|---|---|
| My immune system is strong enough to protect me from COVID-19 | 155 (57.8) | 72 (51.4) | 83 (64.8) |
| Vaccination against COVID-19 will not decrease the risk of its transmissibility | 118 (44.0) | 64 (45.7) | 54 (42.2) |
| Vaccination against COVID-19 has many side effects | 38 (14.2) | 18 (12.9) | 20 (15.6) |
| Vaccination against COVID-19 has unknown post-marketing side effects | 38 (14.2) | 25 (17.9) | 13 (10.2) |
| Vaccination against COVID-19 has no efficacy | 36 (13.4) | 24 (17.1) | 12 (9.4) |
| I have a negative attitude toward any kind of vaccine | 27 (10.1) | 7 (5.0) | 20 (15.6) |
| I prefer natural immunization to get the infection | 21 (7.8) | 11 (7.9) | 10 (7.8) |
| I will not get COVID-19 because I use all preventive measures | 20 (7.5) | 10 (7.1) | 10 (7.8) |
| In the scarcity of vaccines, high risk groups have higher priority than me | 18 (6.7) | 6 (4.3) | 12 (9.4) |
| I believe in destiny, so vaccination does not protect me | 12 (4.5) | 3 (2.1) | 9 (7.0) |
| I do not care about COVID-19 | 12 (4.5) | 3 (2.1) | 9 (7.0) |
| Vaccination is contraindicated for me because I am immune-comprised | 11 (4.1) | 6 (4.3) | 5 (3.9) |
| I am immune against COVID-19 because I have natural immunity through getting COVID-19 | 10 (3.7) | 5 (3.6) | 5 (3.9) |
| Vaccination against COVID-19 is not affordable for me | 4 (1.5) | 2 (1.4) | 2 (1.6) |
a All data are reported as frequency (%).
In respondents who were interviewed, the most frequently mentioned reasons for reluctance or indecisiveness for vaccination were their trust in their robust immune systems (n = 72, 51.4%), their belief that vaccination could not decrease the risk of COVID-19 transmissibility (n = 64, 45.7%), the vaccine unknown post-marketing side effects (n = 25, 17.9%), and unreliable vaccine efficacy (n = 24, 17.1%).
In the respondents who filled out the online questionnaire, the four most highly mentioned reasons for their unwillingness to vaccination were that they believed that their robust immune system would protect them from getting COVID-19 (n = 83, 64.8%), vaccination would not decrease the transmissibility risk (n = 54, 42.2%), the vaccine side effects (n = 20, 15.6%), and their negative attitude toward all vaccines (n = 20, 15.6%) (Table 3).
5. Discussion
The results of the present study revealed that there was a significant association between a positive intention for vaccination against COVID-19 and the respondent’s SES, level of education, having a positive history of NCDs in themselves and their first-degree families, perceived susceptibility for COVID-19 infection in the following few months in themselves and their close family members, and being a healthcare worker. Additionally, we found that a higher proportion of interviewed respondents intended to take the vaccine than those who filled out the online questionnaire. In the mentioned three study groups, most respondents were determined to receive the COVID-19 vaccine because they believed that vaccination effectively prevented mortality and decreased the transmissibility of the COVID-19 infection.
Nonetheless, some recent studies observed a relationship between the participants’ gender and their positive attitudes toward vaccination (28-30). Consistent with our results, Olagoke et al., Malik et al., and Eguia et al. reported no significant differences between men and women in their propensity to get the COVID-19 vaccine (31-33). This may be attributed to differences in the characters and cultures of the study subjects.
Although Fonzo et al. reported that the education levels of the family members had no impact on the intention to take the vaccine (34), our survey revealed that respondents with a lower level of education were more than twice as likely to take the vaccine as those with a higher education level. Fonzo et al. and Askarian et al. reported that having at least one healthcare professional parent did not impact the respondents’ willingness to take the vaccine (34, 35). Moreover, in line with a study by Detoc et al. (28), the present study showed that healthcare workers were twice more willing to take the vaccine. This may be attributed to the fact that healthcare workers were better informed about the process, efficacy, and safety of the COVID-19 vaccine, which led to their increased willingness to receive the vaccine.
We observed that respondents with high SES had a lower tendency to participate in the immunization program than those from middle or low socio-economic classes. In contrast to our results, Lazarus et al. investigated more than 13.000 people in 19 countries to assess the potential compliance with the COVID-19 vaccination and reported that respondents with higher incomes were more apt to take the vaccine than those with lower incomes (30). Moreover, Paul et al. reported that UK adults from low SES were less willing to take the vaccine than adults with high SES (36). One hypothesis in this regard could be that the participants with high SES were more concerned about the vaccine’s side effects, as the current study was conducted before the distribution of the COVID-19 vaccine in Iran.
The current survey results revealed that many respondents wished to participate in the immunization program because they believed that vaccination was effective in preventing COVID-19 mortality, decreasing the transmissibility of the disease, and may reduce the costs involved. Consistent with this result, Wang et al. reported that COVID-19 vaccination effectively prevented and controlled COVID-19 infection (37).
Concerns about vaccines (vaccine hesitancy) are not new, and vaccine safety concerns are growing worldwide, particularly regarding the COVID-19 vaccine (35). Several previous studies reported that the low rate of intention to take vaccines against pandemics infections such as influenza A (H1N1) and non-pandemic ones like human papillomavirus (HPV) can mainly be attributed to low confidence in vaccine efficacy, safety, and side effect profiles (35, 38-40). On the other hand, we observed that the main reasons respondents were indecisive or reluctant to participate in the COVID-19 vaccination were their exaggerated confidence in their robust immune system, which they believed could protect them from contracting COVID-19. They also believed that vaccination could not decrease the risk of disease transmissibility. Notwithstanding these results, Eguia et al. investigated COVID-19 vaccine hesitancy in the Spanish population through online questionnaires and reported that concerns about the vaccination's effectiveness, safety, and significant side effects were the main reasons expressed by the reluctant respondents (33). However, Paul et al. reported that the major causes of adult UK citizens’ unwillingness to take the vaccine were the possible unpredictable adverse effects and consequences of the COVID-19 vaccine (36). In the current study, the vaccines' immediate and long-term side effects and perceived inefficacy were the least frequently expressed reasons for their reluctance or indecisiveness in receiving COVID-19 vaccination.
One of the main strengths of our survey is that we included three groups of respondents (online, interviewed, and total) who were willing or unwilling to get vaccinated. We observed that generally, respondents who were interviewed were more inclined to take the vaccine due to the positive influence of several factors (such as being a healthcare worker, having a positive history of NCDs, COVID-19 infection in their family, high- and intermediate- the risk of getting COVID-19 disease in the next few months in their family member).
The present study had several limitations. The most prominent limitation was an online approach for provinces other than Fars, where a convenience sample of online social network users participated. Therefore, the convenience sample selected most participants from younger age groups or those who used social media, and therefore, the result cannot be extrapolated to the whole Iranian population. Besides, this study was conducted before the distribution of the COVID-19 vaccine in Iran; therefore, most participants were unaware of the real advantages and disadvantages. Another limitation was that the interview approach was conducted in Shiraz, the fifth most populous city in Iran. Therefore, the study population was not representative of the whole Iranian population as it included neither citizens of other cities nor rural areas.
Our findings demonstrated that several factors might influence respondents’ willingness or reluctance to take the vaccine. We recommend that policymakers, health professionals, and international organizations of all countries should be prepared to overcome hesitancy and build vaccine literacy in their populations based on their knowledge, occupation, SES, and other significant variables analyzed in this study. Moreover, we suggest that a more extensive study with different types of questionnaires (online and interviewed) in different countries should be adopted to compare the association between the investigated factors and the intention to take the COVID-19 vaccine.
5.1. Conclusions
The results of this study demonstrated that several variables such as SES, education level, positive history of NCDs, perceived susceptibility to COVID-19 infection, and being a healthcare professional had a positive association with the intention to be vaccinated against COVID-19. Additionally, many respondents were willing to participate in the immunization program because they believed that vaccination was effective in preventing COVID-19 mortality, decreasing the transmissibility of COVID-19, and lowering the costs involved.