


1. Background
As one of the most fundamental causes of wide-spreading non-communicable diseases, obesity is considered as one of the crucial issues, which has captured scientists’ attention in medicine. According to one study (1), 65% of the world’s population live in countries where obesity and overweightness cause more death than being underweight (2). Obesity is regarded as a common illness in the 21st century. In developing countries, obesity is still increasing, particularly among youth. The World Health Organization (WHO) has estimated that more than one billion adults in the world are overweight and 300 million are obese. Obesity increases the risk of chronic illnesses, such as type 2 diabetes, heart disease, high blood pressure, brain stroke, high cholesterol, joint disorders, asthma, and specific types of cancers (3). It is estimated that 2.8 million adults die annually due to obesity. Furthermore, 44% of diabetes, 23% of heart diseases and between 7% and 41% of some cancers develop owing to obesity (2). Obese people are more in danger due to an unnatural increase in harmful fat, such as low-density lipoprotein (LDL) and triglycerides (4). Lifestyle changes, such as low-calorie diets and increased physical activity, have been recommended as primary interventions to reduce excess body weight and fat (5). Moreover, one of the methods of obesity treatment has focused on cumulative physical activity and exercise (6). One of the forms of physical exercise is resistance training, which helps to shed excess weight in an optimum way and reduces LDL and cholesterol, while it increases high-density lipoprotein (HDL) (7). Regular physical exercise has a number of benefits, such as a reduction in extra fat, excess weight, and high blood pressure (8). In spite of this fact, there are also some contradictory results (7, 9). In addition, green tea has an impact on the lipid level, blood fats, and BMI (10). Some studies have revealed that green tea extract influences fat emulsification, activity inhibition, and lipid synthesis. Moreover, it has thermogenic properties, which leads to an increase in energy consumption. In addition, it brings about a dramatic increase in both fat oxidation and round-the-clock energy consumption (11). Research findings have demonstrated that ingesting tea rich in catechins reduces triglyceride and total cholesterol (TC), prevents the accumulation of body and liver fat, and stimulates thermogenesis (12, 13). Overall, some studies have confirmed the effect of green tea catechins on the body composition percentage and body fat percentage while this effect has not been confirmed by some other studies (14, 15). While conducting the present study (15), results of numerous studies were considered and it was identified that there was a lack of research on the combined effect of resistance training regimen and green-tea supplement consumption on the lipid profile and anthropometric indices in males with obesity and overweightness.
2. Objectives
This research aimed at exploring the combined effect of resistance training and green tea supplements on the lipid profile and anthropometric indices of overweight and obese males in a definite period of time.
3. Methods
The present study was a clinical trial. The population comprised all obese inactive males in Isfahan with age range of 34 ± 8, and with BMI of 29.88 ± 2.08 kg.m-2. The data collection methods were a questionnaire and a checklist. The former had been designed to evaluate the personal information and medical background. The latter attempted to record intended parameters before and after the intervention. In the study, 60 individuals, who had a BMI of over 25 kg.m-2, were in the age range of 27 to 42, and met the inclusion criteria were selected. The exclusion criteria included individuals with special diseases, such as diabetes mellitus and cardiovascular disease, persons employing only one weight reduction method, persons using medication, and persons following an exercise regimen. After receiving sufficient information about different phases of the research, they were asked to fill an informed consent. Then, the subjects were randomly (using a computer-generated randomization list) divided to four groups of 15, single blinding of the data analyst, namely the control group, green tea group, resistance training group, and the group which combined resistance training with green tea. The mean age, height, weight, and BMI of participants are presented in Table 1.
Table 1.Mean and Standard Deviation of Subjects’ Demographic Characteristics
| Variable | Group | P Value | |||
|---|---|---|---|---|---|
| Green Teaa | Exercisea | Exercise and Green Teaa | Controla | ||
| Age (y) | 33.99 ± 6.69 | 33.20 ± 4.35 | 36.45 ± 3.82 | 32.92 ± 3.21 | 0.408 |
| Height (cm) | 175.13 ± 4.09 | 176.89 ± 3.26 | 175.13 ± 7.47 | 178.44 ± 8.75 | 0.656 |
| Weight (kg) | 90.50 ± 8.57 | 94.44 ± 10.86 | 93.88 ± 6.66 | 86.56 ± 11.24 | 0.651 |
| BMI (kg.m-2) | 29.48 ± 2.19 | 30.16 ± 3.07 | 30.66 ± 2.34 | 28.05 ± 2.17 | 0.168 |
| Fat% | 26.32 ± 3.78 | 27.52 ± 4.83 | 26.55 ± 3.27 | 23.02 ± 1.76 | 0.066 |
| WHR | 0.97 ± 0.02 | 0.97 ± 0.03 | 0.95 ± 0.03 | 0.94 ± 0.03 | 0.134 |
| Cholesterol (mg.dL-1) | 198 ± 33.22 | 198.89 ± 19.27 | 211.63 ± 49.57 | 191.89 ± 23.29 | 0.664 |
| Triglyceride (mg.dL-1) | 179 ± 74.26 | 155 ± 59.28 | 197.63 ± 68.48 | 160 ± 72.43 | 0.575 |
| HDL (mg.dL-1) | 38.63 ± 3.58 | 38.56 ± 2 | 37.5 ± 4.14 | 37.89 ± 2.52 | 0.862 |
| LDL (mg.dL-1) | 121.38 ± 27.67 | 120 ± 18.60 | 136.75 ± 52.23 | 116.33 ± 24.09 | 0.601 |
aValues are expressed as mean ± SD.
Resistance training was done for eight weeks in 24 sessions. Each session lasted 90 minutes and included 15 minutes of warm-up exercises, 65 minutes of specific exercises, and 10 minutes of cool-down stretches. Moreover, the subjects of the relevant groups were invited to take a capsule containing 500 mg of powdered green tea leaves three times a day for eight weeks (green tea and combined resistance training with green tea groups) and the control and exercise group received cellulose capsules (placebo) at the same time. The control group continued with their everyday life without any change for eight weeks. The lipid profile, comprised of cholesterol, triglyceride, HDL, LDL, and anthropometric indices, consisting of the BMI, waist-to-hip ratio (WHR), and body fat percentage, before and after the intervention, were measured. In order to measure LDL, HDL, cholesterol, and triglyceride, standard kits from Pars Azmoon Company in Iran were used by utilizing the photometric method. The BMI was calculated by dividing the body weight (kg) by the body height (m) squared. The WHR was computed by dividing the waist circumference by the hip circumference. The fat percentage was estimated by dividing the body fat weight by the total body weight and multiplying the result of the fraction by 100 with clippers. Information on the subjects’ diet was recorded by the 24-hour dietary recall questionnaire during three days (two days earlier in the week and one day at the end of the week) by participants, in the special tab (16).
Daily energy consumption was assessed based on a self-report questionnaire as well as the Harris-Benedict equation (17, 18). It measures the amount of energy consumed based on height, weight, age and gender. One of the ways to lose weight is to lose 500 calories a day (19). Since physical activity increases calorie intake and because one of the goals of this study was to investigate pure and interactive effects of green tea and resistance training on dependent variables, by adding the energy consumed by resistance training and maintaining the diet, participants were able to measure this during possible interventions and administration of macronutrients based on the needs of the participants. Nonetheless, in order to reduce the intrusive variables, dietary recommendations and guidelines for macronutrients were presented to the participants. These recommendations consisted of consuming 55% carbohydrates, 30% fat, and 15% protein. The instructions included the use of compound carbohydrates, including disaccharides, polysaccharides and unsaturated fats. These controls were administered after the three-day diet, starting from four days before to end of the interventions.
The average calories consumed during training, based on the heart rate recorded during each session of training (including all exercises from warming to cooling), were around 1200 Kcal. This was done using heart rate (electronic pullover bracelet), and calculations were made based on gender, age, height, and weight data by the following formula. Measuring this amount of energy was necessary to understand the participants’ TDEE. Calorie calculation formula based on heart rate for males (20):
Calories = (0.634 × Heart Rate) + (0.404 × VO2 max) + (0.179 × Weight) + (0.271 × Age) - 95.7735 × Time/4.184.
4. Results
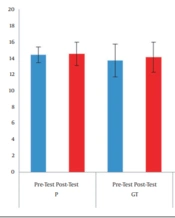
The results of analysis of variance (ANOVA) test showed that there was no significant difference between the groups for the pre-test values in the measured variables (P > 0.05).
After the eight-week intervention, the results revealed that the average body fat percentage of the group with resistance training and green tea consumption had significantly decreased (P = 0.007). The average body fat percentage also decreased in both the resistance training group and the green tea group, however, it increased in the control group. In spite of this, it was not statistically significant in any of them (Table 2). The average BMI in the resistance training group and the group combining resistance training with green tea decreased considerably (P < 0.05). This average decreased in the green tea group yet was statistically insignificant (P = 0.12) (Table 2). The average WHR decreased considerably (P = 0.01) in the group combining resistance training with green tea, after eight weeks. Nevertheless, this average in other groups did not show any change (Table 2). The average total plasma cholesterol in the green tea group, resistance training group, and the group combining resistance training with green tea was reduced yet in the control group, it increased. Nonetheless, it was not significant in any of these groups (Table 2). The average triglyceride decreased in the green tea group, resistance training group, and the group combining resistance training with green tea. Nevertheless, it decreased significantly only in the group combining resistance training with green tea (P = 0.01); however, it increased in the control group yet it was statistically insignificant (Table 2). The average plasma HDL in the green tea group, resistance training group, and the group combining resistance training with green tea increased yet this increase was significant only in the green tea group and the group combining resistance training with green tea (P < 0.05) (Table 2). The average plasma LDL in the green tea group, resistance training group, and group combining resistance training with green tea was reduced yet in the control group, it increased. However, the difference was not significant in any of them (Table 2).
Table 2.Comparison of Physiological and Anthropometric Variables of Subjects in Different Groups
| Variable, Group | Measuring Time | P1 | P2 | |
|---|---|---|---|---|
| Pre-Test | Post-Test | Intergroup | Between Group | |
| Fat (%) | 0.11 | |||
| Green tea | 26.32 ± 3.78 | 26.2 ± 3.67 | 0.17 | |
| Exercise | 27.52 ± 4.83 | 27.3 ± 4.87 | 0.10 | |
| Exercise and green tea | 26.55 ± 3.27 | 25.41 ± 3.14 | 0.007a | |
| Control | 23.02 ± 1.76 | 23.18 ± 1.82 | 0.08 | |
| BMI (kg.m-2) | 0.368 | |||
| Green tea | 29.48 ± 2.19 | 29.37 ± 2.08 | 0.12 | |
| Exercise | 30.16 ± 3.07 | 29.93 ± 2.96 | 0.04a | |
| Exercise and green tea | 30.66 ± 2.34 | 29.88 ± 2.22 | 0.01a | |
| Control | 28.05 ± 2.17 | 28.11 ± 2.20 | 0.11 | |
| WHR | 0.093 | |||
| Green tea | 0.97 ± 0.02 | 0.97 ± 0.02 | 0.35 | |
| Exercise | 0.97 ± 0.03 | 0.97 ± 0.03 | 0.19 | |
| Exercise and green tea | 0.95 ± 0.03 | 0.94 ± 0.03 | 0.01a | |
| Control | 0.94 ± 0.03 | 0.94 ± 0.03 | 1 | |
| Cholesterol (mg.dL-1) | 0.33 | |||
| Green tea | 198 ± 33.22 | 194.25 ± 28.06 | 0.19 | |
| Exercise | 198.89 ± 19.27 | 180.56 ± 32.09 | 0.12 | |
| Exercise and green tea | 211.63 ± 49.57 | 194.25 ± 28.94 | 0.31 | |
| Control | 191.89 ± 23.29 | 205.11 ± 20.34 | 0.08 | |
| Triglyceride (mg.dL-1) | 0.734 | |||
| Green tea | 179 ± 74.26 | 163.75 ± 67.32 | 0.06 | |
| Exercise | 155 ± 59.38 | 144.44 ± 63.85 | 0.41 | |
| Exercise and green tea | 197.63 ± 68.48 | 139.12 ± 36.06 | 0.01a | |
| Control | 160 ± 72.43 | 170.77 ± 89.03 | 0.52 | |
| HDL (mg.dL-1) | 0.142 | |||
| Green tea | 38.63 ± 3.58 | 43.75 ± 5.12 | 0.001a | |
| Exercise | 38.56 ± 2 | 39 ± 5.56 | 0.81 | |
| Exercise and green tea | 37.5 ± 4.14 | 41.38 ± 3.70 | 0.000a | |
| Control | 37.89 ± 2.52 | 38.89 ± 4.40 | 0.43 | |
| LDL (mg.dL-1) | 0.572 | |||
| Green tea | 121.38 ± 7.67 | 115.13 ± 3.89 | 0.21 | |
| Exercise | 120 ± 18.60 | 117.13 ± 13.26 | 0.5 | |
| Exercise and green tea | 136.75 ± 52.23 | 116.75 ± 26.60 | 0.29 | |
| Control | 116.33 ± 24.09 | 128.33 ± 21.67 | 0.06 | |
aP ≤ 0.05.
Table 3.Comparison of Percentage or Mean and SD of Daily Calorie Intake in Studied Groups and Standard
| 3-Days Diet Record | P Valuea | From 4-Day Before the Intervention Until the End of the Intervention | |||
|---|---|---|---|---|---|
| Saturdayb | Sundayb | Fridayb | All Group | ||
| Total energy intake (kcal) | 3550 ± 180.5 | 3830 ± 172.5 | 3900 ± 190.5 | 0.46 | 3850 kcal |
| Carbohydrate | 1739.5 kcal; 434.9 gr; 49.8% total energy | 1915 kcal; 478.8 gr; 50.8% total energy | 2016.5 kcal; 504.1 gr; 51.8% total energy | 0.64 | 2120 kcal; 530 gr; 55. % total energy |
| Fat | 1334.8 kcal; 148.3 gr; 37.6% total energy | 1478.5 kcal; 164.3 gr; 38.6% total energy | 1388.5 kcal; 154.3 gr; 35.6% total energy | 0.57 | 1150 kcal; 130 gr; 30 % total energy |
| Protein | 482.8 kcal; 12.7 gr; 13.6% total energy | 482.6 kcal; 120.6 gr; 12.6% total energy | 514.8 kcal; 128.7 gr; 13.2% total energy | 0.58 | 575 kcal; 145 gr; 15 % total energy |
aSignificance level of P < 0.05.
bValues are expressed as mean ± SD.
5. Discussion
This research demonstrated that combining resistance training with green tea could result in a considerable reduction in the body fat percentage, BMI, WHR, and triglyceride and a significant increase in HDL. Haghighi et al. (4) investigated the effect of the eight-week aerobic exercise and green tea consumption on the body fat percentage and serum lipid profile of overweight and obese females and indicated that there was a substantial decrease in the body weight and fat percentage, although there was no considerable effect on the BMI. Cardoso et al. (9) analyzed the effect of resistance training and green tea consumption on body composition and resting metabolic rate (RMR) in obese or overweight females. The results showed an increase in the RMR, lean body mass, and muscle strength and a decrease in the body fat percentage and waist circumference in the group, which combined green tea with resistance training, as compared with the other groups; however, the BMI showed no significant variation. In contrast, Phung et al. (21) indicated that the ingestion of green tea catechins with caffeine, at a dose ranging from 583 to 714 mg/d for 12 weeks, had a significant influence on BMI, body weight, and waist circumference. Nevertheless, no influence was found on the WHR. In the present study, the decrease in the body fat and WHR was consistent with the findings presented by Haghighi et al. (4) and Cardoso et al. (9), yet in contrast with those by Phung et al. (21) On the other hand, the significant decrease in the BMI was inconsistent with the findings by Haghighi et al. (4)and Cardoso et al. (9), yet consistent with the findings by Phung et al. (21). This difference probably arises from the intensity and type of training, amount of green tea consumption, and gender in the examined group. It seems that the cause of the effect on BMI in this study was the increase of thermogenesis and increased oxidation of lipids by green tea and increased energy consumption with resistance training (11). Another result of the combined effect of resistance training and green tea supplements for a definite period on the lipid profile and insulin resistance in overweight and obese males was the significant decrease in triglyceride and the considerable increase in HDL. Epidemiological studies showed the effect of the reduction in TC, triacylglycerol (TG), and plasma LDL due to green tea consumption (16). Hosein Zade et al. (14), in a study in 2009, demonstrated that the consumption of capsules containing 500 mg of green tea extract by patients with type 2 diabetes for eight weeks showed a significant variation in the reduction of the level of triglyceride, LDL, and TC. In a study on obese males, aged 18 to 27, who consumed green tea and did resistance training for eight weeks, Moradi et al. (22) indicated that cholesterol, LDL, and triglyceride decreased yet HDL increased significantly in the group combining resistance training with green tea consumption in comparison with the pre-test stage. Nevertheless, in the present study, there was no influence on cholesterol and LDL; however, the decrease in triglyceride and increase in HDL were consistent with these studies. In spite of this, the study by Haghighi et al. (4) indicated that eight-week aerobic exercise and green-tea supplement consumption had no considerable effect on serum LDL, HDL, TC, and triglyceride. Cunha et al. (23) suggested that the daily consumption of 400 mg.kg-1 body weight of green tea extract for eight weeks did not change TC and triglyceride significantly yet increased the HDL density, reduced the body weight and adipose tissue, and increased lipolytic pathways. Wang et al. cited in Abedi et al. (15) examined the effect of various doses of caffeine and catechin-enriched green tea on the body composition of overweight subjects. The consumption of the mixtures 198 mg caffeine and 886 mg green tea, and 126 mg caffeine and 468 mg green tea for 90 days brought about no noticeable change in triglyceride, TC, LDL, and HDL. The lack of influence on cholesterol and LDL was consistent with the present study; however, the lack of influence on HDL and triglyceride could be due to a disregard for performing resistance training and consuming green tea, concomitantly. It must be recommended that, in order to explore the combined effect of green tea supplements, resistance training, and aerobic exercise in a longer period of time, certain studies should be carried out. To sum up, it could be suggested that overweight and obese males had benefited more from positive combined effects of resistance training and green tea and showed reduction in BMI, WHR, body fat percentage, and blood fats. The contradictory results in this regard are due to the type and intensity of exercise, the duration of the intervention, the type of samples, the type and composition of green tea. Obviously, more studies with longer interventions are required to support the findings of the present study.