

1. Background
With advancements in teaching technology, medical education has increasingly adopted digital media to enhance learning. One prominent approach is the flipped classroom model, where traditional teaching structures are inverted: Students acquire foundational knowledge through pre-class materials, typically delivered digitally, and use classroom time to deepen understanding through discussion and application (1). This model has gained widespread popularity in medical education due to its reported benefits, including improved self-directed learning, enhanced teacher-student interactions, increased student motivation, and better academic performance (2-4). By shifting initial learning outside the classroom, the flipped approach fosters cooperative learning, encourages active participation in class discussions, and allows instructors to monitor and advance students’ progress more effectively (5-7). Both students and professors report satisfaction with this method, as it enables practical application of knowledge and aligns with student-centered learning principles (8-10).
Despite these advantages, implementing the flipped classroom model requires careful consideration of institutional resources, faculty preparedness, and student readiness. Research suggests that learners must take an active role in their education for this method to succeed, rather than relying on traditional, professor-led instruction (11). While studies have demonstrated the effectiveness of flipped classrooms in various contexts (2, 3, 12), there remains a notable gap in understanding the feasibility of applying this method, particularly in resource-constrained or developing educational settings. For instance, some South Asian universities, including those in developing countries, face challenges such as limited technological infrastructure and inadequate training, which hinder the adoption of flipped classroom strategies (13). This suggests that the success of the model cannot be assumed universally and must be tested in specific contexts.
In Iran, where medical education is evolving to meet global standards, little is known about whether the flipped classroom can be effectively implemented in universities with varying levels of technological and pedagogical support. Kermanshah University of Medical Sciences, located in a region with unique socioeconomic and infrastructural characteristics, exemplifies this uncertainty. Although the flipped classroom holds promise for enhancing medical education, its feasibility in this setting — considering factors such as access to digital tools, student preparedness, and faculty expertise — remains underexplored. Therefore, this study was designed to investigate the feasibility of implementing the flipped classroom teaching method at Kermanshah University of Medical Sciences, addressing a critical need to evaluate whether this innovative approach can be adapted to local conditions and contribute to improving medical education in similar contexts.
2. Objectives
Given the importance of the flipped classroom teaching method in improving the quality of learning and the lack of optimal conditions for its implementation, this study aimed to evaluate the feasibility of implementing the flipped classroom teaching method at Kermanshah University of Medical Sciences.
3. Methods
This study employed a descriptive cross-sectional survey design to assess the feasibility of implementing the flipped classroom teaching method at Kermanshah University of Medical Sciences. The statistical population consisted of 230 faculty members with experience teaching theoretical courses in medical education. From this population, a sample of 120 participants was selected using a convenience sampling method due to logistical constraints and the availability of faculty during the study period.
Data were collected using a researcher-developed questionnaire titled "Feasibility of Implementing the Flipped Classroom", designed to evaluate key factors influencing the adoption of this teaching method. The questionnaire comprised 30 items divided into six components: Curriculum factors (questions 1 - 5), educational equipment and tools (questions 6 - 10), faculty member capabilities (questions 11 - 15), student-related factors (questions 16 - 20), educational rules and regulations (questions 21 - 25), and access to electronic resources (questions 26 - 30). Each item was scored on a 5-point Likert scale (1 = strongly disagree, 2 = disagree, 3 = neutral, 4 = agree, 5 = strongly agree).
The questionnaire’s validity was established through face validity, assessed by a panel of five experts in medical education and survey design, and construct validity, confirmed via exploratory factor analysis to ensure items aligned with their intended components. Reliability was evaluated using Cronbach’s alpha, yielding an overall coefficient of 0.91, indicating high internal consistency. Component-specific reliability coefficients were as follows: Curriculum factors (0.74), educational equipment and tools (0.81), faculty capabilities (0.81), student-related factors (0.87), educational rules and regulations (0.76), and access to electronic resources (0.80).
Data collection occurred over a one-month period, during which faculty members completed the questionnaire either in person or online, depending on their availability. Descriptive statistics, including means and standard deviations, were calculated to summarize responses. For inferential analysis, the normality of quantitative variables was tested using the Shapiro-Wilk test. Although some variables in certain subgroups did not meet normality assumptions, the sample size (n = 120) was deemed sufficient, and variances across groups were homogeneous (confirmed via Levene’s test), justifying the use of parametric tests due to their greater statistical power. Consequently, independent t-tests were used to compare findings across binary variables (e.g., gender), one-way analysis of variance (ANOVA) was applied to assess differences across multi-level variables (e.g., years of teaching experience), and Tukey’s post hoc test was conducted to identify specific group differences where ANOVA results were significant. All analyses were performed using SPSS version 18.
4. Results
The study included 120 faculty members, of whom 28.3% (n = 34) were women and 71.7% (n = 86) were men. Participants’ academic ranks were distributed as follows: 24.4% (n = 29) were instructors, 42.9% (n = 51) were assistant professors, 23.5% (n = 28) were associate professors, and 9.2% (n = 11) were professors. Teaching experience varied: 30.2% (n = 36) had less than 5 years, 22.7% (n = 27) had 5 - 9 years, 16.0% (n = 19) had 10 - 14 years, 5.5% (n = 7) had 15 - 19 years, and 25.2% (n = 30) had 20 or more years. Educational groups and fields of study are detailed in Table 1, with notable representation from paramedicine (28.6%, n = 34), basic medical sciences (15.1%, n = 18), and nursing and midwifery (14.4%, n = 17).
| Variables | No. (%) |
|---|---|
| Curriculum factors | |
| Nursing | 7 (5.9) |
| Midwifery | 5 (4.2) |
| Paramedicine | 34 (28.6) |
| Statistics and epidemiology | 8 (6.7) |
| Health | 12 (10.1) |
| Nutrition | 8 (6.7) |
| Dentistry | 8 (6.7) |
| Pharmacy | 12 (10.1) |
| Basic medical sciences | 18 (15.1) |
| Islamic teachings | 3 (2.5) |
| Other | 4 (3.4) |
| Fields of study | |
| Paramedicine | 10 (8.5) |
| Nursing and midwifery | 17 (14.4) |
| Humanities | 6 (5.1) |
| Health | 14 (11.9) |
| Rehabilitation | 3 (2.5) |
| Basic medical sciences | 19 (16.1) |
| Statistics and epidemiology | 8 (6.8) |
| Pharmacy | 12 (10.2) |
| Dentistry | 8 (6.8) |
| Nutrition | 8 (6.8) |
| Medical physics | 5 (4.2) |
| Information technology | 1 (0.8) |
| Laboratory science | 2 (1.7) |
| Clinical psychology | 3 (2.5) |
| Other | 2 (1.7) |
Questionnaire responses were analyzed for six components, with means, standard deviations, and ranges calculated (Table 2). The "curriculum factors" component (n = 119) had a mean of 18.09 (SD = 3.01, range = 11 - 25), indicating above-average availability. Other components scored below the midpoint of 15: "Educational equipment and tools" (n = 120, M = 14.12, SD = 4.30, range = 5 - 25), "faculty capabilities" (n = 120, M = 14.79, SD = 3.20, range = 5 - 24), "student activity" (n = 120, M = 13.37, SD = 3.62, range = 5 - 22), "educational rules and regulations" (n = 120, M = 13.72, SD = 3.40, range = 5 - 21), and "Internet access" (n = 120, M = 13.37, SD = 3.73, range = 5 - 21).
| Components | Mean ± SD | Mean Difference Confidence Interval (95%) | t | P-Value |
|---|---|---|---|---|
| Curriculum | 18.09 ± 3.01 | 3.09 (2.54 to 3.63) | 11.27 | > 0.0001 |
| Educational equipment and supplies | 14.12 ± 4.30 | -0.88 (-0.10 to -1.66) | -2.25 | 0.026 |
| Abilities of professors | 14.79 ± 3.20 | -0.21 (0.37 to -0.79) | -0.712 | 0.478 |
| Student activity | 13.37 ± 3.62 | -1.63 (-0.98 to -2.28) | -4.94 | > 0.001 |
| Educational rules and regulations | 13.72 ± 3.40 | -1.28 (-0.67 to -1.89) | -4.13 | > 0.001 |
| Internet access | 13.37 ± 3.73 | -1.62 (-0.95 to -2.29) | -4.78 | > 0.001 |
Normality was assessed using the Shapiro-Wilk test; although some variables deviated from normality, the sample size (n = 120) and homogeneous variances (via Levene’s test) supported the use of parametric tests. One-sample t-tests compared component means to a test value of 15 (the scale midpoint). Curriculum factors (M = 18.09, P < 0.0001) significantly exceeded 15, while educational equipment (M = 14.12, P < 0.05), student activity (M = 13.37, P < 0.001), rules and regulations (M = 13.72, P < 0.001), and internet access (M = 13.37, P < 0.001) were significantly below 15. Faculty capabilities (M = 14.79, P > 0.05) did not differ significantly from 15 (Table 2). Therefore, curriculum factors were rated as highly feasible, faculty capabilities as average, and other components as below average for implementing the flipped classroom.
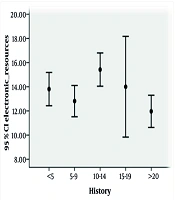
Independent t-tests showed no significant gender differences in component scores (P > 0.05 for all, Table 3). One-way ANOVA examined differences by teaching experience. No significant differences emerged for curriculum, equipment, faculty capabilities, student activity, or rules and regulations (P > 0.05), but internet access scores varied significantly (P = 0.02, Table 4). Tukey’s post hoc test revealed that professors with 10 - 14 years of experience (M = 15.42) rated internet access higher than those with 20+ years (M = 11.97, P = 0.013), as shown in Table 5 and Figure 1 (95% CI).
| Components and Gender | Mean ± SD | t | P-Value |
|---|---|---|---|
| Curriculum | 0.057 | 0.954 | |
| Female | 18.12 ± 3.51 | ||
| Male | 18.08 ± 2.82 | ||
| Educational equipment and supplies | 0.048 | 0.961 | |
| Female | 14.15 ± 3.89 | ||
| Male | 14.1 ± 4.47 | ||
| Abilities of professors | 0.005 | 0.996 | |
| Female | 14.79 ± 3.28 | ||
| Male | 14.79 ± 3.19 | ||
| Student activity | -1.032 | 0.304 | |
| Female | 12.82 ± 4.06 | ||
| Male | 13.58 ± 3.44 | ||
| Educational rules and regulations | 0.811 | 0.419 | |
| Female | 14.12 ± 3.01 | ||
| Male | 13.56 ± 3.55 | ||
| Internet access | 0.447 | 0.656 | |
| Female | 13.62 ± 3.14 | ||
| Male | 13.28 ± 3.95 |
| Components and Sources Change | Sum of Squares | Mean Squares | F | P-Value |
|---|---|---|---|---|
| Curriculum | 1.126 | 0.348 | ||
| Between groups | 40.81 | 10.2 | ||
| Within a group | 1033.17 | 9.06 | ||
| Total | 1073.98 | |||
| Educational equipment and supplies | 1.07 | 0.377 | ||
| Between groups | 79.3 | 19.82 | ||
| Within a group | 2119.49 | 18.59 | ||
| Total | 2198.79 | |||
| Abilities of professors | 1.541 | 0.195 | ||
| Between groups | 62.61 | 15.65 | ||
| Within a group | 1157.7 | 10.15 | ||
| Total | 1220.32 | |||
| Student activity | 1.422 | 0.231 | ||
| Between groups | 74.22 | 18.55 | ||
| Within a group | 1487.77 | 13.05 | ||
| Total | 1561.98 | |||
| Educational rules and regulations | 2.06 | 0.090 | ||
| Between groups | 90.24 | 22.56 | ||
| Within a group | 1246.32 | 10.93 | ||
| Total | 1336.55 | |||
| Internet access | 2.99 | 0.02 | ||
| Between groups | 156.91 | 39.23 | ||
| Within a group | 1495.31 | 13.12 | ||
| Total | 1652.22 |
| Teaching Experience (y) and Groups | P-Value | Percent | Mean ± SD | Range |
|---|---|---|---|---|
| Less than 5 | 30.2 | 13.8 ± 4.07 | 5 - 21 | |
| 5 - 9 | 0.82 | |||
| 10 - 14 | 0.52 | |||
| 15 - 19 | 1 | |||
| More than 20 | 0.25 | |||
| 5 - 9 | 22.7 | 12.81 ± 3.27 | 6 - 20 | |
| Less than 5 | 0.82 | |||
| 10 - 14 | 0.12 | |||
| 15 - 19 | 0.94 | |||
| More than 20 | 0.9 | |||
| 10 - 14 | 16 | 15.42 ± 2.85 | 12 - 21 | |
| Less than 5 | 0.52 | |||
| 5 - 9 | 0.12 | |||
| 15 - 19 | 0.9 | |||
| More than 20 | 0.013 | |||
| 15 - 19 | 5.9 | 14 ± 4.51 | 8 - 21 | |
| Less than 5 | 1 | |||
| 5 - 9 | 0.94 | |||
| 10 - 14 | 0.9 | |||
| More than 20 | 0.67 | |||
| More than 20 | 25.2 | 11.97 ± 3.57 | 5 - 20 | |
| Less than 5 | 0.25 | |||
| 5 - 9 | 0.9 | |||
| 10 - 14 | 0.013 | |||
| 15 - 19 | 0.67 | |||
| Total | - | 100 | 13.39 ± 3.74 | 5 - 21 |

Scores related to internet access based on teaching experience based on the Confidence Interval Index
5. Discussion
The findings of this study provide insight into the feasibility of implementing the flipped classroom teaching method at Kermanshah University of Medical Sciences. The results indicate that conditions are favorable for implementation only in terms of curriculum-related factors, while other components — educational equipment, faculty capabilities, student activity, rules and regulations, and internet access — present significant barriers.
Curriculum factors achieved a mean score of 18.09 (SD = 3.01), significantly above the scale midpoint of 15 (P < 0.001) (Table 2), suggesting optimal readiness for flipped classroom adoption. This aligns with prior research by Chen Hsieh et al., who found that flipped teaching enhances motivation and knowledge acquisition due to its alignment with familiar pedagogical structures, merely shifting the location of content delivery and practice (14). The high curriculum readiness may reflect its flexibility, requiring minimal infrastructural change compared to other components, making it a practical starting point for implementation.
In contrast, faculty capabilities scored a mean of 14.79 (SD = 3.20), below the midpoint but not significantly so (P > 0.05) (Table 2), indicating an average level of preparedness. This could be attributed to the relative inexperience of the faculty, with 30.2% having less than 5 years of teaching experience (Table 5). Younger professors, while potentially adaptable, may lack the pedagogical expertise needed for flipped classroom facilitation, which demands skills in guiding active learning rather than traditional lecturing. This finding underscores the need for targeted training, especially given the faculty’s long-term influence on medical education.
Other components — educational equipment (M = 14.12, SD = 4.30), student activity (M = 13.37, SD = 3.62), rules and regulations (M = 13.72, SD = 3.40), and internet access (M = 13.37, SD = 3.73) — scored significantly below 15 (P < 0.05) (Table 2), indicating inadequate availability. This suggests that infrastructural and systemic barriers hinder flipped classroom adoption. The novelty of the method, as noted by Aboutaleb et al., may explain this unpreparedness; their study highlighted students perceiving flipped teaching as innovative yet unfamiliar, requiring significant adjustment (15). Similarly, research in developing contexts, such as South Asian universities, shows that limited equipment and training impede adoption (13), a challenge mirrored at Kermanshah.
Internet access, in particular, revealed disparities by teaching experience, with professors having 10 - 14 years of experience rating it higher than those with 20+ years (P = 0.013) (Table 5). This aligns with Macdonald and Poniatowska, who emphasized that younger educators, more familiar with technology, are better equipped for virtual teaching (16). In Iran, the lack of systematic virtual training programs for faculty exacerbates this gap, leaving older professors less prepared for flipped classroom demands. This finding highlights a generational divide in technological readiness, critical for a method reliant on digital pre-class materials.
Despite the flipped classroom’s proven benefits — such as enhanced engagement and learning outcomes (14, 15) — these results suggest that Kermanshah University is not yet fully equipped for its implementation beyond the curriculum. This echoes challenges in other developing regions (13), emphasizing the need for context-specific preparation. To address these barriers, we recommend: (1) Engaging educational technologists to develop digital content; (2) creating accessible video databases for faculty; and (3) implementing in-service training to build flipped classroom skills. Further research should explore these obstacles in depth and evaluate pilot implementations to refine this approach for local medical education.
