


1. Background
To improve the quality of clinical care for patients, clinical experience has been combined with research evidence in recent years. Evidence-based medicine (EBM) refers to the use of the best research evidence in clinical decision-making (1). The main goal of healthcare is to enhance the health of individuals, and EBM can help achieve this. EBM is a complex process that enables doctors to select the best possible solutions for their patients (2). In EBM, doctors make decisions through a process that involves searching for medical information, critically evaluating it, matching it to specific diseases, and ultimately judging and applying the best available evidence (3). Evidence-based medicine was first introduced in the 1980s at McMaster University in Canada. Since then, the number of published articles in the field of EBM has increased exponentially, and it has been widely accepted as a reliable approach, leading to ongoing discussions about how to refine the judgment process (4, 5). To accurately diagnose and treat diseases, doctors need training on how to conduct online searches, formulate clinical questions, critically review articles, apply concepts of clinical epidemiology in decision-making, and become familiar with key sources such as Cochrane or DARE. Few studies have examined doctors’ opinions about EBM in the Middle East. A 2004 study in Saudi Arabia found that only 40% of primary care physicians had learned about EBM (4). Similarly, a 2019 study conducted in Switzerland showed that only a minority (14.2%) of health professionals, including doctors, nurses, and pharmacists, utilized EBM in their professional practice. Many of these professionals expressed interest in EBM but ceased to use it due to a lack of knowledge and skills (6). Additionally, a study conducted on medical students by Hasabo et al. revealed that the majority of students had average or below-average skills related to EBM (7).
Medical residents are doctors who receive training in specialized departments under the close supervision of a professor. They play an important role in applying evidence-based medical concepts in their daily activities, making decisions, and transferring knowledge to medical students (8, 9). In this regard, understanding information literacy and familiarizing medical students with search engines, as well as with epidemiological and statistical concepts in EBM, can significantly enhance patient management and medical development. Information literacy includes searching the web, critically analyzing content, and utilizing digital resources for specific purposes (10). Various studies have explored the importance of information literacy in the application of EBM. The components of information literacy have been utilized to improve professional nursing skills. Additionally, several studies have highlighted the need for educational programs to enhance search and retrieval skills within nursing (11).
2. Objectives
The purpose of this study is to investigate how medical residents from different specialty fields at Zanjan University of Medical Sciences approach EBM and its use in decision-making. We will assess their familiarity with search engines as well as important epidemiological and statistical concepts in EBM. By understanding the current situation, we can identify the strengths and weaknesses of the studied population and plan to address their information needs while promoting the advancement of EBM.
3. Methods
The current cross-sectional study (ethics code: IR.ZUMS.REC.1400.384) was conducted with medical residents at Zanjan University of Medical Sciences. All medical residents studying in 2023 were considered and participated (N = 183). The inclusion criterion was a willingness to participate in the study and being an enrolled student at the time of this research. The exclusion criterion was failure to fully complete the questionnaire.
The questionnaire used in this study comprises three parts. The first part collected demographic and educational characteristics (age, gender, specialty, and academic year). The second part assessed information literacy using a Persian standard scale for Iranian college students, designed by Yazdani in 2012 (12). This scale is based on five standard capacities of information literacy confirmed by the Association of College and Research Libraries and consists of 30 items. These five capacities include: Information need (items 6, 7, 8, 9, and 10); information locating (items 11, 12, 13, 15, 16, 17, 22, 23, 24, and 27); information evaluation (items 25 and 26); information organization (items 14, 19, 20, 21, 28, 29, and 30); information exchange (items 1, 2, 3, 4, 5, and 18).
This questionnaire utilized a five-point Likert Scale: Very low (score 1), low (score 2), moderate (score 3), high (score 4), and very high (score 5). Cronbach's alpha coefficients for the components of information need, information locating, information evaluation, information organization, information exchange, and the overall scale were reported as 0.84, 0.87, 0.76, 0.84, 0.85, and 0.94, respectively (12).
The third part of the questionnaire included questions regarding the role of EBM in treating patients, clinical activities involving EBM, searching in search engines, familiarity with EBM, participation in EBM workshops, and familiarity with scientific resources such as Bandolier, EBM, Effective Health Care Bulletins, Cochrane Database of Systematic Reviews, Database of Abstracts of Reviews of Effectiveness, and Evidence-Based Purchasing. It also assessed familiarity with terms such as absolute risk, relative risk, systematic review, odds ratio, likelihood ratio (LR), meta-analysis, clinical efficacy, number needed to treat, confidence interval, heterogeneity, publication bias, relative risk reduction, and number needed to harm. The Cronbach's alpha coefficient was reported as 0.85 (8).
3.1. Statistical Analysis
The quantitative variables were described using the mean and standard deviation (SD), while the qualitative variables were presented as frequencies and percentages. Information literacy and its five components, as well as familiarity with sources and epidemiological and statistical concepts, were compared using an independent t-test, one-way ANOVA (with LSD post-hoc tests), and Welch’s test based on demographic and educational variables. The chi-square test was used to assess the effect of participation in the EBM workshop on the ability to present the correct definition of EBM. The association between information literacy and its five components with familiarity with sources and epidemiological and statistical concepts was assessed using Spearman correlation. The normality of information literacy and its five components, the number of sources utilized in clinical decision-making, and epidemiological and statistical concepts known by participants and that they could explain to others was assessed using the Kolmogorov-Smirnov test. Data were analyzed using IBM SPSS version 22 with a significance level of 0.05.
4. Results
The mean ± SD age was 30.64 (3.46) years, ranging from 27 to 60 years. The female-to-male ratio was 1.13 (97 females to 86 males). The majority of participants were aged between 27 and 29 years, studying in the internal medicine specialty, and in their first or second year of study (Table 1).
| Variables | Frequency (%) |
|---|---|
| Age (y) | |
| 27 - 29 | 75 (41.0) |
| 30 - 32 | 69 (37.7) |
| ≥ 32 | 39 (21.3) |
| Gender | |
| Female | 97 (53.0) |
| Male | 86 (47.0) |
| Specialty | |
| Internal medicine | 45 (24.6) |
| Cardiology | 25 (13.7) |
| Radiology | 21 (11.5) |
| Infectious disease | 6 (3.3) |
| Orthopedy | 8 (4.4) |
| Pediatrics | 13 (7.1) |
| Anesthesiology | 5 (2.7) |
| Surgery | 15 (8.2) |
| Psychiatry | 10 (5.5) |
| Neurology | 20 (10.9) |
| Obstetrics and gynecology | 15 (8.2) |
| Academic year | |
| 1 | 50 (32.8) |
| 2 | 59 (32.2) |
| 3 | 35 (19.1) |
| 4 | 29 (15.8) |
Demographic and Educational Characteristics
The mean ± SD scores for information need, locating, evaluation, organization, exchange, and the total score of information literacy were 2.99 ± 0.62, 3.02 ± 0.44, 3.00 ± 0.92, 3.02 ± 0.47, 2.98 ± 0.56, and 3.01 ± 0.24, respectively. The status of information literacy was above moderate, with the best performance in information locating and organization, and the weakest in information exchange. Table 2 shows the mean ± SD information literacy scores and its components based on demographic and educational characteristics. Significant differences were observed in the information organization component across different specialties (P = 0.046). According to LSD post-hoc tests, the score for information organization was significantly lower in the internal medicine specialty compared to cardiology (P = 0.005), radiology (P = 0.003), psychiatry (P = 0.046), and neurology (P = 0.013), while other differences were not significant (P > 0.05).
| Variables | Need | Locating | Valuation | Organization | Exchange | Total |
|---|---|---|---|---|---|---|
| Age (y) | ||||||
| 27 - 29 | 2.99 ± 0.63 | 3.06 ± 0.44 | 3.03 ± 0.78 | 2.92 ± 0.51 | 3.00 ± 0.51 | 3.00 ± 0.24 |
| 30 - 32 | 2.96 ± 0.54 | 3.01 ± 0.41 | 3.09 ± 1.05 | 3.09 ± 0.43 | 2.96 ± 0.51 | 3.02 ± 0.25 |
| ≥ 33 | 3.04 ± 0.73 | 2.96 ± 0.49 | 2.78 ± 0.94 | 3.07 ± 0.43 | 2.96 ± 0.72 | 2.99 ± 0.24 |
| Test statistics | 0.19 | 0.70 | 1.39 | 2.94 | 0.16 | 0.19 |
| P-value | 0.829 b | 0.497 b | 0.254 c | 0.055 b | 0.851 c | 0.831 b |
| Gender | ||||||
| Female | 3.01 ± 0.60 | 3.08 ± 0.42 | 3.00 ± 0.99 | 2.99 ± 0.49 | 3.05 ± 0.53 | 3.03 ± 0.24 |
| Male | 2.97 ± 0.64 | 2.96 ± 0.45 | 3.01 ± 0.84 | 3.05 ± 0.45 | 2.89 ± 0.59 | 2.97 ± 0.24 |
| Test statistics | -0.44 | -1.97 | 0.04 | 0.82 | -1.87 | -1.85 |
| P-value | 0.660 d | 0.051 d | 0.966 d | 0.416 d | 0.063 d | 0.066 d |
| Specialty | ||||||
| Internal medicine | 3.03 ± 0.64 | 3.03 ± 0.43 | 3.12 ± 0.94 | 2.82 ± 0.46 | 2.93 ± 0.56 | 2.97 ± 0.25 |
| Cardiology | 2.99 ± 0.55 | 3.07 ± 0.42 | 3.06 ± 0.93 | 3.11 ± 0.44 | 2.94 ± 0.59 | 3.05 ± 0.21 |
| Radiology | 2.94 ± 0.66 | 2.95 ± 041 | 3.05 ± 1.05 | 3.19 ± 0.49 | 3.01 ± 0.47 | 3.02 ± 0.29 |
| Pediatrics | 3.12 ± 0.42 | 3.08 ± 0.53 | 2.85 ± 1.07 | 3.00 ± 0.26 | 2.73 ± 0.69 | 2.98 ± 0.17 |
| Surgery | 2.84 ± 0.53 | 3.04 ± 0.61 | 2.93 ± 0.88 | 3.08 ± 0.42 | 3.02 ± 0.49 | 3.0 ± 0.28 |
| Psychiatry | 2.62 ± 0.49 | 2.73 ± 0.34 | 3.30 ± 0.92 | 3.14 ± 0.59 | 3.08 ± 0.47 | 2.92 ± 0.22 |
| Neurology | 2.96 ± 0.82 | 3.19 ± 0.42 | 3.02 ± 0.79 | 3.13 ± 0.49 | 2.88 ± 0.63 | 3.07 ± 0.29 |
| Obstetrics and gynecology | 2.96 ± 0.48 | 2.95 ± 0.34 | 2.53 ± 0.69 | 2.91 ± 0.53 | 3.13 ± 0.56 | 2.95 ± 0.19 |
| Other e | 3.26 ± 0.63 | 3.01 ± 0.40 | 2.95 ± 1.00 | 2.99 ± 0.42 | 3.16 ± 0.55 | 3.07 ± 0.23 |
| Test statistics | 1.16 | 1.14 | 0.89 | 2.04 | 0.89 | 0.87 |
| P-value | 0.327 b | 0.339 b | 0.616 b | 0.045 b | 0.525 b | 0.546 b |
| Academic year | ||||||
| 1 | 2.98 ± 0.63 | 3.02 ± 0.45 | 3.07 ± 0.76 | 2.89 ± 0.47 | 2.92 ± 0.52 | 2.97 ± 0.20 |
| 2 | 3.01 ± 0.56 | 3.07 ± 0.45 | 2.94 ± 0.93 | 3.05 ± 0.45 | 3.03 ± 0.54 | 3.04 ± 0.24 |
| 3 | 2.99 ± 0.66 | 2.97 ± 0.43 | 2.85 ± 1.06 | 3.12 ± 0.50 | 3.00 ± 0.70 | 3.01 ± 0.30 |
| 4 | 2.99 ± 0.66 | 3.00 ± 0.42 | 3.17 ± 1.05 | 3.10 ± 0.44 | 2.95 ± 0.51 | 3.02 ± 0.25 |
| Test statistics | 0.03 | 0.37 | 0.80 | 2.34 | 0.47 | 0.91 |
| P-value | 0.993 b | 0.778 b | 0.496 b | 0.075 b | 0.700 b | 0.436 b |
Comparison of Mean ± SD Information Literacy and Its Components by Demographic and Educational Characteristics a
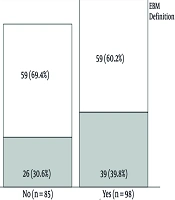
Of the 183 participants, 98 (53.9%) attended the EBM workshop. In contrast, 65 (35.5%) participants were able to correctly define EBM. Those who participated in the EBM workshop had a higher correct definition rate than those who did not participate (Figure 1), though this difference was not significant (χ2 = 1.68, P = 0.680). To answer questions related to patient care, 33 ± 18.0% referred to a peer or asked professors, 53 ± 29.0% searched the Internet, 29 ± 15.8% looked up medical journals, 36 ± 19.7% referred to reference books, and 32 ± 17.5% used abridged translations of reference books.
 of Evidence-based medicine (EBM) definition based on attendance in the EBM workshop.")
Frequency (percentage) of Evidence-based medicine (EBM) definition based on attendance in the EBM workshop.
According to Table 3, the most commonly utilized sources in clinical decision-making were the Database of Abstracts of Reviews of Effectiveness and Evidence-Based Medicine, while the least commonly used source was the Cochrane Database of Systematic Reviews.
| Sources | Uninformed | Know But Don't Use It | Don't Read | Use It in Clinical Decision-Making |
|---|---|---|---|---|
| Bandolier (published in Oxford) | 49 (26.8) | 32 (17.5) | 56 (30.6) | 46 (25.1) |
| Evidence-based medicine (BMJ publishing group) | 45 (24.6) | 38 (20.8) | 49 (26.8) | 51 (27.9) |
| Effective health care bulletins (universities of Leeds and York) | 40 (21.9) | 59 (32.2) | 40 (21.9) | 44 (24.0) |
| Cochrane database of systematic reviews (part of Cochrane library) | 48 (26.2) | 44 (24.0) | 56 (30.6) | 35 (19.1) |
| Database of abstracts of reviews of effectiveness (part of Cochrane library) | 42 (23.0) | 46 (25.1) | 44 (24.0) | 51 (27.9) |
| Evidence-based purchasing (south and west R&D) | 54 (29.5) | 41 (22.4) | 43 (23.5) | 45 (24.6) |
Frequency (Percentage) of Sources Utilized in Clinical Decision-Making
The absolute risk, odds ratio, likelihood ratio, and number needed to harm were the concepts that participants were most familiar with and could explain to others. In contrast, relative risk, systematic review, meta-analysis, number needed to treat, and relative risk reduction were concepts that many participants did not know how to define (Table 4). The mean ± SD number of epidemiological and statistical concepts that participants knew and could explain to others was 4.29 ± 1.53, with a minimum of 0 and a maximum of 8.
| Concepts | Don't Know | Know to Some Extent | Know and Can Explain to Others |
|---|---|---|---|
| Absolute risk | 51 (27.9) | 61 (33.3) | 71 (38.8) |
| Relative risk | 64 (35.0) | 59 (32.2) | 60 (32.8) |
| Systematic review | 70 (38.3) | 68 (37.2) | 45 (24.6) |
| Odds ratio | 60 (32.8) | 60 (32.8) | 63 (34.4) |
| Likelihood ratio (LR) | 60 (32.8) | 58 (31.7) | 65 (35.5) |
| Meta-analysis | 66 (36.1) | 63 (34.4) | 54 (29.5) |
| Clinical effectiveness | 59 (32.2) | 66 (36.1) | 58 (31.7) |
| Number needed to treat | 73 (39.9) | 61 (33.3) | 49 (26.8) |
| Confidence interval | 52 (28.4) | 71 (38.8) | 60 (32.8) |
| Heterogeneity | 50 (27.3) | 71 (38.8) | 62 (33.9) |
| Publication bias | 52 (28.4) | 72 (39.3) | 59 (32.2) |
| Relative risk reduction | 62 (33.9) | 62 (33.9) | 59 (32.2) |
| Number needed to harm | 63 (34.4) | 40 (21.9) | 80 (43.7) |
Frequency (Percentage) of Familiarity with Epidemiology and Statistical Concepts
There were no significant differences in the number of sources utilized in clinical decision-making and the epidemiological and statistical concepts that participants knew and could explain to others based on age, gender, specialty, or academic year (Table 5).
| Variables | Utilizing Sources in Clinical Decision-Making | Familiar to Epidemiology and Statistical Concepts |
|---|---|---|
| Age (y) | ||
| 27 - 29 | 1.51 ± 1.06 | 4.05 ± 1.64 |
| 30 - 32 | 1.46 ± 1.13 | 4.54 ± 1.30 |
| ≥ 33 | 1.49 ± 1.02 | 4.31 ± 1.62 |
| Test statistics | 0.03 | 1.82 |
| P-value | 0.972 b | 0.165 b |
| Gender | ||
| Female | 1.41 ± 1.02 | 4.22 ± 1.44 |
| Male | 1.57 ± 1.13 | 4.37 ± 1.62 |
| Test statistics | 0.99 | 0.69 |
| P-value | 0.324 c | 0.493 c |
| Specialty | ||
| Internal medicine | 1.42 ± 1.14 | 4.24 ± 1.57 |
| Cardiology | 1.20 ± 1.08 | 4.17 ± 1.57 |
| Radiology | 1.62 ± 0.97 | 4.29 ± 1.42 |
| Pediatrics | 1.38 ± 1.19 | 3.92 ± 1.55 |
| Surgery | 1.93 ± 0.96 | 4.53 ± 1.51 |
| Psychiatry | 1.20 ± 1.13 | 4.50 ± 1.65 |
| Neurology | 1.65 ± 0.93 | 4.80 ± 1.67 |
| Obstetrics and gynecology | 1.47 ± 1.24 | 3.60 ± 1.06 |
| Other d | 1.58 ± 1.02 | 4.53 ± 1.58 |
| Test statistics | 0.78 | 0.91 |
| P-value | 0.621 b | 0.510 b |
| Academic year | ||
| 1 | 1.68 ± 1.19 | 4.18 ± 1.47 |
| 2 | 1.46 ± 0.99 | 4.30 ± 1.65 |
| 3 | 1.31 ± 0.99 | 4.34 ± 1.41 |
| 4 | 1.34 ± 1.08 | 4.41 ± 1.57 |
| Test statistics | 1.16 | 0.18 |
| P-value | 0.327 b | 0.913 b |
Comparison of Mean ± SD Number of Sources Utilized in Clinical Decision-Making and Epidemiology and Statistical Concepts that Participants Known and Could Explain to Others Based on Demographic and Educational Characteristics a
There was no significant correlation between the number of sources utilized in clinical decision-making and the epidemiological and statistical concepts that participants knew and could explain to others, with the total score, need, evaluation, organization, locating, and exchange components of information literacy (P > 0.05) (Table 6).
| Variables | Need | Locating | Valuation | Organization | Exchange | Total |
|---|---|---|---|---|---|---|
| Utilizing sources in clinical decision-making | ||||||
| Correlation | 0.062 | -0.057 | -0.013 | -0.047 | -0.112 | -0.078 |
| P-value | 0.404 | 0.446 | 0.862 | 0.530 | 0.132 | 0.292 |
| Epidemiology and statistical concepts that participants known and could explain to others | ||||||
| Correlation | 0.098 | -0.009 | 0.051 | -0.062 | -0.026 | 0.011 |
| P-value | 0.187 | 0.905 | 0.496 | 0.406 | 0.728 | 0.886 |
Examining the Correlation Between the Number of Sources Utilized in Clinical Decision-Making and Epidemiology and Statistical Concepts that Participants Known and Could Explain to Others, in Relation to Information Literacy and Its Components, Using Spearman's Correlation Coefficient
5. Discussion
The current study aimed to investigate the status of information literacy and EBM, and the relationship between these aspects among medical residents in specialized fields. The findings revealed that the information literacy of the participants was above average across all dimensions. The highest levels of information literacy were observed in the areas of information locating and organizing. As described in the Methods section, each item contained different questions. The ability to produce content using software such as word processors and PowerPoint, as well as familiarity with online information search methods (based on keywords and utilizing various Boolean operators such as AND, -, and +), were associated with information locating. Similarly, various questions pertained to how to organize and integrate different elements extracted (text, tables, diagrams, images, etc.) in scientific writing. No significant differences were found among the various specialized fields regarding the total information literacy score, although in the domains of information literacy, only the area of organizing information demonstrated a statistically significant relationship by specialty field, with radiology residents achieving the highest score and internal medicine residents having the lowest. Consistent with our findings, a study conducted at Tehran University on medical students indicated a relatively good level of information literacy (13).
More than half of the medical residents had participated in EBM workshops, but less than half could define it correctly. However, there was about a 10% difference in the accurate definition of EBM among those who attended the workshops, although this difference was not statistically significant. The rate of using resources in clinical decision-making within the target population was roughly 30%, with most participants either being uninformed or aware but not utilizing the resources. These results are consistent with other studies (14-16). The presentation of the relevant curriculum can serve as a means to enhance the current situation. In this context, the findings of a study conducted in Bushehr by Mirzaei et al. indicated that the implementation of educational intervention programs can positively impact awareness and attitudes regarding the necessity of using evidence-based medicine (17). According to Unadkat et al., a significant relationship existed between residency year and EBM skills, whereas our study found no significant relationship with study year or field of study (18).
This difference is understandable, given that the assistants in the aforementioned study possessed a higher level of familiarity with EBM skills compared to those in similar studies. A study by Kalavani et al. at Shahid Beheshti University in 2017 indicated that most assistants addressed their information needs and clinical questions by consulting with clinical professors and colleagues (19). while our study results showed that the increasing spread and use of the Internet has led assistants to primarily rely on Internet searches for information. However, it is important to note that simple familiarity with the Internet does not guarantee access to sufficient and reliable clinical evidence and resources. As Wilson et al. discovered in a survey of general practitioners, despite the increased Internet usage, 49% of those surveyed required training in using databases (20).
Our study results demonstrated no statistically significant relationship between information literacy and its components and evidence-based medical skills in assistants. These findings contradict those of Azami et al (21) and Javani et al (22) which reported a moderate, positive, and significant correlation between information literacy and evidence-based skills (r = 0.5, P = 0.001). The questionnaires employed in those studies differed from ours, a factor that may account for the discrepancy in results.
5.1. Conclusions
Finally, this study revealed that the information literacy level of medical residents is average. Therefore, it is essential for doctors to possess the ability to search for and retrieve appropriate clinical evidence and to use it alongside their clinical experience in the future and in the context of specific diseases.
In general, there appears to be a growing national need to educate medical residents on these concepts, particularly through workshop training. In this regard, virtual training can be used alongside in-person training. Virtual training has a significant impact on information-seeking skills as well as training in the use of search operators. This type of training can also be cost-effective and has various benefits in medical education (23). It is also recommended that information literacy education and evidence-based medical skills be presented together in a complementary manner within policies aimed at improving evidence-based medicine, in order to achieve the desired goals through synergy.
5.2. Limitations
There were no specific limitations on data collection. However, due to their busy schedules, the residents were initially less willing to cooperate, which was addressed by explaining the objectives of the study.
