


1. Background
Total quality management (TQM) focuses on quality in that it mandates permanent improvement of goods and services according to the needs and expectations of the customers with the participation of all individuals associated with the organization (1). Using European Foundation for Quality Management (EFQM) model, organizations can determine the strengths, areas that can be improved, and the organization's growth in the exaltation path (1, 2). Higher education system has an important role in training skilled manpower in all countries both quantitatively and qualitatively, such that if two dimensions of quantity and quality are promoted harmoniously, we will see the training of high-quality professionals in serving the society. Educational system can be more efficient when it integrates quality into its duties (3, 4). Because educational system has grown quantitatively, but not as much qualitatively, some adverse consequences have ensued such as academic failure, scientific dependence, lack of creativity and entrepreneurship, brain drain and poor production of science for the educational system (3). Finding ways to improve the quality of educational services is therefore necessary. Service recipients’ opinion can be considered one of the most important criteria in defining the quality of services, in which quality is regarded as a function of customers’ feedback (5). Therefore, their perceptions and expectations can be considered the most important determinant of quality. Accordingly, “SERVQUAL model” or “gap analysis model” was presented by Parasouraman et al. which is one of the most important models for assessing the quality of services (6). The quality of educational services is determined by examining the gap between expectations (desirable situation) and the provided educational services (current status). The lower the gap between the expectations and the provided educational services, the more desirable the quality of the proposed educational services. By defining the gap in quality of services, programs can be developed for promoting the quality of education (2). The results of several studies conducted among the Iranian medical students showed that there is a gap in all five dimensions of quality of educational services (2-21). Similar studies carried out among some universities outside Iran have also reported a gap in all dimensions (22-27). Currently, students are the main applicants for educational services and their viewpoints are used for examining educational services and monitoring quality at universities across the globe, therefore, being aware of the status of the quality of the provided educational services can be the basis for planning, policy-making and improving the quality of educational services. However, by doing research in each university, a model with higher degree of compliance for the same university can be achieved. Medical education in Iran has witnessed a remarkable success in recent decades. Training thousands of general practitioners, specialists, subspecialists and fellows has played a key role in promoting health of society and self-sufficiency in Iran's advanced medical services. However, medical education, especially in the field of medicine faces serious criticism by medical education professionals and planners. Therefore, the Ministry of Health has had to make many changes, especially in curricula since 2018. In order to improve the quality of medical education, the following changes were made: centralization of the scoring system, revising the medical education curriculum in line with the curriculum proposed by the Ministry of Health, reducing the internship course, reopening the academic counseling office and finalizing the student evaluation stylebook. The quality of the educational services of medicine course has not yet been assessed at Ahvaz Jundishapur University of Medical Sciences (AJUMS) (which is a type 1 university according to the Ministry of Health classification). Each university should consider this issue according to its own requirements and take the necessary steps to remedy the shortcomings.
2. Objectives
Therefore, this research was conducted to evaluate the quality of educational services of medicine discipline in AJUMS in southwestern Iran.
3. Methods
This cross-sectional study was carried out among the medical students in the academic year 2018 - 19. The research population consisted of all medical students in AJUMS. Sampling was performed by simple random sampling. A total of 252 students completed the questionnaires. The data collection tool was a multi-dimensional questionnaire including demographic characteristics, learners’ perceptions and their expectations of the quality of educational services based on the SERVQUAL model. The questionnaire consists of 24 items. In five dimensions of physicality (4 items), assurance (5 items), accountability (5 items), empathy (5 items), and reliability (5 items), it evaluates the quality of educational services, and scores them based on the 5-point Likert scale. Validity and reliability of this questionnaire have been confirmed in numerous studies conducted in and out of Iran (2-27). Validity and reliability of SERVQUAL standard questionnaire were re-evaluated by the researchers. Cronbach’s alpha was used to evaluate its reliability, reported as 82%. After completing and collecting the questionnaires, the information in the five dimensions was divided into two sections of the existing status and the expected status. The quality gap was calculated by subtracting the mean score of expectations from the mean score of students’ perception of the quality of educational services. If the mean score is positive, the perceived quality of education is considered favorable, and if it is negative, the perceived quality of education is regarded undesirable, indicating the gap between the status quo quality and the desirable quality. If the score equals to zero, it means that there is no gap and the expected level of education is provided to students. To observe ethical considerations, the goals of study and sensitivity of receiving accurate answers were mentioned before data collection. Then the students were asked for oral consent and they were assured of the confidentiality of the information. The questionnaires were handed out when the students did not work. The inclusion criteria were being a medical student, willing to participate in the research and having passed at least one year of their study. Withdrawal from the study and being a guest student were considered the exclusion criteria. Data were analyzed in SPSS software version 24 using the descriptive statistics (mean and standard deviation) and the inferential statistics (paired t-test, two-sample t-test, one-way ANOVA, Mann-Whitney and Kruskal-Wallis nonparametric tests).
4. Results
From total of 252 medical students participating, 156 (61.6%) students were male and 138 (54.5%) were 21 - 25 years old (Table 1).
| Variable | No. (%) |
|---|---|
| Gender | |
| Male | 156 (6.61) |
| Female | 96 (4.37) |
| Age | |
| Under 20 | 27 (27.3) |
| 21 - 25 | 138 (54.5) |
| Above 26 | 46 (18.2) |
| Educational background | |
| 1 year | 27 (10.7) |
| 2 years | 47 (18.7) |
| 3 years | 55 (21.8) |
| 4 years | 57 (22.6) |
| 5 years | 41 (16.3) |
| 6 years | 25 (9.9) |
| Re-choosing the field of study | |
| Yes | 211 (86.9) |
| No | 42 (13.1) |
| Satisfaction with the university | |
| Yes | 177 (69.7) |
| No | 75 (30.3) |
| Satisfaction with the field of study | |
| Yes | 229 (90.9) |
| No | 23 (9.1) |
Demographic Characteristics of the Students
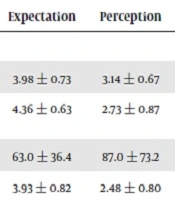
The mean and standard deviation of perceived and expected scores and the quality gap of educational services in each dimension and in each item of the quality of educational services have been expressed from the students’ point of view. Out of the 24 items of quality of the educational services, the highest service gap was related to the students’ ease of access to the manager for transmission of their comments and suggestions on issues (in the dimension of accountability) and the lowest service gap was related to the registration and maintenance of student’s records (in the dimension of assurance) (Table 2).
| Dimensions of Service/Items | Expectation | Perception | Quality Gap |
|---|---|---|---|
| Tangibility | |||
| 1. Professors’ and employees’ appearance is elegant and professional. | 3.98 ± 0.73 | 3.14 ± 0.67 | -0.84 ± 0.75 |
| 2. Facilities are physically attractive (buildings, classrooms, chairs, resting place, decoration and facilities, temperature, light, whiteboard). | 4.36 ± 0.63 | 2.73 ± 0.87 | -1.64 ± 1.13 |
| 3. New facilities and educational materials such as the internet, library, and overhead projectors are efficient. | 63.0 ± 36.4 | 87.0 ± 73.2 | 13.1 ± 64.1- |
| 4. The devices the teacher uses are attractive. | 3.93 ± 0.82 | 2.48 ± 0.80 | -1.43 ± 1.20 |
| Assurance | |||
| 1. Students’ records are kept completely. | 3.89 ± 0.86 | 3.20 ± 0.94 | -0.68 ± 1.20 |
| 2. Course contents of each session are presented in a regular and interrelated manner. | 4.15 ± 0.79 | 2.94 ± 0.89 | -1.21 ± 1.16 |
| 3. Professors perform what they promise at the right time. | 4.15 ± 0.82 | 2.99 ± 0.83 | -1.16 ± 1.20 |
| 4. Course materials are presented in an understandable manner to students. | 4.30 ± 0.75 | 2.77 ± 0.90 | -1.54 ±1.08 |
| 5. Study resources are easily accessible to students at the university | 4.31 ± 0.72 | 3.13 ± 0.94 | -1.18 ± 1.04 |
| Accountability | |||
| 1. Consulting professors and advisors are accessible (upon student’s request). | 4.08 ± 0.89 | 2.50 ± 1.06 | -1.58 ± 1.26 |
| 2. Students can easily reach the dean, and convey their comments and suggestions on university issues. | 4.13 ± 0.92 | 2.36 ± 1.02 | -1.79 ± 1.28 |
| 3. Students’ comments and suggestions on educational issues are applied in educational programs. | 1.04 ± 0.91 | 2.49 ± 0.99 | -1.52 ± 1.33 |
| 4. Appropriate resources are introduced to students for further study. | 4.01 ± 0.81 | 3.03 ± 0.89 | -1.05 ± 1.11 |
| 5. The office hours when students can meet professors about educational issues are announced. | 4.00 ± 0.88 | 2.59 ± 1.00 | -1.43 ± 1.24 |
| Reliability | |||
| 1. Professors facilitate discussing and exchanging students’ views on the subjects in the classroom. | 4.04 ± 0.92 | 3.09 ± 0.76 | -0.92 ± 1.10 |
| 2. Students are prepared for their future job by providing theoretical and practical training at the faculty. | 4.25 ± 0.92 | 2.54 ± 1.06 | -1.68 ± 1.36 |
| 3. Professors assign some time to answer and explain the lessons to students outside the class hours. | 4.02 ± 0.86 | 2.88 ± 0.87 | -1.15 ± 1.17 |
| 4. Enough resources are available to increase student awareness. | 4.13 ± 0.80 | 3.00 ± 0.78 | -1.15 ± 1.15 |
| 5. Professors have sufficient specialty knowledge. | 4.30 ± 0.73 | 3.11 ± 0.88 | -1.20 ± 1.12 |
| Empathy | |||
| 1. Appropriate and related assignments are assigned. | 3.74 ± 1.03 | 2.68 ± 0.82 | -1.06 ± 1.11 |
| 2. Professors are flexible in dealing with certain conditions that may occur to students. | 4.07 ± 0.88 | 2.61 ± 0.91 | -1.46 ± 1.28 |
| 3. Classes are held at a suitable time. | 4.16 ± 0.71 | 2.69 ± 0.99 | -1.48 ± 1.21 |
| 4. There is a quiet place for studying in the faculty. | 4.14 ± 0.86 | 3.25 ± 0.91 | -0.89 ± 1.28 |
| 5. Education office employees behave appropriately with students. | 4.17 ± 0.97 | 2.82 ± 1.11 | -1.35 ± 1.52 |
Mean Scores of the Status Quo and the Favorable Status in Each Item and Each Dimension of the Quality of Educational Services from the Students’ Viewpoint
Paired t-test revealed a significant difference (P < 0.001) between students’ expectations and perceptions of the quality of educational services in all five dimensions (Table 3). The dimensions of accountability (-1.46), tangibility (-1.34), empathy (1.25), assurance (-1.14) and reliability (-1.12) had respectively the highest gap.
| Dimensions of Service | Expectation | Perception | Gap | P Value |
|---|---|---|---|---|
| Tangibility | 4.12 ± 0.55 | 2.78 ± 0.60 | -1.34 ± 0.78 | < 0.001 |
| Assurance | 4.15 ± 0.60 | 3.00 ± 0.58 | -1.14 ± 0.75 | < 0.001 |
| Accountability | 4.06 ± 0.77 | 2.60 ± 0.72 | -1.46 ± 0.95 | < 0.001 |
| Reliability | 4.14 ± 0.72 | 2.93 ± 0.61 | -1.12 ± 0.89 | < 0.001 |
| Empathy | 4.06 ± 0.71 | 2.81 ± 0.63 | -1.25 ± 0.89 | < 0.001 |
Mean and Standard Deviation of the Scores of Perception, Expectation and Quality Gap in the Five Dimensions of the Quality of Educational Services
The effect of demographic variables on the mean service gap was studied in each of the five dimensions of educational services. There was a meaningful relationship between educational service gap and variables of gender, academic year, satisfaction with the field of study and university (Table 4).
| Variables | Dimensions of the Quality of Educational Services | ||||
|---|---|---|---|---|---|
| Tangible | Assurance | Accountability | Reliability | Empathy | |
| Gender | |||||
| Male | -1.24 (0.68) | -1.05 (0.73) | -1.26 (0.88) | -1.01 (0.81) | -1.05 (0.81) |
| Female | -1.48 (0.93) | -1.27 (0.76) | -1.77 (0.98) | -1.50 (0.94) | -1.55 (0.95) |
| Significance | 0.285 | 0.155 | 0.009 | 0.009 | 0.006 |
| Age | |||||
| Below 20 | -1.12 (0.64) | -1.04 (0.62) | -1.49 (0.91) | -1.04 (0.78) | -1.04 (0.74) |
| 21 - 25 | -1.52 (0.88) | -1.26 (0.81) | -1.47 (1.04) | -1.32 (0.95) | -1.43 (0.92) |
| Above 26 | -1.11 (0.49) | -0.96 (0.69) | -1.36 (0.75) | -1.13 (0.84) | -1.00 (0.95) |
| Significance | 0.088 | 0.243 | 0.898 | 0.394 | 0.083 |
| Educational background | |||||
| 1 - 2 years | -1.23 (0.68) | -1.07 (0.73) | -1.31 (1.09) | -1.99 (0.83) | -1.16 (0.71) |
| 3 - 4 years | -1.29 (0.95) | -0.97 (0.69) | -1.56 (0.94) | -1.06 (0.84) | -1.07 (1.04) |
| 5 - 6 years | -1.50 (0.73) | -1.38 (0.77) | -1.52 (0.84) | -1.53 (0.91) | -1.49 (0.83) |
| Significance | 0.272 | 0.069 | 0.564 | 0.026 | 0.134 |
| Satisfaction with the field of study | |||||
| Yes | -1.29 (0.75) | -1.14 (0.73) | -1.50 (0.93) | -1.22 (0.85) | -1.24 (0.88) |
| No | -1.83 (1.01) | -1.20 (0.94) | -1.02 (1.05) | -1.09 (1.29) | -1.31 (1.05) |
| Significance | 0.047 | 0.814 | 0.147 | 0.670 | 0.822 |
| Satisfaction with the university | |||||
| Yes | -1.19 (0.73) | -1.02 (0.66) | -1.42 (0.96) | -1.09 (0.79) | -1.14 (0.97) |
| No | -1.67 (0.82) | -1.43 (0.85) | -1.55 (0.95) | -1.48 (1.04) | -1.47 (0.91) |
| Significance | 0.004 | 0.025 | 0.555 | 0.04 | 0.093 |
Comparison of the Mean Gap Between the Status Quo and the Desired Status in the Five Dimensions of the Quality of Educational Services with Regard to the Demographic Characteristics of the Students
5. Discussion
The present study revealed a negative gap in the quality of all five dimensions of educational services. The difference between the mean scores of students’ perceptions and expectations is negative and from their point of view the quality of education was lower than their expectations. Accordingly, the dimensions of accountability, tangibility, empathy, reliability, and assurance had the greatest gap. Therefore, it appears that educational services in all aspects need to be reviewed and reformed. Similar studies in other Iranian medical universities so far have reported a negative gap in all dimensions (2-21). In a meta-analysis review conducted in 2019 using the SERVQUAL assessment model for the student satisfaction in Iranian medical universities, there was a negative gap in all five dimensions. In this study, the lowest gap was reported as -0.77 at Shahrekord University of Medical Sciences and the highest gap as -1.90 (from maximum score of 5) at North Khorasan University of Medical Sciences (21). Similar studies conducted in universities in India, Thailand, China and Saudi Arabia also reported a negative gap in all five dimensions of SERVQUAL (22-27). Their results are in line with our research. Research results show that the students who are more satisfied with the quality of educational services will have a higher level of learning and growth.
The highest gap has been observed in the dimension of accountability. In a similar study conducted by Khadem Rezaiyan and Mousavi Bazaz among the medical students at Mashhad University of Medical Sciences in northeastern Iran, the greatest gap was found in the dimension of accountability (10). Aghamolaei and Zare in Hormozgan University of Medical Sciences in southern Iran also reported the highest quality gap in the dimension of accountability (9). Khandan et al., who performed a study among the nursing and midwifery students at Kerman University of Medical Sciences in central Iran, reported the highest gap in the dimension of accountability (15). Jafari Asl et al., who studied the nursing and midwifery students of Guilan University of Medical Sciences in northern Iran, also showed the highest gap in the dimension of accountability (6). A study among the medical students of Kerman University of Medical Sciences (in central Iran) by Yazdi-Feyzabadi et al. reported the highest gap in accountability (5). Also, outside Iran, a study conducted among Saudi Arabia’s medical students by Aldarmahi et al. reported a negative gap in all dimensions, with the largest gap in accountability (27). In a study conducted to examine the gap between the expectations and the perceived experience of the RN-to-BSN nursing program among US Midwestern nursing students, the largest gap was in accountability (28). The existence of a quality gap in the dimension of accountability implies that students need the possibility of applying student’s view in the curriculum, the accessibility of supervising professors when students need, and the accountability of educational staff regarding the educational problems. Correcting this issue and attracting students do not require a lot of funding, and all it needs is a brief training.
According to the findings of the present research, the second rank in quality gap score pertained to the physical and tangible dimension. Khademloo et al. (19) in Iran reported physical dimension as the first priority of the students. This research also reported other interesting results. It reported a significant difference between the students who were satisfied with the choice of their field of study and university, and the students who were not satisfied with the choice of their field of study and university considering the mean educational services gap in terms of tangibility. In other words, there was an inverse relationship between the satisfaction with the field of study and the university on the one hand and the amount of educational service gap on the other hand. This is consistent with the results of Khadem Rezaiyan and Mousavi Bazaz (10). Therefore, in this regard, it can be claimed that the lack of interest can affect the positive view of students in their field of study and university. The existence of a quality gap in the tangible dimension implies that the necessary educational infrastructure, such as facilities, equipment, physical space and educational materials, are not of prime importance, and the relevant individuals are expected to take the necessary steps to provide and equip the educational centers. Furthermore, acquisition of competencies, medical knowledge, learning motivation and positive attitude in the clinical environment are realized by observing the behavior and performance of teachers, therefore, it is expected that workshops be held to empower faculty members in encountering different educational situations.
Another result of this research was that gender had a significant effect on the mean gap of the dimensions of accountability, assurance and empathy in the quality of educational services. In the study of Khandan et al. (15) and Ghalavandi et al. (16), this difference was also reported significant. Girls reported a deeper gap in all dimensions. But there was no significant difference between the two genders in the study of Tofighi et al. (20). Experiences from other successful countries can also be used to satisfy students and periodically measure their knowledge and, as a result, improve the quality of medical education (29-31). A review article that investigated 121 UK universities in terms of Higher Education Academy (HEA) qualification reported high student satisfaction, which is in inconsistent with our study (32).
Planning, proper allocation of resources and some measures such as holding workshops for staff and faculty members can minimize these gaps and improve the quality of educational services for the students. Priority should be given to accountability, followed by the dimensions of tangibility, empathy, reliability, and assurance. This can also affect the quality of other dimensions. It appears that some of the items can simply be improved by appropriate managerial measures, modification and rearrangement of educational service delivery patterns.
