
Introduction
Experimental
| Light intensity | Variables | Organism | Year | Researchers (Reference) | ||
|---|---|---|---|---|---|---|
| Temperature | Nutrients | Salinity | ||||
| * | * | * | Dunaliella bardawil | 1983 | (Ben-Amotz, Avron 1983) (21) | |
| * | Dunaliella salina | 1987 | (Al-Hasan, Ghannoum et al. 1987) (22) | |||
| * | Dunaliella bardawil | 1990 | (Lers, Biener et al. 1990) (23) | |||
| * | Dunaliella | 1994 | (Vorst, Baard et al. 1994) (20) | |||
| * | Dunaliella salina | 1996 | (Mendoza, Jimenez Del Rio et al. 1996) (24) | |||
| * | * | Dunaliella | 1998 | (Marin, Morales et al. 1998) (25) | ||
| * | Dunaliella viridis | 2001 | (Gordillo, Jimenez et al. 2001) (26) | |||
| * | Dunaliella salina | 2003 | (Hejazi, Wijffels 2003) (27) | |||
| * | * | * | * | Dunaliella | 2005 | (Dipak 2005) (28) |
| * | * | * | Dunaliella salina | 2008 | (Coesel, Baumgartner et al. 2008) (29) | |
| * | Dunaliella salina | 2010 | (Jesus, Rubens Filho 2010) (30) | |||
| * | * | Dunaliella salina | 2011 | (Pasqualetti, Bernini et al. 2011) (16) | ||
| * | Dunaliella tertiolecta | 2011 | (Tammam, Fakhry et al. 2011) (31) | |||
| * | Dunaliella salina | 2011 | (Narvaez-Zapata, Rojas-Herrera et al. 2011) (10) | |||
| * | Dunaliella sp. | 2011 | (Rad, Aksoz et al. 2011) (32) | |||
| * | Dunaliella | 2012 | (Ali-zadeh 2012) (33) | |||
| * | Dunaliella salina | 2013 | (Nikookar, Rowhani et al. 2013) (34) | |||
| * | Dunaliella salina | 2013 | (Fu, Guomundsson et al. 2013) (35) | |||
| * | * | Dunaliella salina | 2013 | (Dhanam, Dhandayuthapani 2013) (1) | ||
| * | * | * | Dunaliella salina | 2014 | (Fu, Paglia et al. 2014) (2) | |
| Variable | Symbol | Ranges and levels | ||
|---|---|---|---|---|
| -1 | 0 | +1 | ||
| Light intensity (µmol photons m-2s-1) | X1 | 200 | 600 | 1000 |
| Temperature (ᵒC) | X2 | 25 | 30 | 35 |
| Nitrate concentration (mM) | X3 | 0 | 2.5 | 5 |
| Salt concentration (M) | X4 | 2 | 3 | 4 |
| Independent variables | RBC | RTC | |||||||||
|---|---|---|---|---|---|---|---|---|---|---|---|
| RUN | X1 | X2 | X3 | X4 | Mean | ± | SE | Mean | ± | SE | |
| 1 | 200 | 25 | 2.5 | 3 | 0.1807 | ± | 0.0105 | -0.0156 | ± | 0.0074 | |
| 2 | 1000 | 25 | 2.5 | 3 | -0.0909 | ± | 0.0073 | 0.0042 | ± | 0.0008 | |
| 3 | 200 | 35 | 2.5 | 3 | 0.0368 | ± | 0.0119 | 0.0087 | ± | 0.0030 | |
| 4 | 1000 | 35 | 2.5 | 3 | -0.0131 | ± | 0.0021 | -0.1260 | ± | 0.0168 | |
| 5 | 600 | 30 | 0 | 2 | -0.0235 | ± | 0.0047 | -0.0660 | ± | 0.0070 | |
| 6 | 600 | 30 | 5 | 2 | -0.0120 | ± | 0.0106 | -0.0558 | ± | 0.0090 | |
| 7 | 600 | 30 | 0 | 4 | 0.0258 | ± | 0.0090 | -0.0723 | ± | 0.0074 | |
| 8 | 600 | 30 | 2.5 | 3 | 0.0286 | ± | 0.0041 | -0.0654 | ± | 0.0061 | |
| 9 | 600 | 30 | 5 | 4 | -0.0723 | ± | 0.0023 | -0.0591 | ± | 0.0036 | |
| 10 | 200 | 30 | 2.5 | 2 | 0.1410 | ± | 0.0180 | 0.0597 | ± | 0.0067 | |
| 11 | 1000 | 30 | 2.5 | 2 | -0.0062 | ± | 0.0012 | -0.2179 | ± | 0.0061 | |
| 12 | 200 | 30 | 2.5 | 4 | 0.1324 | ± | 0.0170 | -0.0823 | ± | 0.0032 | |
| 13 | 1000 | 30 | 2.5 | 4 | -0.0144 | ± | 0.0084 | 0.0566 | ± | 0.0067 | |
| 14 | 600 | 25 | 0 | 3 | -0.0035 | ± | 0.0006 | -0.0280 | ± | 0.0090 | |
| 15 | 600 | 35 | 0 | 3 | -0.0494 | ± | 0.0046 | -0.0886 | ± | 0.0015 | |
| 16 | 600 | 25 | 5 | 3 | 0.0075 | ± | 0.0013 | -0.0284 | ± | 0.0053 | |
| 17 | 600 | 35 | 5 | 3 | -0.0320 | ± | 0.0101 | -0.0578 | ± | 0.0058 | |
| 18 | 200 | 30 | 0 | 3 | 0.1243 | ± | 0.0101 | 0.0378 | ± | 0.0030 | |
| 19 | 1000 | 30 | 0 | 3 | -0.0095 | ± | 0.0026 | -0.1378 | ± | 0.0222 | |
| 20 | 200 | 30 | 5 | 3 | 0.1241 | ± | 0.0114 | -0.0429 | ± | 0.0070 | |
| 21 | 1000 | 30 | 5 | 3 | -0.0404 | ± | 0.0087 | -0.0449 | ± | 0.0066 | |
| 22 | 600 | 25 | 2.5 | 2 | -0.0234 | ± | 0.0045 | -0.0373 | ± | 0.0088 | |
| 23 | 600 | 35 | 2.5 | 2 | -0.0075 | ± | 0.0011 | -0.0465 | ± | 0.0017 | |
| 24 | 600 | 25 | 2.5 | 4 | -0.0110 | ± | 0.0022 | -0.0597 | ± | 0.0033 | |
| 25 | 600 | 35 | 2.5 | 4 | -0.1050 | ± | 0.0072 | -0.0519 | ± | 0.0022 | |
| Source of variance | Response RBC | Response RTC | ||||||||
|---|---|---|---|---|---|---|---|---|---|---|
| Sum of squares | Degree of freedom | Adjusted mean square | F-value | P | Sum of squares | Degree of freedom | Adjusted mean square | F-value | P | |
| Regression | 0.386 | 14 | 0.027 | 78.76 | 0.000 | 0.242 | 14 | 0.0173 | 38.64 | 0.000 |
| L | 0.208 | 1 | 0.208 | 595.67 | 0.000 | 0.046 | 1 | 0.046 | 103.67 | 0.000 |
| T | 0.013 | 1 | 0.013 | 37.61 | 0.000 | 0.009 | 1 | 0.009 | 21.74 | 0.000 |
| N | 0.002 | 1 | 0.002 | 5.69 | 0.020 | 0.001 | 1 | 0.001 | 2.43 | 0.123 |
| S | 0.003 | 1 | 0.003 | 9.08 | 0.004 | 0.002 | 1 | 0.002 | 5.05 | 0.028 |
| L2 | 0.074 | 1 | 0.030 | 87.62 | 0.000 | 0.005 | 1 | 0.007 | 17.59 | 0.000 |
| T2 | 0.016 | 1 | 0.026 | 75.49 | 0.000 | 0.005 | 1 | 0.005 | 12.75 | 0.001 |
| N2 | 0.003 | 1 | 0.007 | 21.93 | 0.000 | 0.000 | 1 | 0.000 | 0.65 | 0.421 |
| S2 | 0.009 | 1 | 0.009 | 25.87 | 0.000 | 0.000 | 1 | 0.000 | 1.15 | 0.288 |
| LT | 0.036 | 1 | 0.036 | 105.25 | 0.000 | 0.017 | 1 | 0.017 | 39.97 | 0.000 |
| LN | 0.000 | 1 | 0.000 | 2.03 | 0.159 | 0.022 | 1 | 0.022 | 50.51 | 0.000 |
| LS | 0.000 | 1 | 0.000 | 0.00 | 0.983 | 0.130 | 1 | 0.130 | 290.55 | 0.000 |
| TN | 0.000 | 1 | 0.000 | 0.09 | 0.769 | 0.000 | 1 | 0.000 | 1.63 | 0.207 |
| TS | 0.009 | 1 | 0.009 | 25.81 | 0.000 | 0.000 | 1 | 0.000 | 0.49 | 0.488 |
| NS | 0.009 | 1 | 0.009 | 25.72 | 0.000 | 0.000 | 1 | 0.000 | 0.02 | 0.902 |
| Residual error | 0.023 | 66 | 0.000 | 0.029 | 66 | 0.0004 | ||||
| Pure Error | 0.010 | 56 | 0.000 | 0.011 | 56 | 0.000 | ||||
| Total | 0.409 | 80 | 0.271 | 80 | ||||||
| R2 | 94.35% | 89.13% | ||||||||
| R2 adjusted | 93.15% | 86.82% | ||||||||
| Independent Variables | Response RBC | Response RTC | ||||||
|---|---|---|---|---|---|---|---|---|
| X1 | X2 | X3 | X4 | Experimental value | Predicted value | Experimental value | Predicted value | |
| Optimum point | 200 | 25 | 0.9 | 3.8 | 0.190 ± 0.012 | 0.191 | -0.0626±0.0024 | -0.0608 |
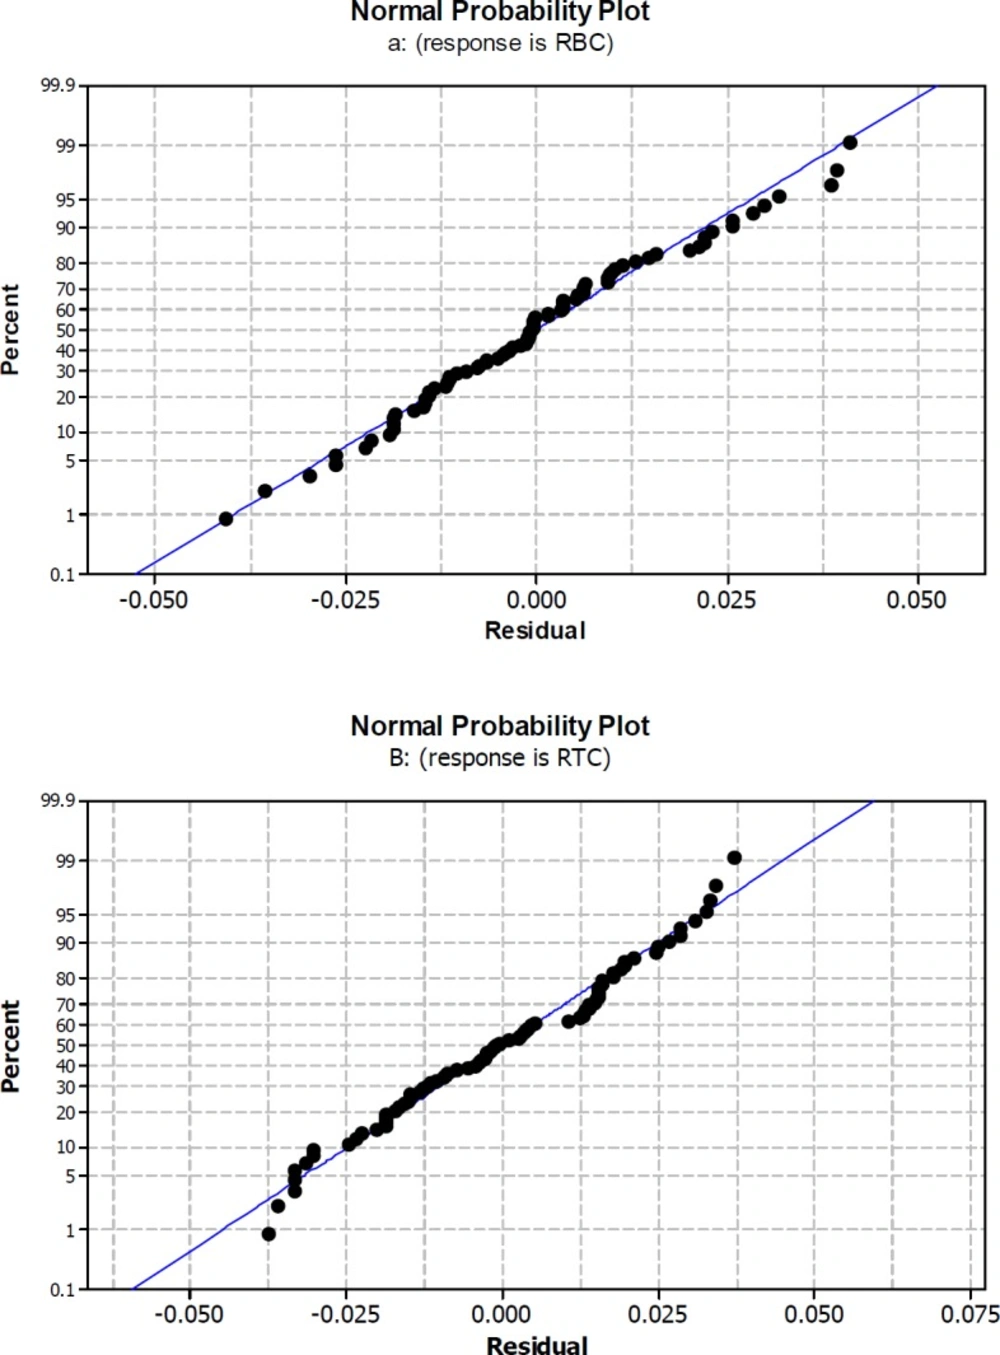
Normal probability plot for rate of β-carotene production per cell RBC (a) and rate of total chlorophylls/β-carotene per cell RTC (b) Rate were calculated by division of changes in β-carotene amount or total chlorophylls/β-carotene per 14 days during origin and end of experiments Rate = dy/dx
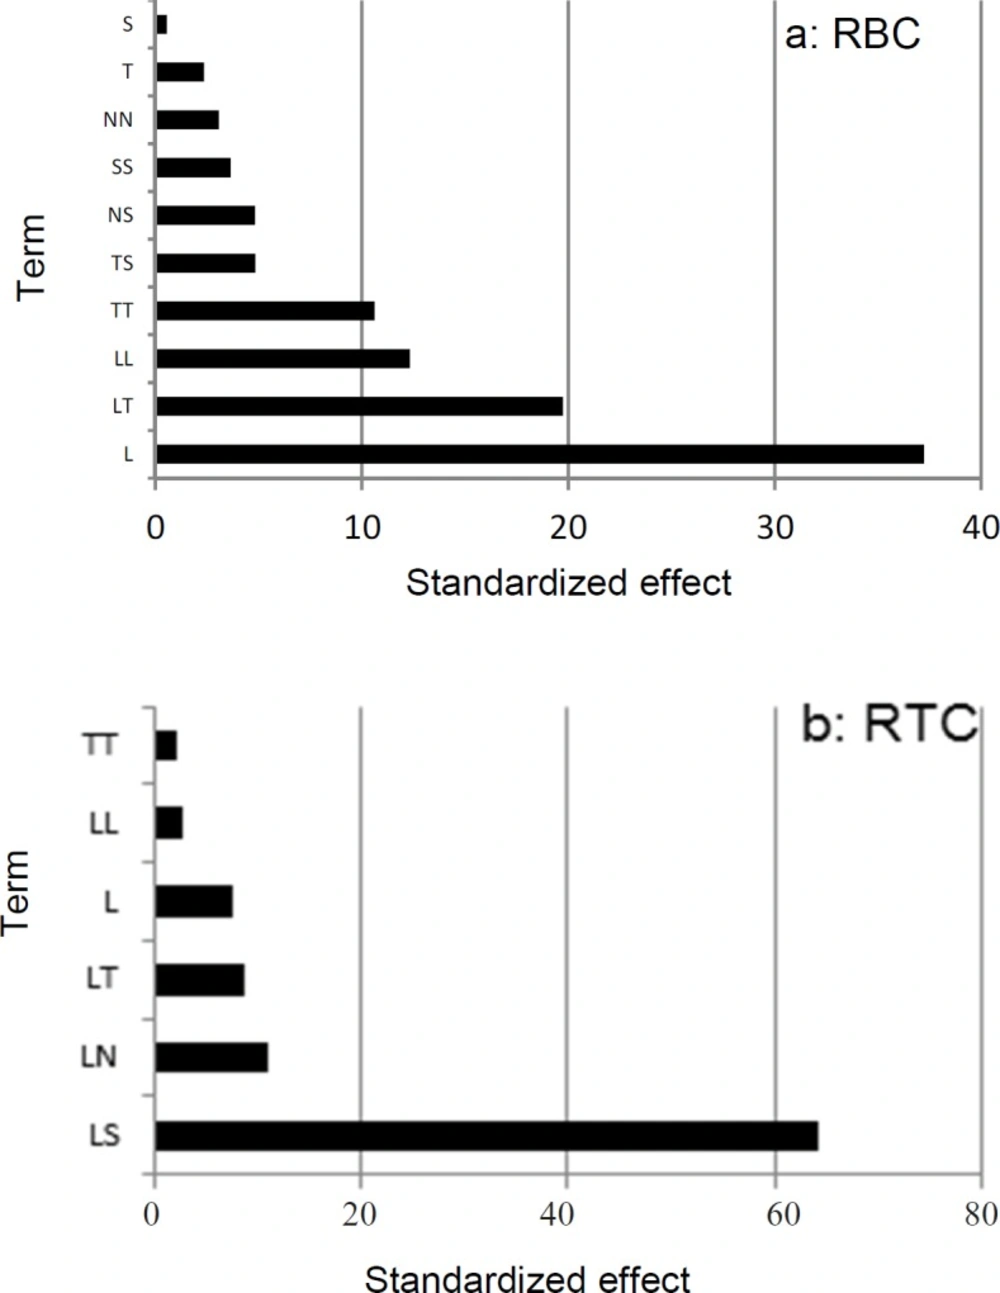
Pareto chart for rate of β-carotene production per cell RBC (a) and rate of total chlorophylls/β-carotene per cell RTC (b) Pareto values calculated using Pi=
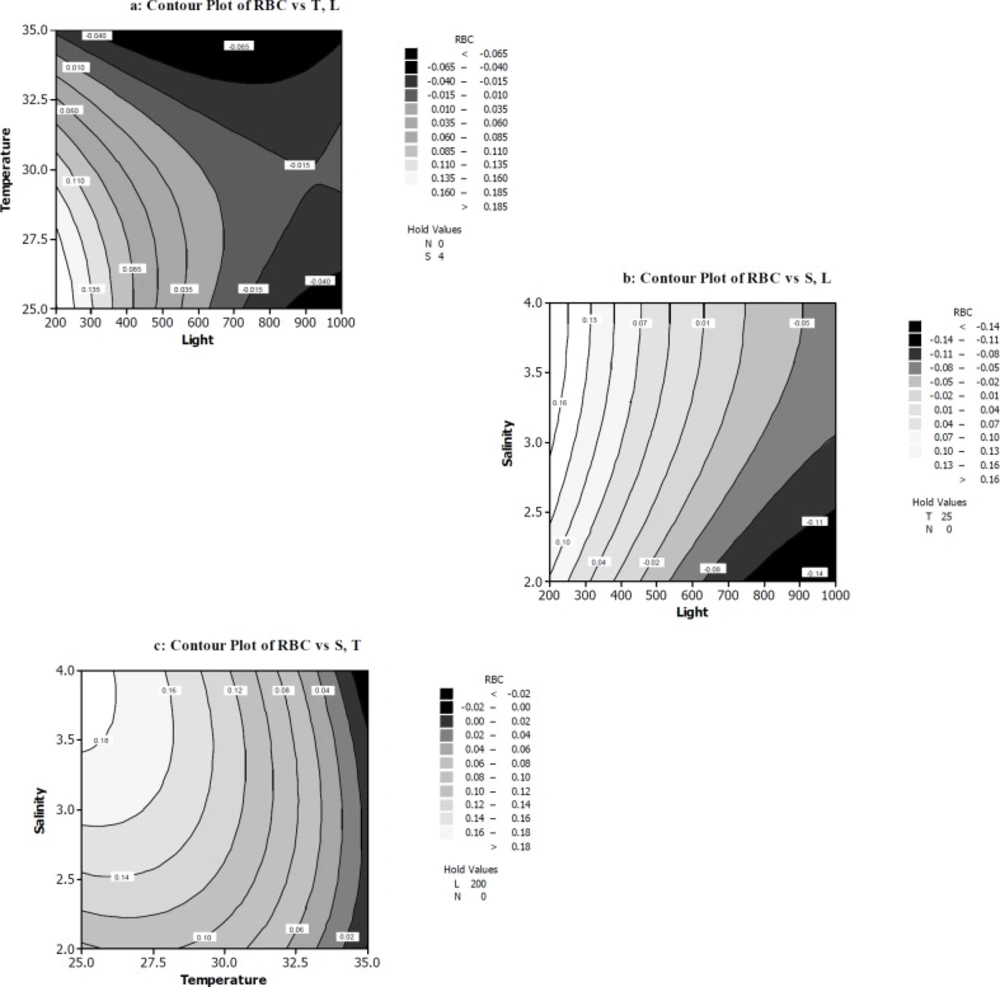
The response surface and contour plots of rate of β-carotene production per cell RBC (a) The function of temperature (ᵒC) and light intensity (µmol photons m-2s-1) on RBC. (b) The function of light intensity (µmol photons m-2s-1) and salt concentration (M NaCl) on RBC. (c) The function of temperature (ᵒC) and salt concentration (M NaCl) on RBC
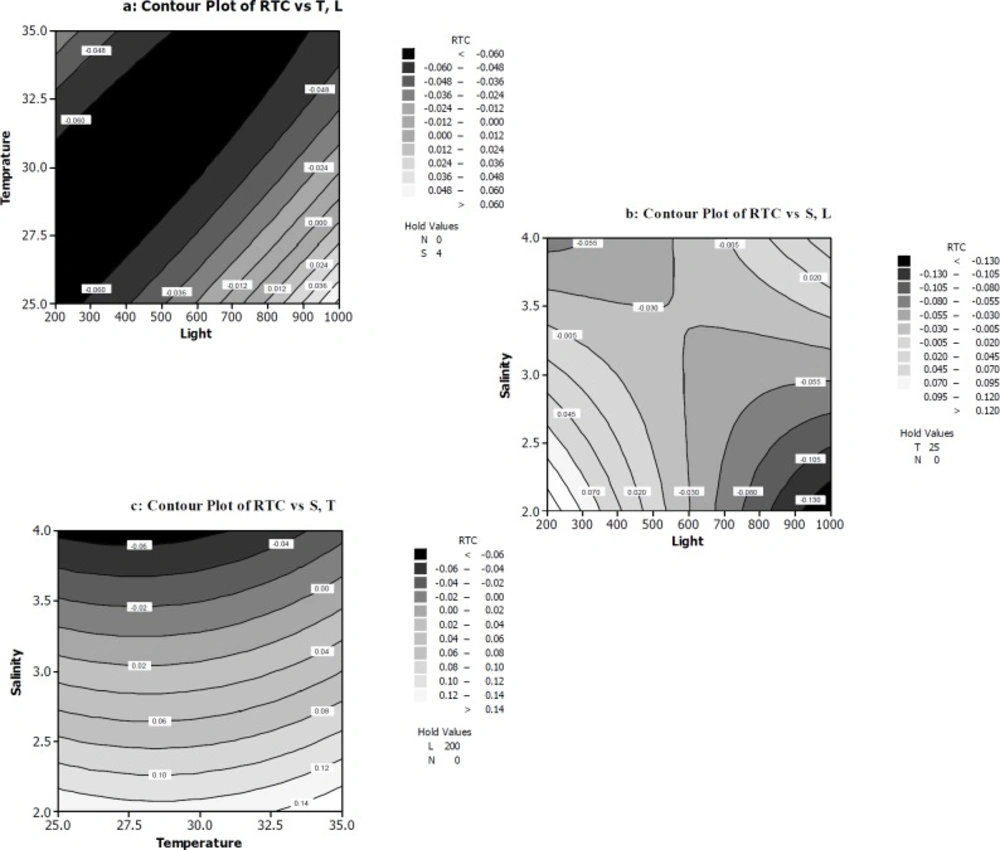
The response surface and contour plots of rate of total chlorophylls/β-carotene per cell RTC (a) The function of temperature (ᵒC) and light intensity (µmol photons m-2s-1) on RTC. (b) The function of light intensity (µmol photons m-2s-1) and salt concentration (M NaCl) on RTC. (c) The function of temperature (ᵒC) and salt concentration (M NaCl) on RTC
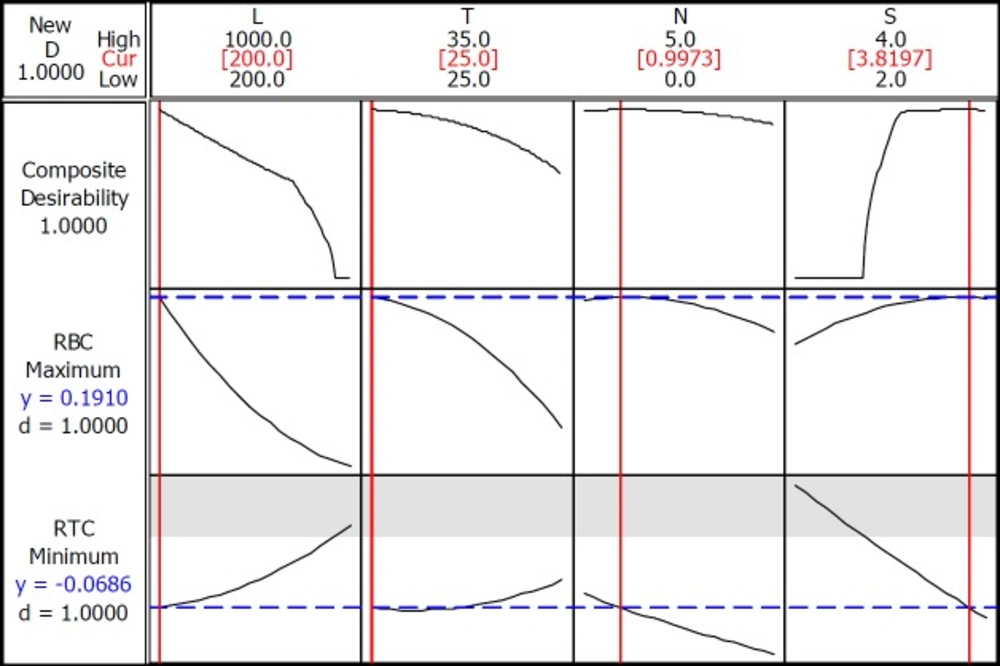
Optimality plot to locate optimum factor levels for maximizing rate of β-carotene production per cell (RBC) and minimizing rate of total chlorophylls/β-carotene per cell (RTC)


