Drugs and Reagents
The fruits of
Lycium barbarum. were collected in the Ningxia Hui Autonomous Region which was the well-known production area of
Lycium barbarum in China, and were authenticated at the Agricultural college of Northwest A&F University. A specimen (NO.20140609) was deposited in the herbarium of the Botany Department. Isolation, purification, and identification of LBP were based on our previous published work (
11).
Reserpine (methyl reserpate 3, 4, 5-trimethoxybenzoic acid ester; Sigma, Mumbai) was dissolved in glacial acetic acid and then diluted to afinal concentration of 0.1% acetic acid with distilled water. Kits for the assays of superoxide dismutase (SOD), glutathione peroxidase (GSH-Px) and catalase (CAT) were purchased from the Nanjing Jiancheng Bioengineering Institute (Nanjing, China). Anti-Bcl-2 and anti-PARP antibodies were purchased from Santa Cruz Biotechnology, Inc. Anti-β-actin antibody was purchased from Sigma Chemical Co. All other reagents and chemicals were of the highest purity grade available.
Animals and treatments
Six-week-old male or female C57BL/6 mice (average weight, 25-30 g) were provided by the Experimental Animal Center of Hayida Medical University. The animals were treated according to the National Institute of Health Guide for the Care and Use of Laboratory Animals and further approval for their experimentation was obtained from the Animal Ethics Committee of the university. The animals were housed in an animal room at 22 ± 2 ℃ and 50 ± 10% relative humidity and had free access to laboratory chow and tap water. The mice were adapted to an inverse 12:12-h light-dark cycle. The depressive model mice were induced by administration of reserpine (2 mg/kg, s.c. daily) for 15 consecutive days followed by administration with LBP once daily for 4 weeks. In the LBP groups, the mice were treated by intragastric administration with LBP (80 mg/kg·d, the optimal dosage chosen according to our previous study) dissolved in NaCl 0.9% solution and the model group mice received NaCl 0.9% solution. In the positive control group, the mice were treated by subcutaneous injection with amitriptyline (10 mg/kg·d). In the morning of the day 28, after mice were administrated with LBP or amitriptyline for 30 min, the behavioural experiments were conducted. The brain samples were harvested immediately 1 h after the measurement of the behavior paradigms for antioxidant capacity analysis.
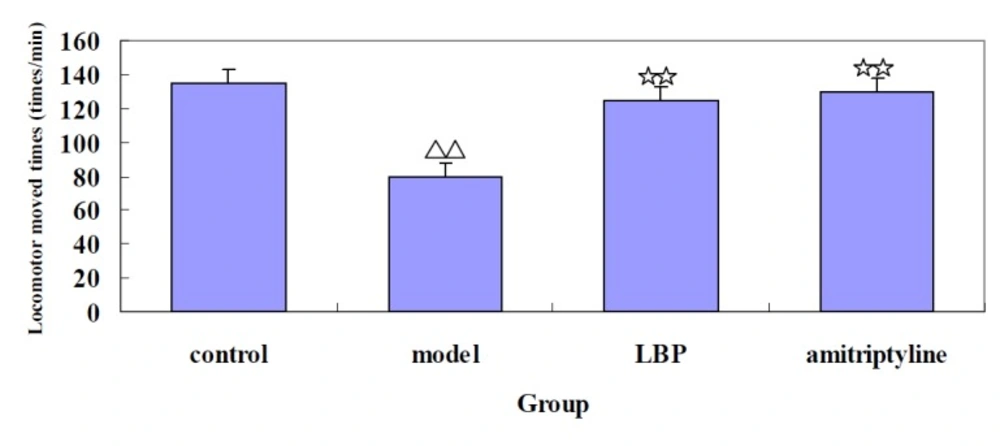
Open field test (OFT)
The assessment of the possible effects of LBP on the locomotor activity was carried out as previously described (
16) with slight modifications. Briefly, the mice were placed in a square container (100×100×30 cm) with bottom divided into 25, equal sections. Each subject was placed in the center of the open field, and the walking routes and the number of grid crossings of mice was measured for 4 min.
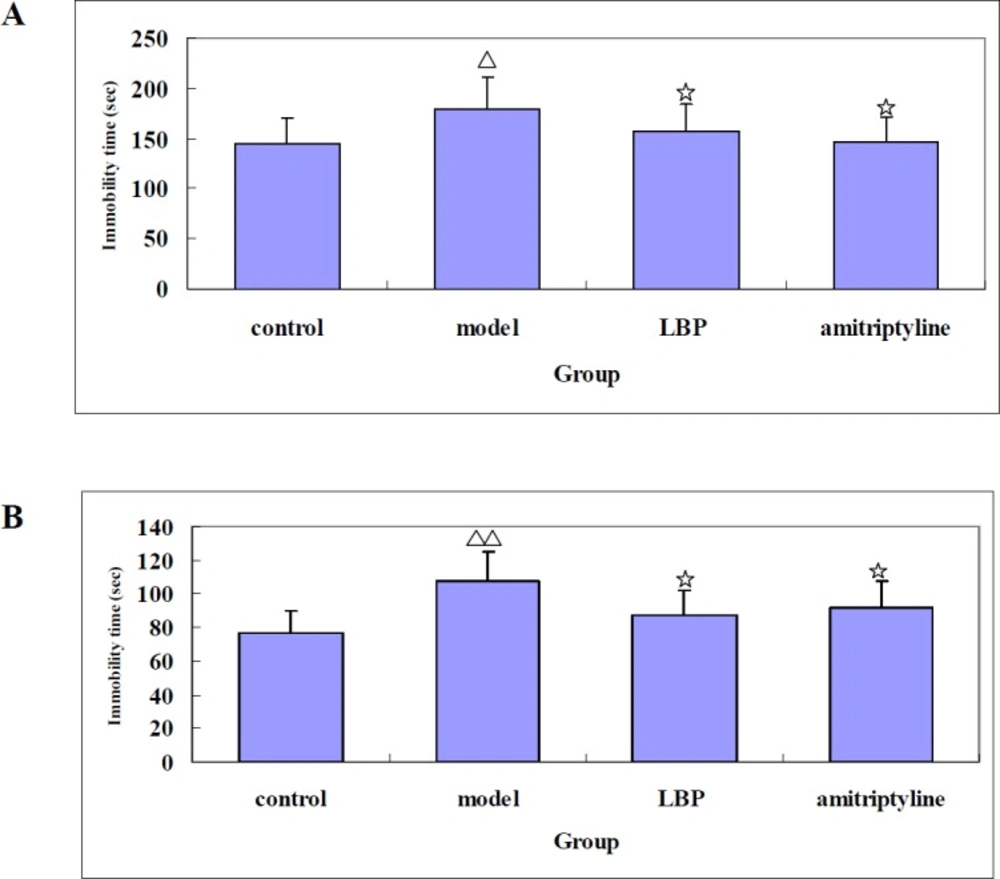
Forced swimming test (FST)
The FST was performed according to published methods with minor modification (
17). Briefly, the mice were individually placed in an open cylindrical container containing 19 cm of water at 25 ± 1℃ (diameter 10 cm, height 25 cm). The mice were considered immobile when they made only the movements necessary to keep their head above water. The immobility times of the mice during the final 4 min of the 6-min test were recorded and analyzed.
Tail suspension test (TST)
The TST was measured according to the method described by Steru
et al. (
18) as a facile means of evaluating potential antidepressants. Briefly, the mice were individually suspended by tail with a clamp 50 cm above the floor by adhesive tape placedapproximately 1 cm from the tip of the tail. The duration of the test was 6 min, and immobility was determined for the last 4 min of the test. The mice were considered immobile only when they hung passively and completely motionless.
Reserpine antagonism test
The reserpine antagonism test was performed according to the method described previously (
19,
20). The rectal temperature was measured with a digital thermometer.
The degree of ptosis was rated according to the following rating scale: 0, eyes open; 1, one-quarter closed; 2, half closed; 3, three-quarters closed; 4, completely closed.
Assessment of lipid peroxidative (LPO) indices
The mice were sacrificed 1 h after behavioral quantification. The brain was quickly removed and the part of striatum was further dissected out. The dissected out striatum tissue was rinsed with isotonic saline and weighed, and then it was homogenized with 0.1 N HCl. A 10% (w/v) tissue homogenate was prepared in a 0.1 M phosphate buffer (pH 7.4). Lipid peroxide concentration was measured by the thiobarbituric acid reactive substance (TBARS) assay (
21).
Measurement of antioxidant enzymes
1 g striatum tissues were homogenated. The 10% preparation of tissue homogenate was centrifuged with 3,000 rpm at 4 ℃for 15 min. The supernatant was collected for determination of SOD, GSH-Px, and CAT. The activities of SOD, GSH-Px, and CAT were measured using commercial kit. The manipulation was progressed strictly according to the kit instruction manual.
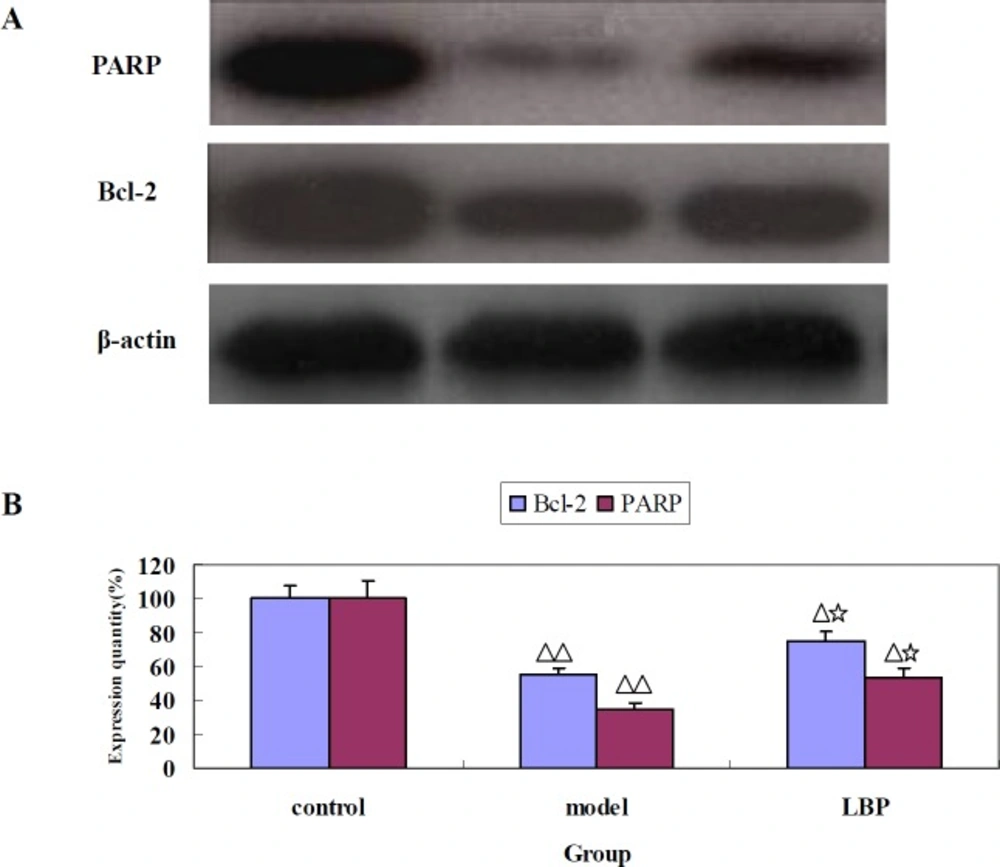
Western blot
The Proteins of the striatum tissues of the mice were separated by 15% sodium dodecyl sulfate-polyacrylamide gel electrophoresis (SDS-PAGE), after which the resolved proteins were transferred to nitrocellulose membranes for 2 h. Each membrane was incubated separately with primary antibody: anti-Bcl-2, or anti-PARP antibody (Santa Cruz Biotechnology, CA, USA), overnight at 4℃. The membranes were then washed with washing buffer and incubated with horseradish peroxidase-conjugated secondary antibodies at room temperature for 1 h. After washing, the protein bands were visualized by using an enhanced chemiluminescence (ECL) system. Densitometric analysis of the western blots was performed by using a GS-670 Imaging Densitometer (BioRad) and Molecular Analyst Software (version 1.3).
Statistical analysis
All the results were expressed as the mean ± S.D. P-values of less than 0.05 were considered to be significant. Statistical analysis was performed by one-way analysis of variance (ANOVA). All the grouped data were statistically evaluated with SPSS 13.0 software. Statistical significance of differences between two groups was determined using the post hoc test.