


1. Background
2. Objectives
3. Methods
3.1. Chemicals and Reagents
3.2. Cell Culture
3.3. Cell Viability Assay
3.4. Western Blotting
3.5. Immunofluorescence
3.6. Apoptosis Analysis
3.7. Intracellular Reactive Oxygen Species Level Detection
3.8. Antioxidant Index Measurements
3.9. Statistical Analysis
4. Results
4.1. Effects of Schisanhenol and Mycophenolic Acid on the Viability of Caco-2 Cells
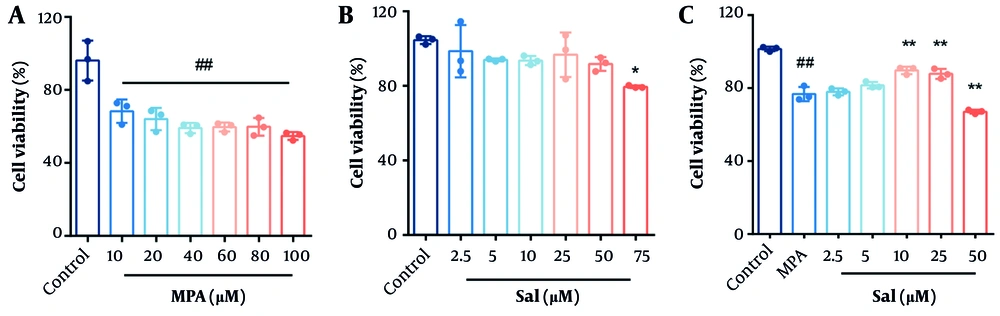
A and B, effects of Schisanhenol (Sal) and mycophenolic acid (MPA) on the viability of Caco-2 cells. Caco-2 cells were treated with different concentrations of MPA (10 - 100 μM) and Sal (2.5 - 75 μM) alone for 24 hours; C, 10 μM MPA was co-treated with different concentrations of Sal (2.5 - 50 μM) for 24 hours. Every group n = 3. * P < 0.05 and ** P < 0.01 significantly different from the MPA group. #, ## P < 0.05 and 0.01 were significantly different compared to the control group. The data are shown as the mean ± SD of n = 3.
4.2. Inhibition of Mycophenolic Acid-Induced Apoptosis in Caco-2 Cells by Schisanhenol
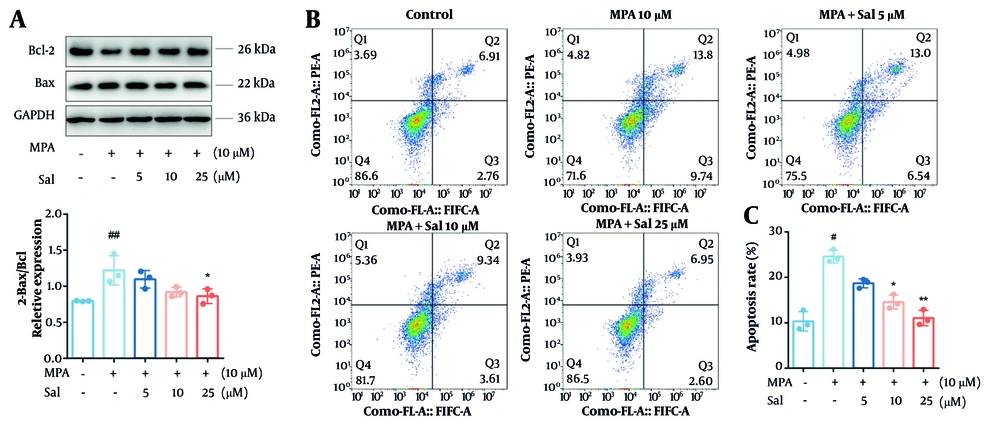
Schisanhenol (Sal) reduced apoptosis in Caco-2 cells caused by mycophenolic acid (MPA). Cells were treated with 10 μM MPA and different concentrations of Sal (5, 10, 25 μM) for 24 hours. A, apoptosis-related protein levels were detected by Western blot; and B and C, apoptosis was determined by flow cytometry. *, ** P < 0.05 and 0.01 were significantly different from the MPA group. # P < 0.05 and ## P < 0.01 significantly different compared to control group. The data are shown as the mean ± SD of n = 3.
4.3. Schisanhenol’s Inhibition of Mycophenolic Acid-Induced Disruption of Tight Junction Structure in Caco-2 Cells
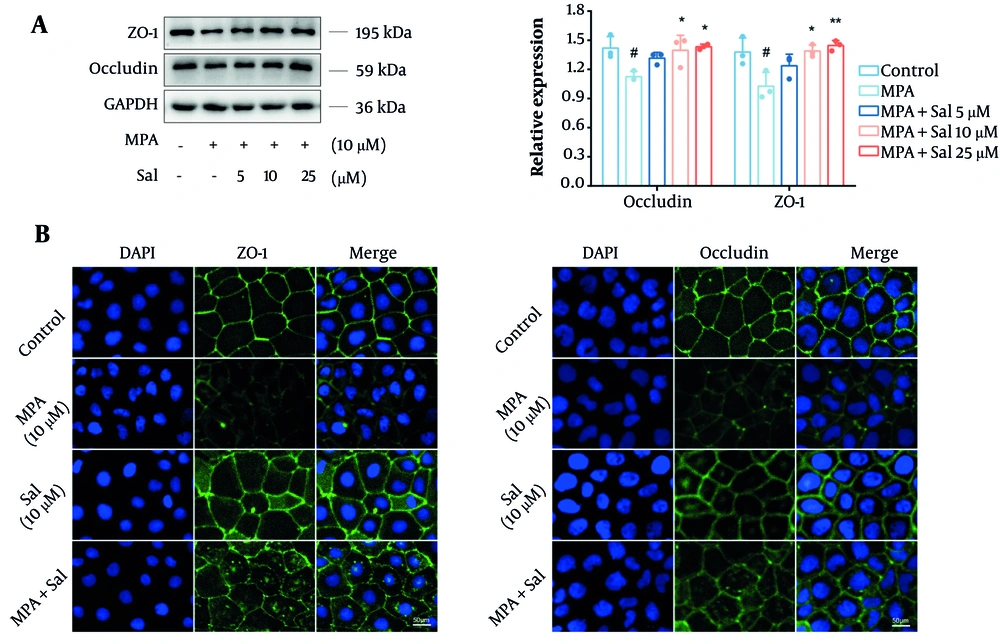
Schisanhenol (Sal) inhibited mycophenolic acid (MPA) to disrupt the tight junction (TJ) structure of Caco-2 cells. 10 μM MPA and 5, 10, 25 μM Sal were treated with Caco-2 cells for 24 hours. A and B, Western blot and immunofluorescence experiments were performed to determine the expression and distribution of occludin and ZO-1. DAPI showed blue fluorescence, occludin and ZO-1 showed green fluorescence. *, ** P < 0.05 and 0.01 were significantly different from the MPA group. # P < 0.05 significantly different from the control group. The data are shown as the mean ± SD of n = 3.
4.4. Inhibition of Mycophenolic Acid-Induced Reactive Oxygen Species Overaccumulation by Schisanhenol
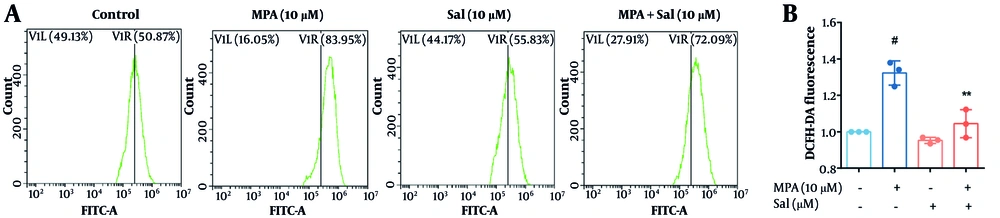
Schisanhenol (Sal) inhibited mycophenolic acid (MPA)-induced reactive oxygen species (ROS) overaccumulation. After 24 hours of treatment with 10 μM Sal and 10 μM MPA, A, the H2DCFDA probe was loaded and the average fluorescence intensity was detected by flow cytometry to assess intracellular ROS levels. B, quantification of A. ** P < 0.01 significantly different from MPA group. # P < 0.05 significantly different compared to the control group. The data are shown as the mean ± SD of n = 3.
4.5. Modulation of the Nrf2/HO-1 Pathway by Schisanhenol to Enhance Antioxidant Capacity in Caco-2 Cells
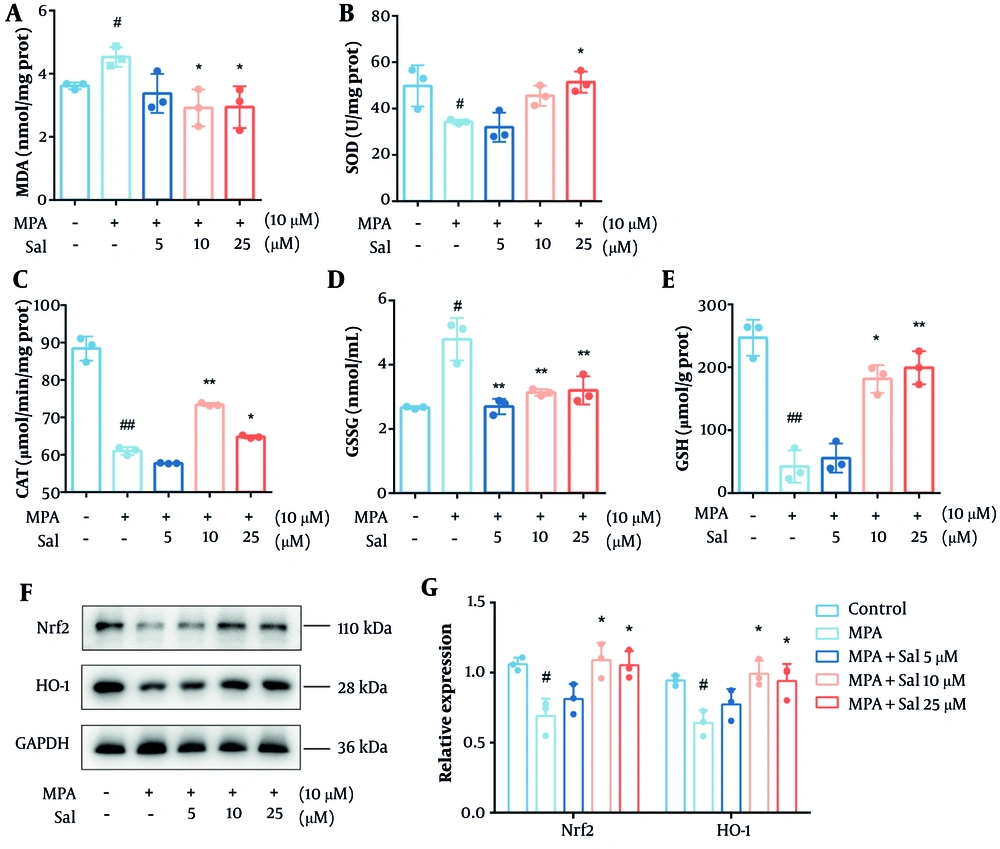
Schisanhenol (Sal) modulated the Nrf2/HO-1 pathway to improve antioxidant capacity in Caco-2 cells. After 24 hours of treatment with Sal (5, 10, 25 μM) and 10 μM mycophenolic acid (MPA), the kit detected A, MDA; B, SOD; C, CAT; D, GSSG; E, GSH content; and F and G, western blot determined Nrf2, HO-1 protein expression levels. * P < 0.05, ** P < 0.01 Significantly different from MPA group. # P < 0.05, ## P < 0.01 significantly different from control group. The data are shown as the mean ± SD of n = 3.
4.6. Abolishment of Schisanhenol’s Antioxidant and Anti-Barrier Damage Effects Through Nrf2 Inhibition
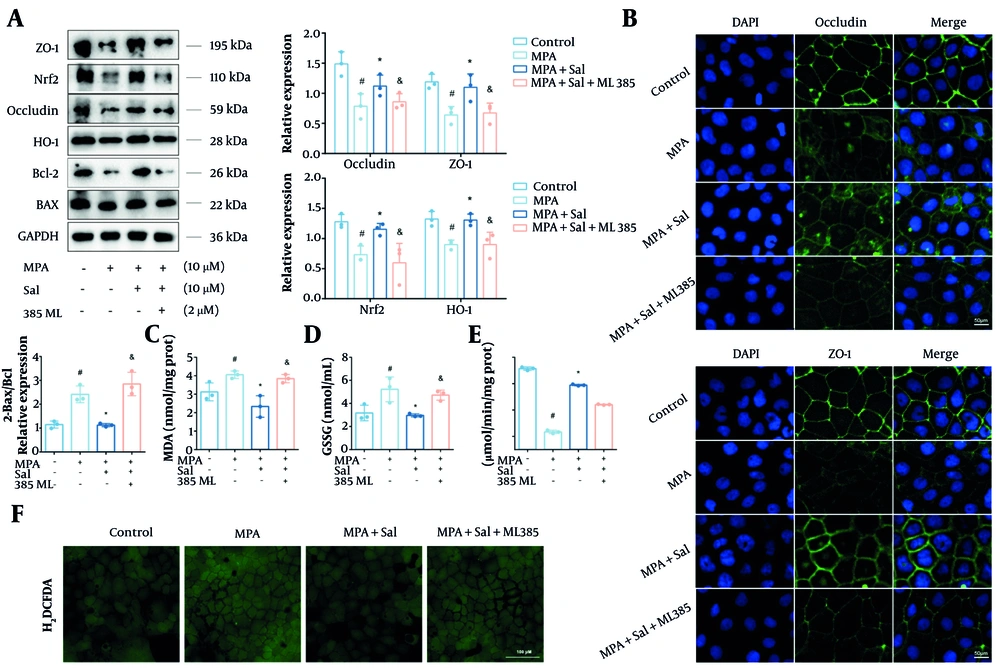
Inhibition of Nrf2 abolished the antioxidant and anti-barrier damage effects of Schisanhenol (Sal). A, after 24 hours of treatment with Sal (5, 10, 25 μM) and 10 μM mycophenolic acid (MPA), Bax, Bcl-2, occludin, ZO-1, Nrf2 and HO-1 protein levels were detected by Western blot; B, immunofluorescence experiments were performed to determine the expression and distribution of occludin and ZO-1. DAPI showed blue fluorescence, occludin and ZO-1 showed green fluorescence; The kit detected C, MDA; D, GSSG; E, CAT; F, the H2DCFDA probe was loaded and detected by fluorescence inverted microscope to assess intracellular reactive oxygen species (ROS) levels. * P < 0.05 significantly different from MPA group. # P < 0.05 significantly different from control group. & P < 0.05 significantly different from MPA + Sal group. The data are shown as the mean ± SD of n = 3.





