1. Background
Acute kidney injury (AKI) is a clinical syndrome characterized by a rapid decline in renal function over hours to days. It is primarily identified by elevated serum creatinine levels and/or reduced urine output, leading to the accumulation of nitrogenous waste products and disruption of internal homeostasis (1). Sepsis is a major contributor to the etiology of AKI (2). The pathophysiological mechanisms underlying AKI include renal tubular epithelial cell injury, oxidative stress, inflammatory responses, and mitochondrial dysfunction (3-5). AKI poses a serious global public health challenge because of its high incidence and mortality. It not only directly threatens patient survival but is also strongly associated with adverse long-term outcomes (6). Currently, no highly effective targeted pharmacological therapies are available for AKI, and clinical management remains largely supportive, with limited therapeutic success (7). Therefore, developing novel treatment strategies is critically important and represents a key step toward improving patient outcomes.
Mitochondrial dysfunction plays a central role in the development and progression of AKI. Various injurious stimuli lead to the loss of mitochondrial membrane potential, excessive production of reactive oxygen species (ROS), reduced ATP synthesis, and disrupted mitochondrial dynamics. These alterations directly contribute to renal tubular epithelial cell damage and death (8, 9). Excessive mitochondrial ROS not only directly injure cells but also promote inflammasome activation and trigger programmed cell death pathways, including apoptosis. This creates a vicious cycle that exacerbates kidney tissue injury (10). In response to mitochondrial damage, mitophagy is activated to eliminate dysfunctional mitochondria and preserve cellular homeostasis. The PINK1/Parkin pathway plays a key role in this process. Upon loss of membrane potential, PINK1 stabilizes on the outer mitochondrial membrane and recruits Parkin, thereby initiating mitophagy (11, 12). Previous studies have shown that SIRT1 enhances this protective mitophagy by deacetylating and positively regulating PINK1 activity, thereby effectively reducing renal tubular injury (13). In summary, targeting mitochondrial dysfunction and mitophagy represents a promising therapeutic strategy for AKI. However, the role of the SIRT1/PINK1 pathway in specific AKI subtypes, such as sepsis-associated AKI, remains an important unresolved question.
Tanshinone IIA, a lipophilic diterpenoid quinone derived from the traditional Chinese herb Salvia miltiorrhiza, exhibits a range of pharmacological properties, including anti-inflammatory, antioxidant, anti-apoptotic, and anti-fibrotic activities. It has demonstrated clear renoprotective effects in AKI by suppressing oxidative stress, reducing inflammation, inhibiting apoptosis, and attenuating fibrosis (14, 15). Moreover, studies suggest that Tanshinone IIA can modulate the GSK3β pathway to prevent the progression from AKI to chronic kidney disease (16, 17). Activation of the SIRT1 signaling pathway may represent a key underlying mechanism. For example, Tanshinone IIA has been shown to specifically activate SIRT1, thereby improving mitochondrial function, alleviating endoplasmic reticulum stress, and suppressing programmed cell death in models of lung injury and neurodegenerative diseases (18-20). Taken together, these findings suggest that Tanshinone IIA may exert its protective effects through SIRT1/PINK1-mediated mitophagy.
2. Objectives
In this study, we aimed to investigate the molecular mechanisms of Tanshinone IIA in AKI using an LPS-induced mouse model. We first assessed renal function parameters and histopathological changes in kidney tissue. Subsequently, we measured ATP levels, mitochondrial ROS, and mitochondrial membrane potential. Finally, we analyzed the SIRT1/PINK1 signaling pathway and autophagy-related markers. These findings provide a theoretical and experimental basis for developing targeted therapies for AKI.
3. Methods
3.1. Reagents
Tanshinone IIA (HY-N0135) and LPS (HY-D1056) were purchased from MedChemExpress (USA). Tanshinone IIA was dissolved in dimethyl sulfoxide (DMSO), and LPS was dissolved in double-distilled water.
3.2. Animals
All animal procedures were approved by the Animal Ethics Committee of Zhinanzhen Biology (approval No. A2024000884) and were conducted in strict accordance with the ARRIVE guidelines. Six-week-old male C57BL/6 mice were purchased from Hunan Slac Jingda Lab Animal Company and housed under standard laboratory conditions with free access to food and water. All animals were acclimatized for 7 days before the experiments. Mice were randomly divided into three groups: 1) the control group, which received an intraperitoneal injection of an equal volume of sterile saline; 2) the AKI model group, which received a single intraperitoneal injection of LPS (10 mg/kg) and was maintained for 24 hours to induce AKI (21); and 3) the Tanshinone IIA pretreatment group, which received an intraperitoneal injection of Tanshinone IIA (10 mg/kg) (15, 22) before LPS administration (10 mg/kg). At the end of the experimental period, mice were euthanized by cervical dislocation. Kidney tissues were promptly collected. Some tissues were fixed in 4% paraformaldehyde for histological analysis, and the remaining tissues were snap-frozen in liquid nitrogen and stored at -80°C for subsequent analyses.
3.3. Hematoxylin and Eosin Staining
Hematoxylin and eosin staining of kidney sections was performed as described previously (23). Briefly, paraffin-embedded kidney sections were baked and then deparaffinized in xylene I and II for 20 minutes each. The sections were hydrated through absolute ethanol I and II for 5 minutes each to remove residual xylene. After rinsing in absolute ethanol, the sections were washed under running water. Nuclei were stained with hematoxylin for 3 - 5 minutes, followed by rinsing in running water. The sections were then briefly immersed in eosin staining solution, differentiation solution, and bluing solution, with quick rinses in running water between each step. Dehydration was performed by sequential immersion in 85% ethanol, 95% ethanol, absolute ethanol I, II, and III, followed by n-butanol and xylene I and II for 3 - 5 minutes each. Finally, the sections were mounted with coverslips using neutral resin, air-dried, and observed under a light microscope for image acquisition.
3.4. Serum Creatinine, Blood Urea Nitrogen, and Tissue ATP Testing
Blood samples were collected and allowed to clot at room temperature for 1 hour. Serum was obtained by centrifugation at 3,000 × g for 30 minutes at 4°C, aliquoted, and stored at -80°C until analysis. For tissue ATP measurement, approximately 100 mg of kidney tissue was homogenized in 1 mL of ice-cold RIPA lysis buffer containing protease inhibitors. The homogenate was centrifuged at 12,000 × g for 10 minutes at 4°C, and the supernatant was collected (24). Serum creatinine (Scr) and blood urea nitrogen (BUN) concentrations were quantified using commercially available kits according to the manufacturers' protocols (25). Absorbance was measured at specific wavelengths (Cr: 515 nm; BUN: 580 nm; ATP: 460 nm) using a microplate reader. Absolute concentrations were calculated based on standard curves generated for each assay.
3.5. Reactive Oxygen Species Assessment
Mitochondrial superoxide levels were assessed in frozen kidney sections using the MitoSOX Red fluorescent probe (26). Briefly, after rewarming, sections were incubated with 5 μmol/L MitoSOX Red working solution in a humidified chamber at 37°C for 10 minutes, protected from light. The sections were then washed three times with phosphate-buffered saline (PBS) on a decolorizing shaker in the dark. Nuclei were counterstained with DAPI solution (1 μg/mL) at room temperature for 10 minutes in the dark. After nuclear staining, the sections were washed three times with PBS in the dark. Excess liquid was gently removed, and the sections were coverslipped using an anti-fade mounting medium. Fluorescence images were captured using a fluorescence microscope.
3.6. Mitochondrial Membrane Potential Assessment
Mitochondrial membrane potential was evaluated in frozen kidney sections using TMRE staining (27). After thawing, sections were incubated with 10 μmol/L TMRE working solution at 37°C for 20 minutes in the dark. The slides were then gently washed three times with PBS on a decolorizing shaker in the dark to remove unbound dye. After slight drying, nuclei were counterstained with DAPI for 5 - 10 minutes at room temperature in the dark. Following nuclear staining, the sections were washed three times with PBS in the dark. Excess liquid was removed, and the slides were mounted with an anti-fade mounting medium. Images were obtained using a fluorescence microscope.
3.7. Western Blotting Analysis
Kidney tissue samples were lysed in ice-cold RIPA buffer containing 1 mM PMSF. Lysates were centrifuged, and the supernatant was collected. Protein concentration was determined using a BCA protein assay kit. Equal amounts of total protein were separated by SDS-PAGE and transferred onto a PVDF membrane at a constant current of 300 mA under ice-cold conditions. The membrane was blocked with 5% skim milk in TBST at room temperature for 1 hour, followed by overnight incubation at 4°C with primary antibodies diluted in blocking buffer. After three washes with TBST, the membrane was incubated with an HRP-conjugated secondary antibody at room temperature for 1 hour, followed by three additional washes with TBST. Protein bands were visualized using an equal-volume mixture of enhanced chemiluminescence A/B chemiluminescent substrate and imaged with a chemiluminescence imaging system. The key antibodies used in this study are listed in Table S1 in Supplementary File.
3.8. Statistical Analysis
Data analysis was performed using GraphPad Prism version 9.0. All experiments were independently repeated at least three times. Data are presented as the mean ± standard deviation (SD). Comparisons between two groups were performed using an unpaired two-tailed Student t-test. For multiple-group comparisons, one-way analysis of variance was applied. A P value less than 0.05 was considered statistically significant (* P < 0.05; ** P < 0.01; *** P < 0.001).
4. Results
4.1. Tanshinone IIA Alleviates Lipopolysaccharide-Induced Renal Injury in Mice
We evaluated the effect of Tanshinone IIA on LPS-induced renal dysfunction in mice by measuring Scr and BUN levels. As shown in Figure 1, compared with the control group, LPS-treated mice exhibited markedly elevated Scr (Figure 1A; P < 0.001) and BUN (Figure 1B; P < 0.001) levels, indicating significant renal impairment. However, Tanshinone IIA treatment attenuated the LPS-induced increases in Scr and BUN. These results indicate that Tanshinone IIA effectively alleviates LPS-induced renal dysfunction in mice by preventing increases in Scr and BUN.
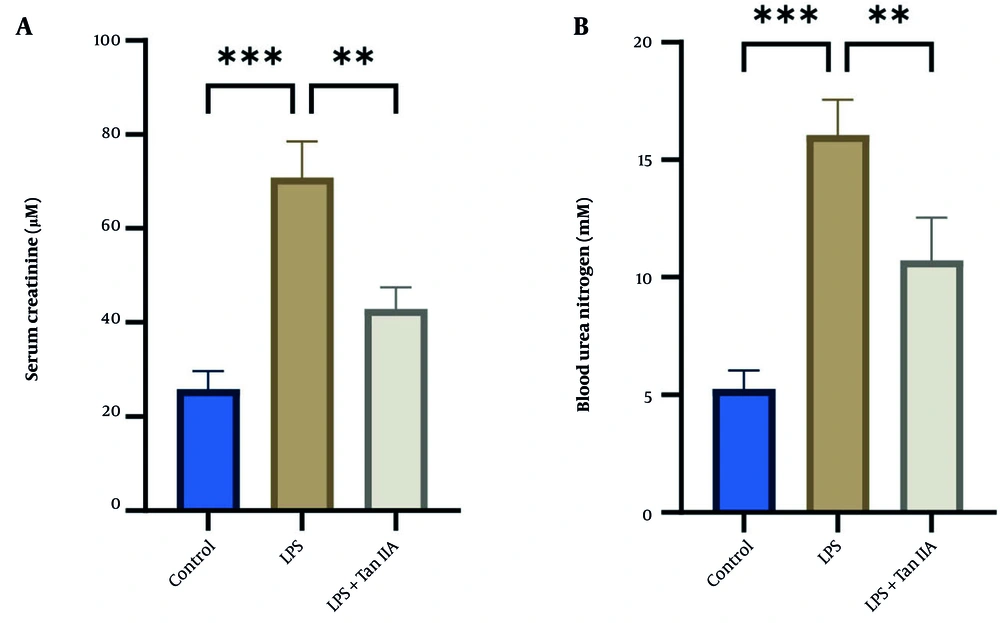
Figure 1.
Tanshinone IIA alleviates LPS-induced renal dysfunction in mice. A, Measurement of serum creatinine levels. B, Measurement of blood urea nitrogen levels. Data are presented as mean ± standard deviation from three independent biological replicates (statistical significance is indicated as ** P < 0.01 and *** P < 0.001; Abbreviations: LPS, lipopolysaccharide; Tan IIA, Tanshinone IIA).
In addition, HE staining (Figure 2A) showed that kidney sections from the control group displayed normal renal architecture, with clearly visible renal tubules and no evidence of cellular degeneration, atrophy, necrosis, inflammatory infiltration, or tubular lumen dilation. In contrast, the LPS group exhibited significant pathological changes, including tubular epithelial cell edema, vacuolar degeneration, loss of the brush border, and luminal dilation. Notably, Tanshinone IIA treatment markedly alleviated these LPS-induced renal tissue injuries. Consistent with these findings, tubular necrosis and inflammatory infiltration scores (Figure 2B) were significantly increased in LPS-induced AKI and were effectively reduced by Tanshinone IIA administration. These results support the protective role of Tanshinone IIA against LPS-induced renal damage at the histopathological level.
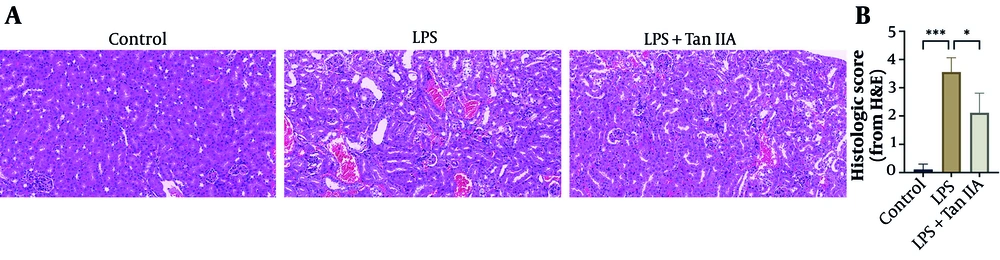
Figure 2.
Tanshinone IIA alleviates LPS-induced histopathological injury in mouse renal tissue. A, Representative hematoxylin and eosin (HE)-stained image captured using an inverted fluorescence microscope (40 ×). Scale bar = 50 μm. B, Renal tubular injury score based on HE staining. Data are presented as mean ± standard deviation from three independent biological replicates (statistical significance is indicated as * P < 0.05 and *** P < 0.001; Abbreviations: LPS, lipopolysaccharide; HE, hematoxylin and eosin; Tan IIA, Tanshinone IIA).
4.2. Tanshinone IIA Improves Lipopolysaccharide-Induced Acute Kidney Injury in Mice by Enhancing Mitochondrial Function and Reducing Oxidative Stress
To investigate the effects of Tanshinone IIA on mitochondrial function in LPS-induced AKI, we measured ATP content, mitochondrial ROS levels, and mitochondrial membrane potential in mouse kidney tissues. As shown in Figure 3A, ATP levels were significantly decreased in the renal tissues of LPS-treated mice compared with those of controls. In contrast, Tanshinone IIA treatment markedly restored ATP levels, indicating amelioration of LPS-induced impairment of renal energy metabolism. Mitochondrial ROS levels were also significantly elevated following LPS induction, whereas Tanshinone IIA intervention effectively suppressed this excessive ROS production, suggesting attenuation of mitochondrial oxidative stress (Figure 3B). Furthermore, as shown in Figure 3C, LPS administration resulted in a significant reduction in mitochondrial membrane potential, which was substantially restored by Tanshinone IIA treatment. Collectively, these findings indicate that Tanshinone IIA ameliorates LPS-induced AKI by enhancing ATP production, reducing mitochondrial ROS generation, and stabilizing mitochondrial membrane potential.
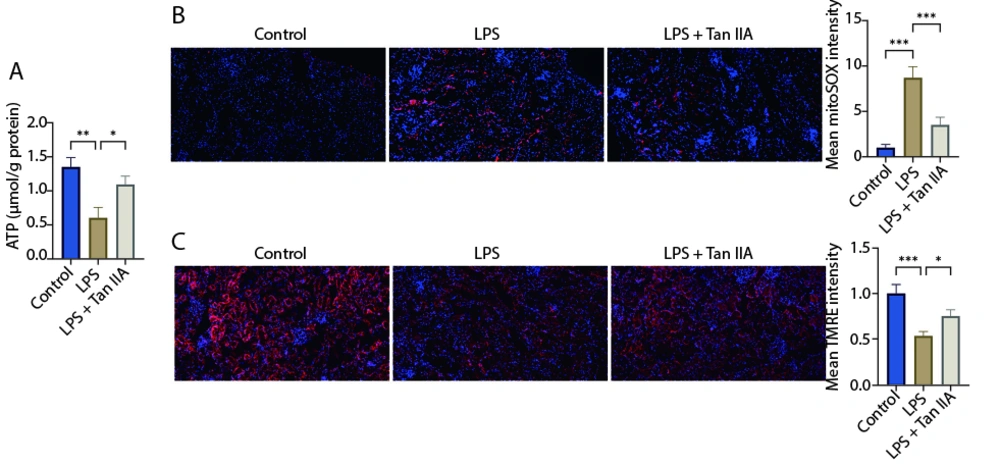
Figure 3.
Tanshinone IIA alleviates LPS-induced mitochondrial oxidative stress and dysfunction in mice. A, Assessment of ATP levels in renal tissue. B, Mitochondrial reactive oxygen species (ROS) levels measured by MitoSOX staining using an inverted fluorescence microscope (40 ×). Scale bar = 50 μm. C, Mitochondrial membrane potential detected by TMRE staining using an inverted fluorescence microscope (40 ×). Scale bar = 50 μm. Data are presented as mean ± standard deviation from three independent biological replicates (statistical significance is indicated as * P < 0.05, ** P < 0.01, and *** P < 0.001; Abbreviations: LPS, lipopolysaccharide; Tan IIA, Tanshinone IIA).
4.3. Tanshinone IIA Enhances SIRT1/PINK1-Mediated Mitophagy to Alleviate Lipopolysaccharide-Induced Acute Kidney Injury in Mice
To investigate the role of Tanshinone IIA in regulating autophagy during LPS-induced AKI, we analyzed the expression of key proteins in the SIRT1/PINK1 pathway and autophagy markers. Western blotting (Figure 4) showed that, compared with the control group, LPS treatment significantly increased the LC3-II/LC3-I ratio (P < 0.05) and decreased p62 protein levels (P < 0.01) in renal tissue. This activation of autophagy was accompanied by significant upregulation of the mitophagy-related protein PINK1 (P < 0.01) and its upstream regulator SIRT1 (P < 0.05). Notably, compared with the LPS group, Tanshinone IIA treatment further enhanced these effects, more markedly increasing the LC3-II/LC3-I ratio (P < 0.05), promoting p62 degradation (P < 0.01), and further upregulating the protein expression of PINK1 (P < 0.01) and SIRT1 (P < 0.05). These findings suggest that Tanshinone IIA may protect against LPS-induced AKI by activating the SIRT1/PINK1 pathway and enhancing autophagy.
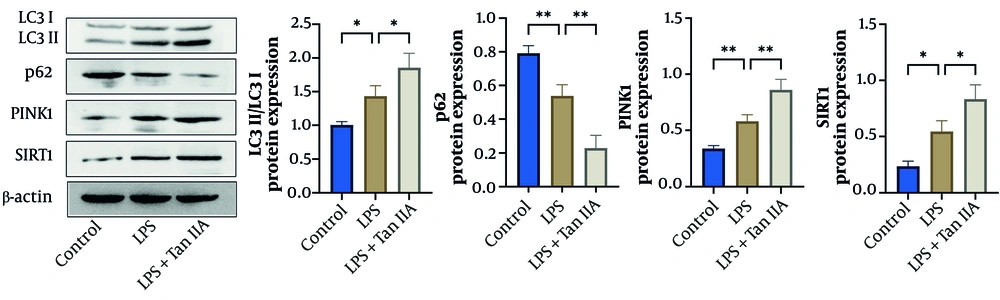
Figure 4.
Tanshinone IIA enhances LPS-induced mitophagy via the SIRT1/PINK1 pathway. Protein expression levels of LC3, p62, SIRT1, and PINK1 in mouse renal tissues were measured by Western blotting. Data are presented as mean ± standard deviation from three independent biological replicates (statistical significance is indicated as * P < 0.05 and ** P < 0.01; Abbreviations: LPS, lipopolysaccharide; Tan IIA, Tanshinone IIA).
5. Discussion
In this study, we investigated the protective effects of Tanshinone IIA against LPS-induced AKI in mice and explored the underlying mechanisms. Our findings indicate that Tanshinone IIA alleviates LPS-induced renal injury by improving mitochondrial function and reducing oxidative stress, potentially through activation of SIRT1/PINK1-mediated mitophagy.
Our results demonstrate that LPS administration significantly increased Scr and BUN levels and induced severe renal tissue damage. In contrast, pretreatment with Tanshinone IIA effectively suppressed elevations in Scr and BUN and markedly attenuated morphological injury, including tubular necrosis and inflammatory cell infiltration. These findings are consistent with previous studies in other AKI models. For instance, Tai et al. reported that Tanshinone IIA improved Scr, BUN, and renal histological damage in a model of renal ischemia-reperfusion injury in obese rats (15). Similarly, Dou et al. found that Tanshinone IIA significantly alleviated tubular necrosis and inflammatory infiltration in cisplatin-induced AKI (28). Collectively, these studies suggest that Tanshinone IIA exerts multitarget protective effects in the kidney across AKI models of different etiologies.
Mitochondrial dysfunction is widely recognized as a central factor in the pathogenesis of AKI. In this study, we found that Tanshinone IIA reversed LPS-induced ATP depletion in renal tissue, inhibited excessive mitochondrial ROS production, and stabilized the mitochondrial membrane potential. Consistent with our findings, Han et al. reported that Tanshinone IIA alleviates inflammation-induced skeletal muscle atrophy by modulating mitochondrial dysfunction (29). In addition, Luther et al. observed renal mitochondrial impairment in an animal model of sepsis-associated AKI (30), and Li et al. demonstrated that inhibition of NOX4 improves mitochondrial function and attenuates septic AKI (31). Taken together, these results provide direct evidence supporting the potential application of Tanshinone IIA as a modulator of mitochondrial function in AKI.
Mitophagy serves as a critical cellular defense mechanism in AKI by selectively eliminating damaged mitochondria to maintain cellular homeostasis. However, dysregulation of this process may exacerbate renal injury (32). The PINK1/Parkin pathway is a well-established and tightly regulated route that mediates mitophagy. Multiple studies support a protective role of the PINK1/Parkin pathway in AKI. For example, Wang et al. reported that, in sepsis-associated AKI, activation of the PINK1/PARK2/optineurin pathway enhanced mitophagy and alleviated renal injury (11). Lin et al. also found that, in contrast-induced AKI, BNIP3-mediated mitophagy suppressed apoptosis through upregulation of HIF1A (33). To further investigate whether Tanshinone IIA exerts protective effects in AKI via SIRT1-mediated mitophagy, we measured the expression of key proteins involved in this pathway. Our results show that LPS induced autophagy activation and increased the expression of PINK1 and its upstream regulator, SIRT1. Tanshinone IIA treatment further enhanced this response, as evidenced by an increased LC3-II/LC3-I ratio, accelerated p62 degradation, and elevated expression of PINK1 and SIRT1. Similar regulatory mechanisms have been reported in other studies. For instance, Dou et al. demonstrated that dimethyl α-ketoglutarate alleviated cisplatin-induced AKI by regulating mitophagy via the PINK1/Parkin pathway (34). Zhu et al. showed that αKlotho reduced mitochondrial ROS production and apoptosis by modulating FoxO3 and BNIP3 (35), further supporting the key role of mitophagy in AKI. In summary, this study suggests that Tanshinone IIA may improve mitochondrial function and confer renal protection in AKI by enhancing SIRT1/PINK1-mediated mitophagy.
5.1. Study Limitations
This study has several limitations. First, the requirement of the SIRT1/PINK1 pathway for mediating the effects of Tanshinone IIA has not been confirmed in vivo using inhibitors or knockout models. Second, autophagic flux was assessed using indirect markers such as p62 degradation and LC3 conversion; direct visualization using techniques such as an mRFP-GFP-LC3 dual-fluorescence adenovirus would provide more definitive evidence. Despite these limitations, our study provides preliminary evidence supporting the protective role of Tanshinone IIA against AKI.
5.2. Conclusions
Tanshinone IIA may protect against LPS-induced AKI by improving mitochondrial function and reducing oxidative stress through the activation of SIRT1/PINK1-mediated mitophagy. These findings provide new mechanistic support for the clinical application of Tanshinone IIA and highlight its therapeutic potential in sepsis-associated AKI.