


1. Background
2. Objectives
3. Methods
3.1. Materials and Reagents
3.2. Murine Model of Lipopolysaccharide-Induced Acute Lung Injury
3.3. Lung Wet/Dry Weight Measurement
3.4. Histopathology
3.5. Cellular Analysis of Bronchoalveolar Lavage Fluid
3.6. Enzyme-Linked Immunosorbent Assay
3.7. Measurement of Oxidative Stress Biomarkers and Myeloperoxidase Activity
3.8. Cell Culture and Treatment
3.9. Real-time qPCR
| Primers | Sequence(5’-3’) | Length/bp |
|---|---|---|
| GAPDH | 197 | |
| F | GGAGCGAGATCCCTCCAAAAT | |
| R | GGCTGTTGTCATACTTCTCATGG | |
| TNF-α | 124 | |
| F | AGCTGGTGGTGCCATCAGAGG | |
| R | TGGTAGGAGACGGCGATGCG | |
| IL-1β | 85 | |
| F | GCCAGTGAAATGATGGCTTATT | |
| R | AGGAGCACTTCATCTGTTTAGG | |
| IL-6 | 149 | |
| F | ACTCACCTCTTCAGAACGAATTG | |
| R | CCATCTTTGGAAGGTTCAGGTTG | |
| IL-8 | 194 | |
| F | TTTTGCCAAGGAGTGCTAAAGA | |
| R | AACCCTCTGCACCCAGTTTTC | |
| ICAM-1 | 80 | |
| F | TGCAAGAAGATAGCCAACCAAT | |
| R | GTACACGGTGAGGAAGGTTTTA |
Abbreviations: TNF-α, tumor necrosis factor-α; IL-1β, interleukin-1β; IL-6, interleukin-6; IL-8, interleukin-8; ICAM-1, intercellular cell adhesion molecule-1.
3.10. Reactive Oxygen Species Activity Assay
3.11. Evaluation of Mitochondrial Membrane Potential
3.12. Cell Apoptosis Analysis
3.13. Western Blot
3.14. Statistical Analysis
3.15. Molecular Docking
4. Results
4.1. Minocycline Protects Against Lipopolysaccharide-Induced Acute Lung Injury In Vivo
![Minocycline reduces lung inflammation caused by lipopolysaccharide (LPS) in vivo. A, proinflammatory cytokines level in bronchoalveolar lavage fluid (BALF) [tumor necrosis factor (TNF)-α, interleukin-1β (IL-1β), IL-6]; B, biomarkers of oxidative stress [malonaldehyde (MDA), superoxide dismutase (SOD)] of lung tissues; C, representative results of Hematoxylin and Eosin (H&E) staining and pathology scores of lung tissues (scale = 100 μm); D, wet/dry weight ratio of lungs; E, relative protein content; F, total cells; and G, neutrophils in BALF; H, MPO activity of lung tissues [(n = 6) values are mean ± SD. ### P < 0.001 vs. the control group, ** P < 0.01, *** P < 0.001 vs. LPS-treated group.](https://brieflands.com/journals/ijpr/articles/161381/figures/ijpr-161381-i001-F1-preview.webp "Minocycline reduces lung inflammation caused by lipopolysaccharide (LPS) in vivo. A, proinflammatory cytokines level in bronchoalveolar lavage fluid (BALF) [tumor necrosis factor (TNF)-α, interleukin-1β (IL-1β), IL-6]; B, biomarkers of oxidative stress [malonaldehyde (MDA), superoxide dismutase (SOD)] of lung tissues; C, representative results of Hematoxylin and Eosin (H&E) staining and pathology scores of lung tissues (scale = 100 μm); D, wet/dry weight ratio of lungs; E, relative protein content; F, total cells; and G, neutrophils in BALF; H, MPO activity of lung tissues [(n = 6) values are mean ± SD. ### P < 0.001 vs. the control group, ** P < 0.01, *** P < 0.001 vs. LPS-treated group.")
Minocycline reduces lung inflammation caused by lipopolysaccharide (LPS) in vivo. A, proinflammatory cytokines level in bronchoalveolar lavage fluid (BALF) [tumor necrosis factor (TNF)-α, interleukin-1β (IL-1β), IL-6]; B, biomarkers of oxidative stress [malonaldehyde (MDA), superoxide dismutase (SOD)] of lung tissues; C, representative results of Hematoxylin and Eosin (H&E) staining and pathology scores of lung tissues (scale = 100 μm); D, wet/dry weight ratio of lungs; E, relative protein content; F, total cells; and G, neutrophils in BALF; H, MPO activity of lung tissues [(n = 6) values are mean ± SD. ### P < 0.001 vs. the control group, ** P < 0.01, *** P < 0.001 vs. LPS-treated group.
4.2. Minocycline Attenuates Lipopolysaccharide-Induced Inflammation and Oxidative Stress in A549 Cells
![Minocycline inhibits inflammation and oxidative damage in lipopolysaccharide (LPS)-induced A549 cells. A, the mRNA levels of tumor necrosis factor (TNF)-α, interleukin-1β (IL-1β), IL-6, IL-8, and intercellular adhesion molecule (ICAM)-1 in LPS-induced A549 cells; B, intracellular reactive oxygen species (ROS) level; and C, biomarkers of oxidative stress [malonaldehyde (MDA), superoxide dismutase (SOD), glutathione peroxidase (GSH-Px)] in LPS-induced A549 cells [(n = 6) values are mean ± SD; ### P < 0.001 vs. the control group, ** P < 0.01, *** P < 0.001 vs. LPS-treated group.](https://brieflands.com/journals/ijpr/articles/161381/figures/ijpr-161381-i002-F2-preview.webp "Minocycline inhibits inflammation and oxidative damage in lipopolysaccharide (LPS)-induced A549 cells. A, the mRNA levels of tumor necrosis factor (TNF)-α, interleukin-1β (IL-1β), IL-6, IL-8, and intercellular adhesion molecule (ICAM)-1 in LPS-induced A549 cells; B, intracellular reactive oxygen species (ROS) level; and C, biomarkers of oxidative stress [malonaldehyde (MDA), superoxide dismutase (SOD), glutathione peroxidase (GSH-Px)] in LPS-induced A549 cells [(n = 6) values are mean ± SD; ### P < 0.001 vs. the control group, ** P < 0.01, *** P < 0.001 vs. LPS-treated group.")
Minocycline inhibits inflammation and oxidative damage in lipopolysaccharide (LPS)-induced A549 cells. A, the mRNA levels of tumor necrosis factor (TNF)-α, interleukin-1β (IL-1β), IL-6, IL-8, and intercellular adhesion molecule (ICAM)-1 in LPS-induced A549 cells; B, intracellular reactive oxygen species (ROS) level; and C, biomarkers of oxidative stress [malonaldehyde (MDA), superoxide dismutase (SOD), glutathione peroxidase (GSH-Px)] in LPS-induced A549 cells [(n = 6) values are mean ± SD; ### P < 0.001 vs. the control group, ** P < 0.01, *** P < 0.001 vs. LPS-treated group.
4.3. Minocycline Inhibits Lipopolysaccharide-Induced Apoptosis and Mitochondrial Dysfunction in A549 Cells
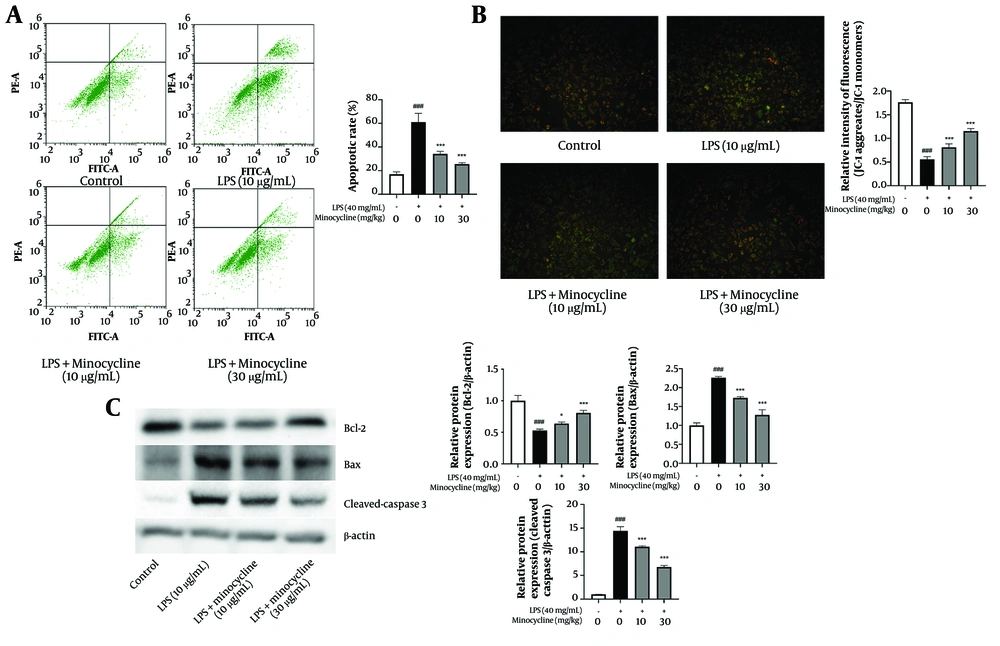
Minocycline inhibits the apoptosis and mitochondrial damage in lipopolysaccharide (LPS)-induced A549 cells. A, flow cytometry analysis for cell apoptosis in lipopolysaccharide (LPS)-induced A549 cells; B, the mitochondrial membrane potential which indicates by the red/green fluorescence ratio was measured by the JC-1; C, the B-cell lymphoma-2 (Bcl-2), Bcl-2 associated X protein (Bax), and cleaved-Caspase3 expression of LPS-induced A549 cells [(n = 6) values are mean ± SD; ### P < 0.001 vs. the control group, * P < 0.05, *** P < 0.001 vs. LPS-treated group..
4.4. Minocycline Reduces Lipopolysaccharide-Induced Activation of Poly (ADP-ribose) Polymerase-1 and Histone Deacetylase 3 Signaling Pathways
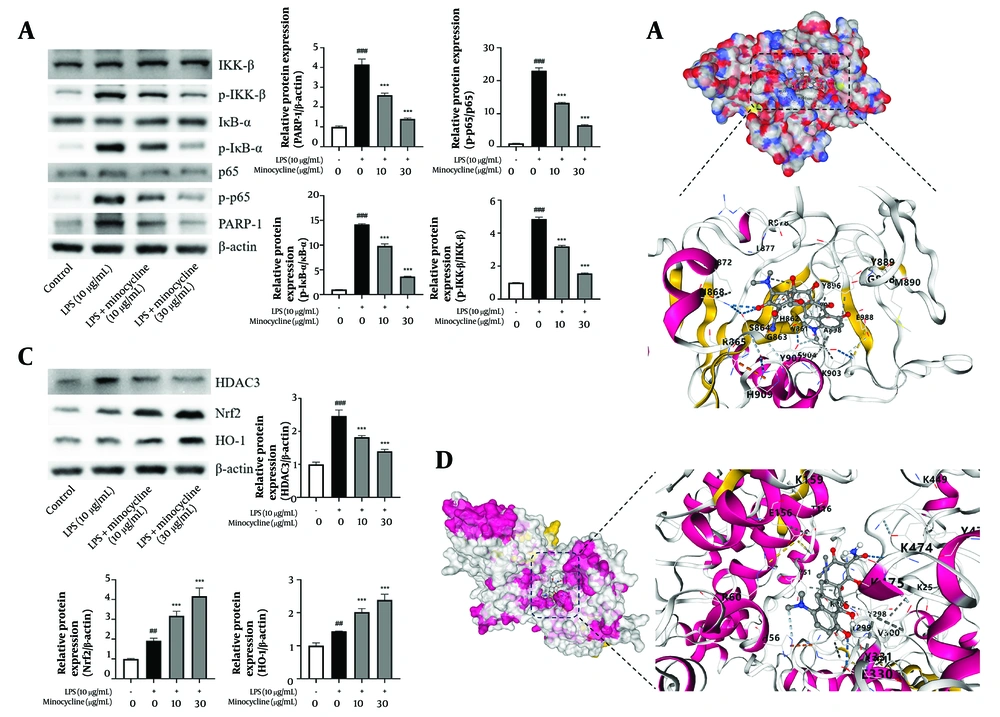
Minocycline reduces lipopolysaccharide-induced acute lung injury (ALI) through inactive poly (ADP-ribose) polymerase-1 (PARP-1) and histone deacetylase 3 (HDCA3) pathway. A and C, western blot analysis for PARP-1, p-p65, IKK-β, p-IKKβ, IκBα, p- inhibitor of kappa B (IκBα), nuclear factor erythroid 2-related factor 2 (Nrf2), heme oxygenase-1 (HO-1), and HDAC3 of lipopolysaccharide (LPS)-induced A549 cells; B and D, schematic diagram of molecular docking of minocycline with PARP-1 and HDAC3 [(n = 6) values are mean ± SD; ## P < 0.01, ### P < 0.001 vs. the control group, *** P < 0.001 vs. LPS-treated group.
| CurPocket ID | Vina Score (kcal/mol) | Cavity Volume (Å3) | Center (x, y, z) | Docking Size (x, y, z) |
|---|---|---|---|---|
| C1 | -8.1 | 233 | -4, 37, 11 | 22, 22, 22 |
| C2 | -7.0 | 139 | 5, 51, 7 | 22, 22, 22 |
| C3 | -6.2 | 334 | -3, 38, -3 | 22, 22, 22 |
| C4 | -6.1 | 194 | 15, 42, -1 | 22, 22, 22 |
| C5 | -5.7 | 515 | 18, 33, 16 | 22, 22, 22 |
| CurPocket ID | Vina Score (kcal/mol) | Cavity Volume (Å3) | Center (x, y, z) | Docking Size (x, y, z) |
|---|---|---|---|---|
| C1 | -8.7 | 21618 | 30, 63, 22 | 35, 35, 35 |
| C2 | -7.2 | 373 | 23, 45, 35 | 22, 22, 22 |
| C3 | -6.5 | 366 | 44, 58, 36 | 22, 22, 22 |
| C4 | -6.3 | 345 | 42, 49, 0 | 22, 22, 22 |
| C5 | -6.0 | 789 | 27, 32, 25 | 22, 22, 22 |





