
1. Background
Type 2 diabetes mellitus (T2DM) is a major global public health challenge, with increasing prevalence and substantial morbidity. Poor glycemic control contributes to serious complications, including cardiovascular disease, nephropathy, neuropathy, and retinopathy (1). Effective management therefore requires stringent regulation of blood glucose through lifestyle modification, pharmacotherapy, and routine monitoring of key metabolic markers such as fasting plasma glucose (FPG) and glycated hemoglobin (HbA1c) (2).
Beyond conventional therapies, natural products such as Saurauia bracteosa leaf extract have demonstrated antidiabetic effects in preclinical studies by reducing HbA1c and improving insulin sensitivity (3). Dietary modifications, including substitutions such as replacing white sugar with brown sugar, have also been shown to reduce HbA1c and inflammatory markers in patients with T2DM (4).
Vitamin D, a fat-soluble secosteroid essential for calcium homeostasis and bone health, has increasingly been recognized for its potential role in glucose metabolism (5). Several epidemiological studies have reported associations between vitamin D deficiency and an increased risk of T2DM as well as impaired glycemic control. Mechanistically, vitamin D is thought to influence insulin sensitivity and insulin secretion through its receptors in pancreatic beta cells and its involvement in inflammatory and metabolic pathways (6). In Iran, vitamin D deficiency is highly prevalent, with national data indicating rates exceeding 60% among adults (7).
In southwest Iran, anthropometric and cardiometabolic indices have been shown to predict T2DM, with the atherogenic index of plasma being a particularly strong predictor in this population (8).
2. Objectives
Given the inconsistencies in the existing literature, we hypothesized that lower serum 25-hydroxyvitamin D [25(OH)D] concentrations would be inversely associated with HbA1c and FPG. This study investigated the relationship between serum vitamin D status and key glycemic markers, including FPG and HbA1c, among patients with T2DM who attended the Dezful Diabetes Clinic.
3. Methods
3.1. Study Design and Setting
This analytical cross-sectional study was conducted at the Dezful Diabetes Clinic from December 2023 to December 2024. The study protocol was approved by the institutional review board (Approval Code: IR.DUMS.REC.1397.026) and the local medical ethics committee. The study was conducted after the initial ethics approval in 2018 because of administrative delays; however, the approved protocol remained unchanged, and according to institutional regulations for non-interventional observational research, the ethics approval remained valid throughout the active data collection period of 2023 - 2024. Written informed consent was obtained from all participants before enrollment, and the study adhered to the principles of the Declaration of Helsinki.
3.2. Participant Selection
Participant flow is illustrated in Figure 1. A total of 235 patients were screened; 30 did not meet the inclusion criteria, 15 declined participation, and 10 had incomplete data, leaving 180 participants for the final analysis.
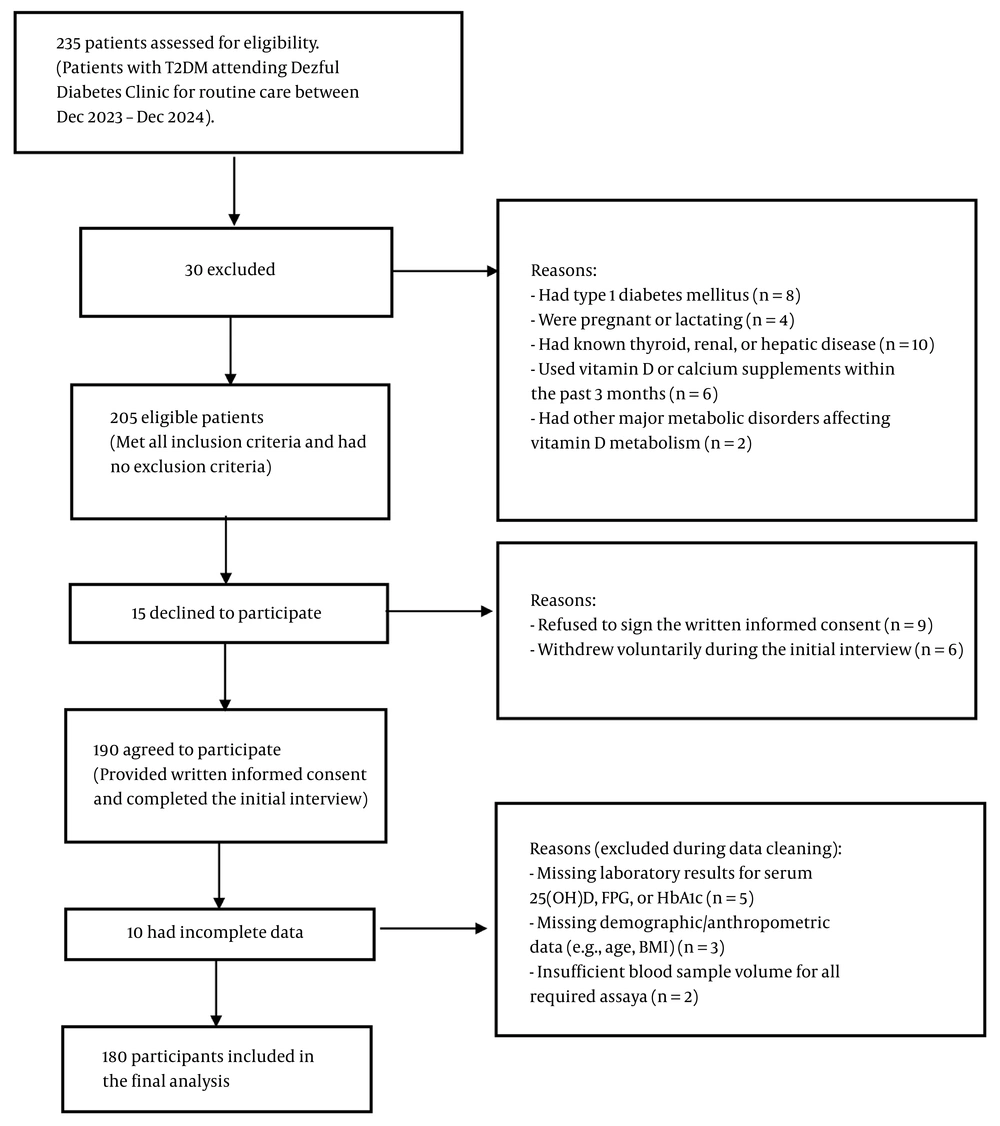
Figure 1.
Participant flow diagram illustrating the screening, enrollment, and exclusion process.
Participants were recruited from adult patients attending the clinic for routine diabetes care through simple random sampling using a computer-generated random number table based on the daily clinic list. The inclusion criteria were: 1) a confirmed diagnosis of type 2 diabetes mellitus based on American Diabetes Association diagnostic criteria; 2) no current or recent use of vitamin D or calcium supplements during the past 3 months; and 3) no documented hepatic, renal, endocrine, or other major metabolic disorders that could influence vitamin D metabolism or glycemic control. The exclusion criteria included type 1 diabetes, pregnancy, lactation, and known thyroid, renal, or hepatic disease.
Information on antidiabetic medication classes, including biguanides, sulfonylureas, dipeptidyl peptidase 4 inhibitors, and insulin, was systematically collected and considered a potential confounder in the statistical analysis.
3.3. Data Collection and Clinical Assessment
Demographic and socioeconomic data, including age, educational attainment, and occupational status, were collected using structured interviews conducted by trained personnel. Anthropometric measurements, including weight and height, were obtained using standardized procedures to calculate body mass index (BMI, kg/m2).
3.4. Biochemical Measurements
FPG, HbA1c, and serum 25(OH)D concentrations were measured at baseline. For FPG, venous blood was drawn after an overnight fast of 8 - 12 hours and measured using an enzymatic spectrophotometric method. HbA1c was measured by high-performance liquid chromatography.
Serum 25(OH)D concentrations were measured using a validated enzyme-linked immunosorbent assay (ELISA; Euroimmun, Lubeck, Germany), with internal quality control procedures applied to ensure assay accuracy. Vitamin D status was categorized using standard cutoffs: deficient (< 20 ng/mL), insufficient (20 - 30 ng/mL), and sufficient (> 30 ng/mL). Glycemic status was categorized based on ADA criteria: normal FPG < 100 mg/dL, prediabetes 100 - 125 mg/dL, and diabetes ≥ 126 mg/dL; and normal HbA1c < 5.7%, prediabetes 5.7% - 6.4%, and diabetes ≥ 6.5%.
3.5. Statistical Analysis
Statistical analyses were performed using SPSS software version 27.0 (IBM Corp., Armonk, NY, USA). Descriptive statistics were reported as mean ± standard deviation (SD) for continuous variables and as frequencies and percentages for categorical variables.
A priori power analysis indicated that n = 180 provided > 80% power to detect a Pearson correlation of r = 0.20 at alpha = 0.05 (two-tailed). Normality was assessed using the Shapiro-Wilk test; variables that deviated from normality were analyzed using nonparametric equivalents.
Comparisons between groups were performed using independent-samples t tests for dichotomous variables and one-way analysis of variance (ANOVA) with Tukey post hoc tests for comparisons across multiple categories. Pearson correlation coefficients were computed to evaluate linear associations between serum 25(OH)D and glycemic markers (FPG and HbA1c). Multivariable linear regression models were constructed with HbA1c, and separately FPG, as the dependent variable, with 25(OH)D entered as the primary predictor and adjustment for age, sex, BMI, and antidiabetic medication classes.
Associations between categorical variables, such as vitamin D status and HbA1c category, were assessed using the chi-square test or Fisher exact test when expected frequencies were < 5. The Shapiro-Wilk test indicated mild deviations from normality for 25(OH)D (W = 0.94, P < 0.001) and FPG (W = 0.95, P = 0.003). Nevertheless, given the sample size (n = 180), all group comparisons were verified using nonparametric equivalents (Mann-Whitney U and Kruskal-Wallis tests), which yielded results consistent with the parametric analyses. All statistical tests were two-tailed, and P < 0.05 was considered statistically significant.
4. Results
4.1. Baseline Characteristics
A total of 180 patients with T2DM were included in the study. The mean age of the participants was 55.02 ± 10.95 years (range, 27 - 84 years). Of the total sample, 50 patients (27.8%) were male and 130 (72.2%) were female. Baseline continuous characteristics of the study population, including FPG, HbA1c, and serum 25(OH)D concentrations, are summarized in Table 1. The mean FPG was 154.1 ± 60.7 mg/dL, the mean HbA1c was 8.14 ± 2.10%, and the mean serum 25(OH)D level was 27.1 ± 15.7 ng/mL.
Table 1.
Baseline Continuous Characteristics of the Study Population (N = 180) a
| Variables | Mean ± SD |
|---|---|
| Age (y) | 55.02 ± 10.95 |
| FPG (mg/dL) | 154.1 ± 60.7 |
| HbA1c (%) | 8.14 ± 2.10 |
| Vitamin D (ng/mL) | 27.1 ± 15.7 |
| BMI (kg/m2) | 28.4 ± 4.6 |
a FPG normal < 100, prediabetes 100 - 125, diabetes ≥ 126 mg/dL; HbA1c normal < 5.7%, prediabetes 5.7 - 6.4%, diabetes ≥ 6.5%; Vitamin D deficient < 20, insufficient 20 - 30, sufficient > 30 ng/mL.
4.2. Baseline Categorical Distributions
The categorical distribution of glycemic indices and vitamin D status is presented in Table 2. Based on FPG classification, 23 participants (12.8%) were within the normal range, 47 (26.1%) were classified as prediabetic, and 110 (61.1%) were classified as diabetic. According to HbA1c categories, 15 patients (8.3%) had normal values, 24 (13.3%) were prediabetic, and 141 (78.3%) were classified as diabetic. Regarding vitamin D status, 63 participants (35.0%) were vitamin D deficient, 56 (31.1%) had insufficient levels, and 61 (33.9%) had sufficient levels.
Table 2.
Baseline Categorical Distribution of Fasting Plasma Glucose, HbA1c, and Vitamin D Status (N = 180)
| Variables | No. (%) |
|---|---|
| FPG | |
| Normal | 23 (12.8) |
| Prediabetes | 47 (26.1) |
| Diabetes | 110 (61.1) |
| HbA1c | |
| Normal | 15 (8.3) |
| Prediabetes | 24 (13.3) |
| Diabetes | 141 (78.3) |
| Vitamin D | |
| Deficiency | 63 (35.0) |
| Insufficient | 56 (31.1) |
| Sufficient | 61 (33.9) |
4.3. Association With Sex
Sex-specific comparisons of glycemic indices and vitamin D concentrations are shown in Table 3. Mean HbA1c was significantly lower in male participants than in female participants (7.6 ± 1.7% vs. 8.3 ± 2.2%; P = 0.01). In contrast, no statistically significant sex differences were observed in FPG (141.0 ± 57.4 mg/dL in males vs. 159.1 ± 61.4 mg/dL in females; P = 0.40) or serum 25(OH)D levels (26.6 ± 16.2 ng/mL vs. 27.3 ± 15.5 ng/mL; P = 0.98).
Table 3.
Comparison of Fasting Plasma Glucose, HbA1c, and Serum 25(OH)D According to Sex (N = 180)
| Variables | No. | Mean ± SD | P-Value |
|---|---|---|---|
| FPG (mg/dL) | |||
| Male | 50 | 141.0 ± 57.4 | 0.40 |
| Female | 130 | 159.1 ± 61.4 | |
| HbA1c (%) | |||
| Male | 50 | 7.6 ± 1.7 | 0.01 |
| Female | 130 | 8.3 ± 2.2 | |
| Vitamin D (ng/mL) | |||
| Male | 50 | 26.6 ± 16.2 | 0.98 |
| Female | 130 | 27.3 ± 15.5 |
4.4. Association With Age
Comparisons across age groups are presented in Table 4. After merging age groups into three larger categories (< 50, 50 - 60, and > 60 years) to ensure statistical robustness, HbA1c remained significantly different across groups (P = 0.007), with younger patients showing the highest values. Notably, in this regrouped analysis, differences in FPG (P = 0.04) and serum 25(OH)D (P = 0.04) also reached statistical significance, indicating a trend toward better glycemic and vitamin D status in older participants.
Table 4.
Comparison of Fasting Plasma Glucose, HbA1c, and Serum 25(OH)D Across Age Groups (N = 180) a
| Variables | No. | Mean ± SD | P-Value |
|---|---|---|---|
| FPG (mg/dL); (y) | 0.04 | ||
| < 50 | 55 | 167.0 ± 64.1 | |
| 50 - 60 | 71 | 151.8 ± 64.8 | |
| > 60 | 54 | 144.1 ± 47.1 | |
| HbA1c (%); (y) | 0.007 | ||
| < 50 | 55 | 8.68 ± 2.45 A | |
| 50 - 60 | 71 | 8.06 ± 1.92 B | |
| > 60 | 54 | 7.70 ± 1.75 B | |
| Vitamin D (ng/mL); (y) | 0.04 | ||
| < 50 | 55 | 23.3 ± 12.0 | |
| 50 - 60 | 71 | 28.2 ± 16.6 | |
| > 60 | 54 | 29.7 ± 17.2 |
a For HbA1c (A, B) different capital letters indicate statistically significant differences between age groups based on Tukey post hoc testing (P < 0.05). Groups with the same letter are not significantly different. Specifically, the < 50-year group (A) differed significantly from both the 50 - 60-year and > 60-year groups (B).
4.5. Relationship Between Vitamin D Status and Glycemic Control
Serum 25(OH)D was significantly inversely correlated with HbA1c (r = -0.23; 95% CI, -0.36 to -0.09; P = 0.002) and FPG (r = -0.17; 95% CI, -0.31 to -0.02; P = 0.022). Multivariable regression confirmed an independent inverse association between 25(OH)D and HbA1c after adjustment (beta = -0.03; 95% CI, -0.05 to -0.01; P = 0.008; Table S1 in Supplementary File).
The distribution of HbA1c categories according to vitamin D status is shown in Table 5. Among participants with vitamin D deficiency, 54 of 63 individuals (85.7%) were classified as diabetic based on HbA1c levels, compared with 76.8% in the insufficient group and 72.1% in the sufficient group (χ2 = 6.11, df = 2, P = 0.047; the normal and prediabetes categories were combined for this analysis). This categorical association was statistically significant.
Table 5.
Distribution of HbA1c Categories According to Vitamin D Status with Row Percentages (N = 180) a
| Vitamin D | HbA1c Normal (%) | Prediabetes (%) | Diabetes (%) | Total | χ2 (P) |
|---|---|---|---|---|---|
| Deficiency | 4 (6.3) | 5 (7.9) | 54 (85.7) | 63 | χ2 = 6.11, df = 2 |
| Insufficient | 3 (5.4) | 10 (17.9) | 43 (76.8) | 56 | P = 0.047 |
| Sufficient | 8 (13.1) | 9 (14.8) | 44 (72.1) | 61 | |
| Total | 15 | 24 | 141 | 180 |
a Values are expressed as No. (%). Because of small expected frequencies in the full 3 x 3 table, normal and prediabetes categories were combined into "nondiabetic" for chi-square testing. The reported χ2 (6.11, df = 2, P = 0.047) is from the resulting 2 x 3 table. Fisher exact test yielded a similar P value.
5. Discussion
In this cross-sectional study of 180 patients with T2DM, we observed a high prevalence of both suboptimal glycemic control and inadequate vitamin D status. A substantial proportion of the sample was classified as diabetic by both FPG and HbA1c; notably, more than two-thirds exhibited either vitamin D deficiency or insufficiency. These results are consistent with prior evidence indicating that low vitamin D status is common among individuals with T2DM and frequently co-occurs with poorer glycemic regulation (9).
This study should be interpreted in light of several limitations. The cross-sectional design precludes causal inference. We lacked data on important potential confounders, including dietary vitamin D intake, sun exposure, physical activity, and medication adherence. In particular, the absence of season-of-sampling data represents a major limitation in our setting, as Dezful's extreme seasonal variation in sunshine duration and intensity profoundly influences 25(OH)D synthesis, and we could not account for this factor in the present analysis. The single-center sample may limit generalizability, and small numbers in certain age subgroups warrant cautious interpretation. Although multivariable regression adjusted for measured confounders, including age, sex, BMI, antidiabetic medications, education, and occupation, residual confounding due to unmeasured factors may still influence the observed associations.
The single-center nature of our study is similar to that of the Hoveyzeh cohort study conducted in the same region of southwest Iran, which included 7300 participants and identified the atherogenic index of plasma as the most significant predictor of T2DM in this population (8).
Our central finding, a modest but statistically significant inverse correlation between serum 25(OH)D and both glycemic markers, supports the hypothesis that lower vitamin D levels are associated with poorer glycemic control. Similar associations have been reported in prior cross-sectional and cohort studies; for example, Alkhatatbeh and Abdul‑Razzak reported r = -0.31 between 25(OH)D and HbA1c, which is comparable to our finding of r = -0.23 (10). Mirhosseini et al., in a meta-analysis of 24 controlled trials including 1528 patients with T2DM, reported that vitamin D supplementation significantly reduced HbA1c by a mean difference of -0.30% (95% CI, -0.45 to -0.15; P < 0.001) and fasting plasma glucose by -4.9 mg/dL (95% CI, -8.1 to -1.6; P = 0.003), particularly among populations with baseline vitamin D deficiency (11).
Beyond micronutrient status, dietary factors also influence HbA1c; for example, replacing white sugar with brown sugar has been shown to reduce HbA1c and inflammatory cytokines in patients with T2DM (4).
The predominance of participants with vitamin D deficiency in the diabetic HbA1c category (85.7% in our deficient group) was statistically significant in the combined categorical analysis (χ2 = 6.11, P = 0.047), further supporting the inverse association between vitamin D status and glycemic control. This pattern aligns with previous reports linking deficient vitamin D status with higher HbA1c values (10).
From a biological standpoint, several mechanisms may underlie the observed vitamin D–glycemia link. Vitamin D has been implicated in the modulation of pancreatic beta-cell function, insulin secretion, insulin sensitivity, and inflammatory pathways, all of which influence glucose homeostasis (12). Interventional trials and pooled meta-analyses provide additional context: among patients with low baseline 25(OH)D or impaired glucose metabolism, vitamin D repletion has been associated in some analyses with modest reductions in HbA1c and FPG, although findings across trials and meta-analyses are heterogeneous (11, 13, 14, 20-22). Large-scale randomized trials such as D2d (14) and VITAL (15) have further explored these associations, with some studies also reporting effects on inflammatory responses (16). Mechanistically, the triglyceride-glucose index has been investigated (17). Prospective cohort studies have consistently linked lower baseline 25(OH)D with higher T2DM risk (18, 19, 23, 24), while systematic reviews have underscored the complexity of these relationships (20). Regarding safety, the cardiovascular implications of supplementation have been extensively evaluated in large meta-analyses (25).
Natural products have also been explored for their antidiabetic potential; for instance, Saurauia bracteosa leaf extract reduced HbA1c in an animal model of T2DM (3).
Regarding demographic factors, we observed a sex difference: females had significantly higher mean HbA1c than males, whereas vitamin D did not differ by sex. This suggests that sex-specific biological or behavioral factors, including hormonal milieu, fat distribution, adherence patterns, and psychosocial factors, may influence glycemic control independent of vitamin D status (26). Age-related variations, with younger individuals (< 50 years) showing higher HbA1c than those in the oldest group (> 60 years), may reflect differences in disease duration, lifestyle, or survivorship bias. Neither BMI category nor socioeconomic variables were significantly associated with glycemic indices or vitamin D status in our sample; unmeasured factors, including physical activity, diet, and medication adherence, likely exerted stronger influences. Similarly, Mehrabbeik et al., in a retrospective study of 3454 patients with T2DM at the Yazd Diabetes Center in Iran, identified older age (OR = 1.03 per year, P < 0.001) and a higher education level (OR = 1.94 - 2.30, P < 0.001) as significant independent predictors of achieving HbA1c < 7%, further highlighting the influence of demographic factors on glycemic control in the Iranian population (27).
5.1. Conclusions
In this cross-sectional study of 180 adults with type 2 diabetes, vitamin D deficiency and insufficiency were highly prevalent (66.1%) and showed significant inverse associations with HbA1c and fasting plasma glucose. Poorer glycemic control was also independently associated with female sex. These findings align with previous meta-analytic evidence suggesting that improved vitamin D status is associated with modest reductions in HbA1c and complement recent studies highlighting the role of dietary factors and natural products in glycemic control. Although these findings suggest a link between low vitamin D status and impaired glucose regulation, the cross-sectional design precludes causal inference, and residual confounding may exist. Longitudinal and interventional studies are needed to determine whether vitamin D optimization improves glycemic outcomes in this population.