


1. Background
The higher education system has an important task in order to train specialized human resources in terms of quantity and quality, and can be more efficient when it performs its duties well in terms of quality. Thus, it is necessary to find ways to increase the quality of educational services (1).
Evaluating the quality of educational services and improving that, leads to more creativity of learners (2). Considering that the educational system plays an important role in training specialized personnel and causes the growth of society, the qualitative aspect of education requires more attention (3). One of the basic steps in improving the quality of health programs is to evaluate the quality of services from the viewpoint of beneficiaries (4).
The SERVQUAL model is one of the models used to measure quality, which was presented by Parasuraman et al. (5). This model is a multidimensional scale that investigates the gap between expectations and educational services provided in 5 dimensions that includes physical and tangible factors (having the physical facilities of the service and equipment and facilities), reliability (performing services reliably and reliably), responsibility (helping learners to provide services as quickly as possible), guarantee and credibility (the university's ability to provide accurate and reliable services) and empathy dimension (appropriate treatment of individual learners according to their emotional aspects so that they are satisfied) (6). Based on this model, service recipients evaluate quality by comparing their perceptions and expectations of the services received. Studies show that the SERVQUAL model is very effective in evaluating the quality of services (7, 8). The practical application of this model indicates its high capability compared to other models, which allows its dimensions to be matched with other factors (7).
Investigating of studies in this field shows that there is a significant distance from the desired situation. In a 2004 study in Singapore, Tan and Kek reported that the largest gap in the quality of educational services was in the area of guarantee and credibility (9). Branes In 2007 in China found that there was a negative gap in all aspects of service quality (10). Also studies in Iran showed a negative gap between students' perceptions and expectations in all aspects of educational services (11-14).
2. Objectives
Knowing the quality of the educational services provided can be the basis for planning, policy-making and improving the quality of educational services. The present study aims to assess the viewpoint of medical students and clinical teachers of Kashan University of Medical Sciences about quality of educational services.
3. Methods
3.1. Study Design
This was a cross-sectional descriptive-analytical study, and population included clinical teachers, residents, interns and clerkships of Shahid Beheshti Hospital in Kashan in 2018.
Considering that so far no study has evaluated the quality of clinical education services from the viewpoint of the four beneficiaries’ groups, so according to the possibilities of the present study, 80 people were selected equally in four groups (n = 20) using the convenience sampling method.
Inclusion criteria included people mentioned in Shahid Beheshti Hospital in Kashan in 2018 who were conducting educational activities and their exclusion criteria included unwillingness to participate in research and incomplete completion of the questionnaire.
Data collection tool, SERVQUAL standard questionnaire consisting of 22 pairs of questions related to measuring the quality of services in physical dimensions (1 to 4), guarantee (5 to 9), accountability (10 to 13), reliability (14 to 17) and empathy (18 to 22) on a scale of 7 were Likert options (strongly disagree = 1 to strongly agree = 7). SERVQUAL tool has been used in several studies and its validity and reliability have been confirmed (15). In the present study, Cronbach's alpha coefficient values for questions related to perceptions and expectations were 0.920 and 0.929, respectively, which indicates the acceptable reliability of the questionnaire.
3.2. Data Analysis
Collected data after entering SPSS software version 16 using descriptive statistics (mean and standard deviation) and inferential statistics (paired t-test to compare the mean of perceptions and expectations, independent t-test to compare the mean gap services between men and women analysis of variance to compare the average results from the perspective of the studied groups.
4. Results
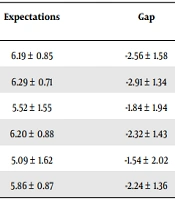
In the present study, 80 clinical teachers, assistants, interns and clerkships of Kashan Shahid Beheshti Hospital (20 people in each group) participated, of which women had the highest frequency (56.3%). Table 1 shows the average scores of perceptions, expectations and quality gap of educational services. Accordingly, the expectations (optimal status) of the participants in the total score of service quality and all its dimensions were significantly higher than their perceptions (current status) (P < 0.001). In other words, from the participants' point of view, there is a gap in all aspects of quality and its total score, with the highest quality gap in the guarantee dimension (-2.91 ± 1.34) and the lowest in the empathy dimension (-1.54 ± 2.02).
| Quality of Educational Services | Perceptions | Expectations | Gap | t | P-Value a |
|---|---|---|---|---|---|
| Physical | 3.63 ± 1.29 | 6.19 ± 0.85 | -2.56 ± 1.58 | -14.518 | 0.000 |
| Guarantee | 3.38 ± 1.34 | 6.29 ± 0.71 | -2.91 ± 1.34 | -15.800 | 0.000 |
| Responsiveness | 3.68 ± 1.12 | 5.52 ± 1.55 | -1.84 ± 1.94 | -8.485 | 0.000 |
| Confidence | 3.88 ± 1.04 | 6.20 ± 0.88 | -2.32 ± 1.43 | -14.518 | 0.000 |
| Empathy | 3.55 ± 1.11 | 5.09 ± 1.62 | -1.54 ± 2.02 | -6.820 | 0.000 |
| Total score | 3.62 ± 0.91 | 5.86 ± 0.87 | -2.24 ± 1.36 | -14.692 | 0.000 |
a Paired t-test.
The results of Table 2 show that the average gap between the total score of service quality and its dimensions from the viewpoint of women is higher than men, although these differences are not statistically significant (P > 0.05). Also, from the other results of Table 2, we can point to the existence of a significant relationship between the service quality gap and the educational levels of individuals (P < 0.05) so that in the physical dimension, the average service gap from the viewpoint of interns is significant. It has been more than residents and clerkships. Also in terms of guarantee, the average service gap from the viewpoint of clinical teachers and interns is significantly higher than Clerkships; In addition, in terms of responsiveness, confidence, empathy, and overall score, the average service gap from the viewpoint of clinical teachers, residents, and interns was significantly more considerable than clerkships.
| Quality of Educational Services | Gender | Educational Levels | ||||||
|---|---|---|---|---|---|---|---|---|
| Male | Female | P-Value* | Clinical Teachers | Assistants | Interns | Clerkships | P-Value** | |
| Physical | -2.75 ± 1.45 | -2.31 ± 1.71 | 0.222 | -2.95 ± 1.41 | -2.02 ± 1.39 | -3.24 ± 1.31 | -2.02 ± 1.85 | 0.020 |
| Guarantee | -3.02 ± 1.69 | -2.79 ± 1.61 | 0.541 | -3.54 ± 1.26 | -2.61 ± 1.62 | -3.38 ± 1.32 | -2.14 ± 2.00 | 0.020 |
| Responsiveness | -2.06 ± 1.68 | -1.55 ± 2.21 | 0.244 | -2.49 ± 1.29 | -1.90 ± 1.90 | -2.39 ± 1.85 | -0.57 ± 2.12 | 0.005 |
| Confidence | -2.34 ± 1.47 | -2.29 ± 1.39 | 0.874 | -2.85 ± 1.19 | -2.32 ± 1.09 | -2.67 ± 1.56 | -1.44 ± 1.49 | 0.007 |
| Empathy | -1.69 ± 1.94 | -1.35 ± 2.12 | 0.458 | -2.03 ± 1.65 | -1.77 ± 1.96 | -2.20 ± 2.18 | -0.16 ± 1.68 | 0.003 |
| Total score | -2.37 ± 1.37 | -2.06 ± 1.35 | 0.310 | -2.77 ± 1.10 | -2.13 ± 1.30 | -2.78 ± 1.19 | -1.27 ± 1.33 | 0.000 |
4.1. Ethical Considerations
The confidentiality of the participants was maintained by collecting anonymous questionnaires and participating of them in the study was not mandatory
5. Discussion
The results of the present study showed that the expectations of the services provided were not met and in all aspects of the quality of educational services, there was a negative gap between the perceptions and expectations of learners. The mean total quality gap as well as all five dimensions of educational services quality were the same in terms of age, gender, and year of residency and did not have a statistically significant difference. However, all five dimensions as well as the overall dimension were significantly different according to the participating group. Mean total quality gap between the studied groups according to the participating group, there was a significant difference so that there was the largest gap in the interns and the lowest in the clerkship.
The investigations show that students who are more satisfied with the quality of educational services will have a higher level of learning and growth (4, 16, 17).
In the study of Ayatollahi et al. (18), in contrast to the present study, the confidence dimension has the highest average score of opinions, which indicates that there are sufficient study resources to increase students' knowledge and expertise, and discussions and exchanges are well done in the classroom by teachers.
The results of Mortazavi and Razmara's study were in contradiction with the present study and the highest level of students' satisfaction included teachers' knowledge, performance and teaching methods (19). This is in line with the results obtained from Ayatollahi et al.’s study (18).
In contradiction to the present study, some studies (4, 20, 21) showed that the highest mean score of opinions was related to the guarantee dimension. So different educational groups in scoring should behave in such a way that there is a guarantee for a better score if more effort is made.
In Sabahi Bidgoli and Kebriaie study in Kashan (22), the highest average score of opinions related to the confidence dimension was reported. However, in the present study, 11 years after the previous study in Kashan, different results were obtained. Perhaps the most important reason for this difference is the change in the spectrum of the curriculum and clinical teachers, as well as the gradual changes in the patterns of scientific advancement from the educational dimension to the research and cultural dimensions.
Although the scientific level of teachers and their specialized knowledge is of acceptable quality for educating students in most studies, nevertheless, gaining qualifications, medical knowledge, motivation to learn, and a positive attitude is realized in the clinical environment by observing the behavior and performance of teachers (23).
In the study of Ayatollahii et al. (18) in contradiction with the present study, the lowest average score of comments is observed in the dimension of responsiveness, which indicates that students do not have enough satisfaction due to the lack of teachers when needed.
The empathy dimension was the lowest mean score of opinions in the study of Arbouni et al. (20) which was in contradiction with the present study and Sabahi Bidgoli and Kebriaie. It shows that students are dissatisfied with the inflexibility of teachers in the face of special circumstances, the behavior of teachers with respect to students, and the attitude of the instruction staff (22).
In some studies, (4, 18, 21) in contradiction with the present study, the responsiveness dimension had the lowest mean score.
Seyedaskari et al. (24) found that there is a negative gap in all five dimensions of the quality of educational services.
The existence of a negative gap in the quality of educational services will reduce the motivation of residents and interns to learn, and this will disrupt the training of creative doctors in the future. It seems that educational services in all dimensions need to be reformed and reviewed. This finding is consistent with the results of various other studies (4, 7, 11, 25).
De Oliveira and Ferreira's study in Brazil showed that the quality problems of higher education in developing countries were serious and that in order to change this approach, the capital was needed to improve quality systems (26).
Based on the study’s findings the highest mean score of the quality gap is related to the physical and tangible dimensions (11, 24, 27, 28). This quality gap indicates that the necessary educational infrastructure such as facilities, equipment, physical space, and teaching aids are not of the required quality and it is expected that the relevant people will take the necessary measures to provide and equip educational centers.
In the present study the mean quality gap of all five dimensions of the quality of educational services were the same in terms of gender, age and year of residence and did not have a statistically significant difference which is consistent with other studies (24, 29).
In Arbouni et al.'s study, in contrast to the present study, the mean score of opinions of female interns was higher than males in all dimensions, and the observed difference was statistically significant (20). Perhaps the difference is due to personality differences between them and differences in their views on issues.
5.1. Limitations
Due to the multidimensionality of health care organizations, it is possible that not all aspects can be evaluated using the present research questionnaire. Also, there was low accessibility to the research samples due to clinical busy.
5.2. Suggestions
In order to achieve the desired quality of education, it is suggested that educational planning be done to reduce the gap between learners' perceptions and expectations. It is expected that by holding training workshops to empower teachers, improving quality will be taken. Developing educational standards will help to improve the existing situation. It is better to investigate how to compensate for these quality gaps in future studies.
5.3. Conclusions
In the present study, in all aspects of the quality of educational services, there was a negative gap between expectations and their perception, and this gap was greater in terms of confidence. The observed differences between the five dimensions of quality can be used as a guide for planning and resource allocation. In this regard, as the significance of the difference between the means showed, the five dimensions can be prioritized in the process of allocating resources to solve problems and improve quality. If prioritization is done, the dimensions that have the lowest quality are usually addressed first. Along with improving the quality in these dimensions, other dimensions will also improve from the students' viewpoint. Because the existence of defects in one dimension has an aggravating effect, which means that it causes a decline in quality in other dimensions, from the viewpoint of service recipients.
