


1. Background
Learning and education are essential in medical universities. Iranian universities of medical sciences have experienced rapid growth in electronic learning (e-learning) systems in recent years, in line with global changes in e-learning. Student assessment methods have changed from traditional methods to electronic assessments (e-assessments) along with the increasing growth of e-learning (1). Monitoring teaching and learning and student assessment methods are essential to improve education in medical universities. Evaluating the attitude and satisfaction of students with the training and exams is one of the methods of monitoring (2). As part of the e-learning system, e-exams need continuous evaluation to improve students' education and learning (3, 4). Investigating the quality of e-assessment plays a decisive role to determine the strengths and weaknesses of the e-learning system (students) (5).
According to most studies conducted before COVID-19, students were more satisfied with e-assessments than conventional assessments. There was a generally positive attitude towards this type of assessment. Teaching and learning was one of the essential advantages of e-assessments, although there were concerns about the fairness of e-exams (6-8). However, there was no significant difference between students' attitudes toward e-exams and traditional exams in a limited number of studies (9).
Limited studies have been conducted to assess students' attitudes and satisfaction with e-exams since COVID-19, necessitating the need for new studies in this field (3).
2. Objectives
Given the importance of this issue in improving education and assessment, this study aimed to evaluate the attitudes and satisfaction of medical sciences students with e-exams at Birjand University of Medical Sciences (BUMS) during COVID-19.
3. Methods
This descriptive-analytical cross-sectional study was conducted after the approval of the proposal in the research council of the University and obtaining the ethical code (IR.bums.REC.1399.076) from the ethical committee of BUMS (Direct link: ethics.research.ac.ir). All students participated in this project voluntarily, and the informed consent of all participants was obtained.
This study was held at BUMS, Birjand, Iran, from June to September 2020.
The inclusion criteria were informed consent to participate in the study, studying at one of the faculties of BUMS, and participation in at least one of the electronic exams (e-exams) held in the e-exam centers of BUMS (to answer the satisfaction questionnaire). The exclusion criteria included unwillingness to participate in the study and incomplete response to the questionnaire.
The sampling method was proportional to size (proportional to each faculty). The number of students in each faculty was obtained from the Department of Education, and the share of each faculty was determined based on the number of students in each faculty (gender proportion was also taken into account). Students' lists were used to select samples within each faculty.
The data collection tool was a questionnaire designed by the researcher to assess students' attitudes and satisfaction with e-assessment. Ganji's Arjenaki study (4) influenced the attitude questionnaire, and Dermo's study (6) influenced the satisfaction questionnaire. The content validity of the measurement tools was evaluated by consulting medical education experts regarding the degree of coordination between the tools and the purpose of the study. Therefore, qualitative and quantitative methods were considered for this purpose. Experts were asked to provide feedback after the qualitative review of the tool, based on which the cases were corrected. The relative content validity ratio (CVR) and the content validity index (CVI) were used to evaluate the content validity quantitatively, which was confirmed. The mean CVR of the entire questionnaire was 0.98, which was acceptable. The CVI calculation was based on the Walts and Basel validity index. The questions were retained when the CVI was more significant than 0.78. The questionnaire was given to 25 students, and Cronbach's alpha coefficient was equal to 0.9 to evaluate the reliability of the questionnaires. Therefore, the reliability of the questionnaire was confirmed. All participants in the study completed the Attitude Questionnaire, and students who had the experience of participating in the university e-exam completed the Satisfaction Questionnaire.
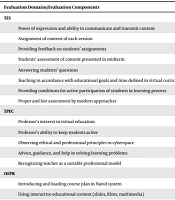
The questionnaire included three sections of demographic information (age, gender, semester, college, field of study, degree, and grade point average), attitude survey (six dimensions consisting of 19 questions), and satisfaction survey (nine dimensions consisting of 19 questions). The six dimensions of the Attitude Questionnaire included: (1) affective, (2) validity, (3) practical features, (4) reliability, (5) test security and counter-fraud, and (6) learning dimensions. The nine dimensions of the Satisfaction Questionnaire were based on: (1) test environment, (2) providing information about the test and knowledge of the test result, (3) exam stress, (4) quality of technical and software features of the system, (5) quality of hardware features of the system, (6) basic knowledge about e-exams, (7) test security and quality of counter fraud, (8) responsiveness, and (9) feeling satisfied with electronic tests.
The scoring of Attitude and Satisfaction Questionnaires was based on a 5-point Likert scale; strongly agree = 5, agree = 4, neither agree nor disagree = 3, disagree = 2, strongly disagree = 1. The scoring of the Satisfaction Questionnaire was very high = 5, high = 4, medium = 3, low = 2 and very low = 1. The minimum and maximum students‘ attitude score were 33 and 74, respectively (cut-off-point range score: 19 - 95). The mean score of students’ attitudes was 59.18 ± 7.99. The minimum and maximum students’ satisfaction score were 21 and 92, respectively (cut-off-point range score: 19 - 95). The mean score of students’ satisfaction was 65.73 ± 10.05.
The questionnaires were completed by the students after explaining the project objective by the same researcher, and the data were imported into the relevant statistical software.
The collected data was analyzed in SPSS Software Version 16. The mean, standard deviation, frequency, and frequency percentage were used to describe the data. The Kolmogorov–Smirnov test was used for normality. The data were analyzed using an independent t-test and analysis of variance (ANOVA) to compare the mean score of students’ attitudes and satisfaction by gender, faculty, and degree at the significant level of 0.05. The correlation between age, grade point average, students’ attitudes, and students’ satisfaction was assessed using the Pearson correlation coefficient.
4. Results
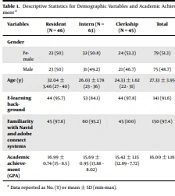
A total of 620 students completed the Attitude Questionnaire for e-assessment. In addition to completing the Attitude Questionnaire, 564 students completed the Satisfaction Questionnaire as part of their experience participating in e-exams. A total of 55.96% (347) of the participants were females, and a total of 44.04% (273) were males. The mean age of participants was 21.97 ± 2.35, and their grade point average was 16.6 ± 1.15.
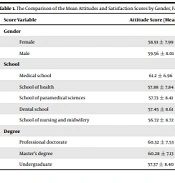
Based on the academic semester, the frequency distribution of students was as follows: first to fourth semesters (42.3%) (262), fifth to eighth semesters (32.7%) (203), ninth to fourteenth semesters (25%) (155). The frequency distribution in the faculties was: medical school (46.3%) (287), dental school (14%) (87), paramedical science school (18.7%) (116), nursing and midwifery school (12.3%) (76), health school (8.7%) (54). Among the degrees, professional doctorates accounted for 60.3% (374), undergraduate degrees accounted for 38.6% (239), and master's degrees accounted for 1.1% (7). The mean attitude and satisfaction scores by gender, faculty, and degree were calculated (Table 1).
Table 1.The Comparison of the Mean Attitudes and Satisfaction Scores by Gender, Faculty and Degree
| Score Variable | Attitude Score (Mean ± SD) | P-Value | Satisfaction Score (Mean ± SD) | P-Value |
|---|---|---|---|---|
| Gender | 0.307 | 0.975 | ||
| Female | 58.91 ± 7.99 | 65.75 ± 9.98 | ||
| Male | 59.56 ± 8.01 | 65.77 ± 10.14 | ||
| School | 0.001 | 0.002 | ||
| Medical school | 61.2 ± 6.96 | 67.17 ± 9.20 | ||
| School of health | 57.88 ± 7.84 | 59.6 ± 7.84 | ||
| School of paramedical sciences | 57.73 ± 8.41 | 65.03 ± 10.83 | ||
| Dental school | 57.45 ± 8.61 | 64.63 ± 11.06 | ||
| School of nursing and midwifery | 56.72 ± 8.72 | 63.98 ± 10.46 | ||
| Degree | < 0.001 | 0.006 | ||
| Professional doctorate | 60.32 ± 7.53 | 66.58 ± 9.71 | ||
| Master’s degree | 60.28 ± 7.13 | 55.00 ± 6.55 | ||
| Undergraduate | 57.37 ± 8.40 | 64.24 ± 10.50 |
According to the independent t-test analysis, the mean score of students’ attitudes and satisfaction by gender was not significantly different (P > 0.05).
The highest attitude score belonged to the first semester students, and the lowest attitude score was related to the second semester students. According to the result of the ANOVA analysis, the mean attitude score was significantly different regarding students’ academic semester (P = 0.001). The post-hoc Tukey test indicated that the difference in attitude score by semester was related to the difference in attitude score between the second and third semesters (P < 0.001). The highest level of satisfaction was related to the first semester students, and the lowest level belonged to the 13th semester students. According to the result of the ANOVA, the mean satisfaction score regarding students’ semesters was significantly different (P = 0.019). The post-hoc Tukey test revealed that the significance of the difference in satisfaction score by semester was related to the difference in satisfaction score between third and fourth semesters (P = 0.029).
There was a significant difference in the mean score of students’ attitudes according to the faculty (P < 0.05). The highest attitude score was related to medical school, and the lowest attitude score belonged to the school of nursing and midwifery. The post-hoc Tukey test demonstrated that the significance of the difference in attitude score by faculty was related to the difference in attitude score between medical school and school of health (P = 0.035), medical school and school of nursing and midwifery (P < 0.001), medical school and school of paramedical sciences (P = 0.001), and medical school and dental school (P = 0.001). There was a significant difference in the mean score of students’ satisfaction according to the faculty (P < 0.05). The highest level of satisfaction was related to medical school, and the lowest satisfaction level belonged to the school of health. The post-hoc Tukey test showed that the significance of the difference in satisfaction scores by faculty was related to the difference in satisfaction scores between medical school and school of health (P = 0.009).
The highest and lowest attitude score were related to the professional doctoral and undergraduate degree, respectively. The highest satisfaction score was related to the professional doctoral degree and the lowest score belonged to master’s degree. The post hoc Tukey test indicated that the difference in attitude score by degree was related to the difference in attitude score between professional doctoral and undergraduate degree (P-value < 0.001). The post-hoc Tukey test showed that the significance of the satisfaction score by degree was related to the difference in satisfaction score between professional doctoral and master’s degree (P = 0.02). The relationships between age, grade point average, students attitudes, and satisfaction were calculated (Table 2).
Table 2.Relationships Between Students’ Age, Grade Point Average, Attitudes, and Satisfaction Toward E-Assessment
| Age | Grade Point Average | Attitude | |
|---|---|---|---|
| Grade point average | |||
| P-value | < 0.001 | ||
| Correlation coefficient | -0.147 | ||
| Attitude | |||
| P-value | < 0.001 | 0.026 | |
| Correlation coefficient | 0.147 | -0.089 | |
| Satisfaction | |||
| P-value | 0.668 | 0.827 | < 0.001 |
| Correlation coefficient | -0.018 | 0.007 | 0.456 |
There was a positive and significant correlation between students’ attitudes and satisfaction. A positive and significant correlation was also observed between students’ age and attitudes (P < 0.05). The type of correlation coefficient was Pearson’s product-moment correlation coefficient due to the normal distribution of variables, and other correlations were not significant (P > 0.05).
5. Discussion
In this study, the mean scores of students’ attitude and satisfaction were acceptable and higher than the median score of the Attitude and Satisfaction Questionnaires (median scores = 57). Across academic semesters and degrees, attitudes and satisfaction scores were significantly different. There was a positive and significant correlation between students’ attitudes and satisfaction.
In most studies conducted before the COVID-19, students’ attitudes regarding e-assessment and e-exams were positive, and students provided useful feedback and were ready to adopt the e-exam system (6, 8, 10), which is consistent with the results of the present study. Technology supports learning and education, and e-exams represent an innovation for learning and teaching in higher education (8). The most positive aspect of e‐assessment based on the students’ opinion was beneficial for teaching and learning (6). Students also expressed concerns about e-assessment, and the fairness of e‐assessment was the most significant concern (6).
In most studies conducted before the COVID-19, the students’ satisfaction with e-assessment and e-exams was acceptable and more than the conventional assessment (7, 10), which is consistent with the results of the present study. Evaluation fairness, interest and motivation towards learning, getting quick feedback, paying attention to different aspects of evaluation, and finding defects and compensation were among the reasons for students’ satisfaction with e-exams (7). Generally, students’ satisfaction regarding test anxiety reduction, awareness of test results, and ease of use were significantly higher in electronic than traditional exams. In addition, students were satisfied with the quality of accountability of the system, technical properties, and basic knowledge about the electronic tests (11).
Studies have shown a significant positive association between student satisfaction and the quality of e-exam (4), which reminds the need for evaluating the satisfaction of e-exams.
Some studies have indicated that attitude means score with e-exams was not significantly different from that with traditional assessments (9). These results are not very consistent with the those of this study. This discrepancy may be related to the differences in students (including degree and faculty) between the two studies.
Some studies found that the attitudes of students regarding e-exams and their quality were not adequately considered by their universities (12), reminding the need for examining the attitude and satisfaction of students in all universities with electronic evaluation system.
In Dermo study (6), like our study, gender did not significantly affect students’ attitudes, but there was a positive and significant correlation between students’ age and attitudes in our study, contrary to the results of the Dermo study (6). The reason for this difference can be related to the lower sample size of their study and the different ages of the participants in the two studies. In Afacan Adanır et al. (13), students’ attitudes regarding online exams differed according to gender, major, and prior online course experience variables. In their study, the attitude was depended on the geographical location of the study so that Turkish students found online exams less stressful and more reliable and fairer than traditional paper-based exams compared with their Kyrgyz counterparts. Differences in students' attitudes in terms of major are consistent with our study's results, but differences in students' attitudes in terms of gender are not. The reason for this discrepancy can be related to the differences in the characteristics of the study population, including undergraduate students in their study with students of different levels in the current study (first-year students taking online courses compared to students from different semesters and courses).
In Daryazadeh et al. (14), the students’ attitude regarding e-learning was assessed. The students’ attitude score toward e-learning was not associated with academic achievement, reminding the need for more studies on the relationship between students’ attitudes and satisfaction towards e-exams with their academic achievement in future studies.
Therefore, a close relationship can be observed between e-assessment and e-learning. The study of attitudes and satisfaction with e-assessment is based on examining the quality of e-learning. Future studies should examine students' satisfaction with e-assessment and e-learning simultaneously. In the case of e-learning, in Mohtaram study (15), the satisfaction of medical students towards quality of e-learning during the COVID-19 was evaluated. The overall satisfaction of the medical students with e-learning was moderate.
According to our study, e-exams and e-assessment have the potential to improve medical education by using their capabilities and strengths. Furthermore, these capacities can be used to overcome the limitations of traditional assessment methods, especially before the COVID-19. In addition, this satisfaction suggested that University officials and policymakers should provide the required facilities to improve the quality of e-assessment and take appropriate actions to enable faculty members to hold e-exams properly.
This study had the advantage of simultaneously evaluating students' attitudes and satisfaction in a relatively acceptable sample size. One of the limitations of the present study was the confinement of the study to students of BUMS. Future studies should include students from other universities of medical sciences in cities across Iran. Another limitation could be the unwillingness of some students to participate in the study, which could have led to a larger sample size.
5.1. Conclusions
According to the results, the overall attitude and satisfaction were proper and above average. However, factors such as semester, college, and degree affect students’ attitudes and satisfaction influentially. The better attitude towards e-exams led to the higher level of satisfaction. Steps should be taken to strengthen the positive attitude towards e-exams, especially in lower attitude scores along with improving the variables affecting students’ satisfaction with e-exams to improve student satisfaction and consequently increase the quality of e-exams.