
1. Background
Nonalcoholic fatty liver disease (NAFLD) is a prevalent chronic liver disorder that imposes a substantial health burden, particularly in developed countries (1, 2). The disease spectrum ranges from simple hepatic steatosis to nonalcoholic steatohepatitis (NASH), which is characterized by inflammation, hepatocellular injury, and metabolic dysfunction (3). NAFLD affects approximately 20 - 30% of adults worldwide (4, 5). Its prevalence is closely associated with obesity, type 2 diabetes, and metabolic syndrome (6). Despite its growing burden, effective pharmacological therapies remain limited (7), increasing the risk of progression to NASH and hepatocellular carcinoma (8).
The development of NAFLD and its progression to NASH result from a complex interplay of genetic and environmental factors (9). At the molecular level, insulin resistance, hepatic lipid accumulation, impaired glucose metabolism, and oxidative stress play central roles in disease progression (10, 11). Excessive lipid deposition within hepatocytes induces lipotoxicity and mitochondrial dysfunction, resulting in increased reactive oxygen species (ROS) production and activation of inflammatory signaling pathways that contribute to the transition from simple steatosis to NASH (12). NASH is characterized by a pronounced hepatic inflammatory response accompanied by elevated levels of pro-inflammatory cytokines. IL-1β, IL-6 (13), and other inflammatory mediators contribute to hepatocellular injury, insulin resistance, and immune cell infiltration, thereby accelerating disease progression (14, 15).
Recently, mesenchymal stromal cells (MSCs) have gained attention as a potential treatment strategy for metabolic liver disorders because of their immunomodulatory and metabolic regulatory properties (16). However, growing evidence suggests that the regenerative effects of MSCs are primarily mediated by the bioactive factors they secrete, particularly extracellular vesicles such as exosomes (17). Exosomes derived from MSCs represent a cell-free therapeutic approach capable of modulating inflammation, oxidative stress, and metabolic signaling pathways while overcoming the limitations associated with cell-based therapies (18). Exosomes derived from adipose tissue–derived MSCs have demonstrated potential to enhance hepatic lipid metabolism and partially reduce inflammatory responses in experimental models of NAFLD (19, 20).
Lipopolysaccharide (LPS), a major component of the outer membrane of Gram-negative bacteria, functions as a potent immune activator by stimulating the TLR4 signaling pathway and inducing inflammatory responses (21). Preconditioning MSCs with LPS has been shown to modify their secretory profile, enhancing the release of bioactive mediators with cytoprotective and immunomodulatory properties (22, 23). Recent evidence suggests that exosomes derived from LPS-primed MSCs may exhibit superior therapeutic efficacy under inflammatory conditions by modulating immune responses and restoring metabolic homeostasis (24, 25).
Dysregulation of hepatic lipid metabolism is a defining feature of NASH and is tightly regulated by intracellular signaling pathways that govern fatty acid synthesis and oxidation (26). The AMPK pathway is a key metabolic regulator that maintains energy homeostasis. Activation of AMPK inhibits lipogenesis while promoting fatty acid oxidation (27), in part through the inactivation of ACC, a key regulatory enzyme in fatty acid biosynthesis (28). Impaired AMPK/ACC signaling has been associated with excessive hepatic lipid accumulation and cellular stress, making this pathway a promising therapeutic target for NASH (29).
Given the lack of effective therapies for NASH and the central role of metabolic and inflammatory disturbances in disease progression, this study investigated the therapeutic effects of MSC-derived exosomes in an HFD-induced NASH model, with particular emphasis on modulation of the AMPK/ACC signaling pathway.
2. Objectives
This study assessed the therapeutic potential of exosomes derived from LPS-MSCs to improve liver histology and metabolic disturbances in Wistar rats with HFD-induced fatty liver. It also investigated the underlying molecular mechanisms, particularly the modulation of genes involved in hepatic lipid metabolism through the AMPK/ACC signaling pathway.
3. Methods
3.1. High-Fat Diet Formulation
For NASH induction in Wistar rats, a high-fat emulsion was prepared; its macronutrient composition and caloric value are summarized accordingly. Following the method described by Zou et al. (30), the formulation consisted primarily of fat (75%), with carbohydrates (9%) and milk-derived protein (14%) to ensure adequate caloric intake. The mixture was stored at 4 °C and warmed to 42 °C with thorough agitation before daily administration.
3.2. ADSC Isolation and Culture
Inguinal adipose depots were harvested from seven-week-old rats, cleared of blood vessels and lymph nodes, and rinsed three times with PBS. The tissue was finely minced and enzymatically dissociated with 1% type I collagenase at 37 °C for 1 hour, after which the isolated cells were resuspended and cultured in 25 cm2 flasks in low-glucose DMEM containing 10% FBS.
3.3. ADSC Characterization and Differentiation
Adipose-derived mesenchymal stem cells (ADSCs) at passages 3 - 5 were evaluated for differentiation potential and surface marker expression. Osteogenic and adipogenic differentiation was induced using specific culture media for 21 days, and the resulting changes were visualized by confocal microscopy. For immunophenotyping, passage 3 cells were harvested, stained with fluorochrome-conjugated antibodies against CD44, CD105, and CD34, and analyzed by flow cytometry to confirm a mesenchymal stem cell phenotype.
3.4. LPS Priming of ADSCs
To evaluate the effect of LPS priming on ADSCs, lipopolysaccharide was dissolved in serum-free DMEM and prepared at different concentrations. ADSCs were then exposed to LPS at a final concentration of 1 µg/mL (23). After completion of the priming period, the LPS-containing medium was discarded, and the cells were thoroughly washed with PBS to minimize residual endotoxin contamination. The cells were subsequently maintained in serum-free medium for exosome collection and downstream analyses.
3.5. Exosome Isolation and Characterization
ADSCs were maintained in DMEM supplemented with 2% fetal bovine serum and then switched to serum-free medium before exosome collection. Exosomes were isolated using a commercial kit and stored at –75 °C. Exosome morphology was confirmed by TEM, and particle size distribution was assessed by dynamic light scattering.
3.6. Animal Model and Study Design
Forty adult Wistar rats (200 - 220 g) were acclimatized for one week under controlled conditions (25 °C, 55% humidity, 12-hour light/dark cycle). Animals were randomly allocated to a control group (CON, n = 8) and a high-fat diet group (HF, n = 32). To induce NASH, rats in the HF group received a daily lipid-rich emulsion (12 mL/kg) along with 18% sucrose in the drinking water. Histopathological assessment after seven weeks confirmed disease induction in a subset of animals.
Beginning at week 8, HFD-fed rats were randomly assigned to four experimental groups (n = 8 per group): HF (untreated), SARO (saroglitazar, 3 mg/kg/day by oral gavage) (31), EXO (MSC-derived exosomes), and LPS-EXO (exosomes derived from LPS-primed MSCs). The high-fat dietary regimen was continued throughout the treatment period until week 14 in all HFD-fed groups. Exosomes were quantified using the BCA assay and administered intravenously via the tail vein at a dose of 150 µg of exosomal protein diluted in 150 µL PBS (32). The control and non-exosome groups received an equivalent volume of PBS. All exosome preparations were generated using an identical isolation protocol, and dosing was standardized according to total exosomal protein concentration (32).
3.7. Biochemical and Histological Assessment
Serum levels of ALT, AST, and lipid parameters, including HDL-C, were determined using an automated analyzer. Liver tissues were fixed in formalin, processed through graded alcohols, embedded in paraffin, and sectioned at 7 - 8 µm. Sections were stained with hematoxylin and eosin (H&E) to evaluate steatosis and inflammation, and histopathological changes were scored by a blinded pathologist using the NASH activity score (NAS). In addition, Masson’s trichrome staining was performed to assess hepatic collagen deposition and fibrotic changes.
3.8. Gene Expression Analysis by qRT-PCR
Hepatic RNA was extracted using a commercial extraction kit, followed by complementary DNA synthesis by reverse transcription. Transcript levels were quantified using SYBR Green-based real-time PCR on a QuantStudio™ 3 platform. Specific primers were used, GAPDH served as the internal reference gene, and relative mRNA expression was calculated using the 2(-ΔΔCt) method.
3.9. Western Blotting
The phosphorylation levels of target proteins were assessed by western blotting. Hepatic tissues were homogenized in RIPA buffer containing protease and phosphatase inhibitors, and total protein concentration was determined using a BCA assay. Equal amounts of protein (35 µg) were separated by SDS-polyacrylamide gel electrophoresis and transferred to PVDF membranes. Membranes were incubated overnight with primary antibodies, followed by HRP-conjugated secondary antibodies. Protein bands were visualized using enhanced chemiluminescence and detected with a ChemiDoc imaging system. GAPDH was used as the loading control.
3.10. Data Analysis
All experiments were performed in triplicate, and data are presented as mean ± SEM. Differences among experimental groups were analyzed using one-way ANOVA followed by the LSD post hoc test in GraphPad Prism 9.1. Statistical significance was defined as P < 0.05.
4. Results
4.1. ADSC Phenotype Confirmation
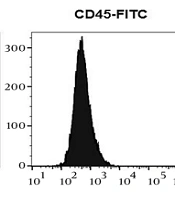
Passage 3 ADSCs exhibited typical fibroblast-like morphology and plastic-adherent properties. Flow cytometric analysis confirmed positive expression of MSC surface markers (CD44 and CD105) and the absence of hematopoietic markers (CD34 and CD45) (Figure 1A). Multipotent differentiation capacity was further verified using lineage-specific staining assays. Oil Red O staining demonstrated adipogenic differentiation, as evidenced by intracellular lipid droplets (Figure 1B), whereas Alizarin Red staining confirmed osteogenic differentiation through calcium deposition (Figure 1C).
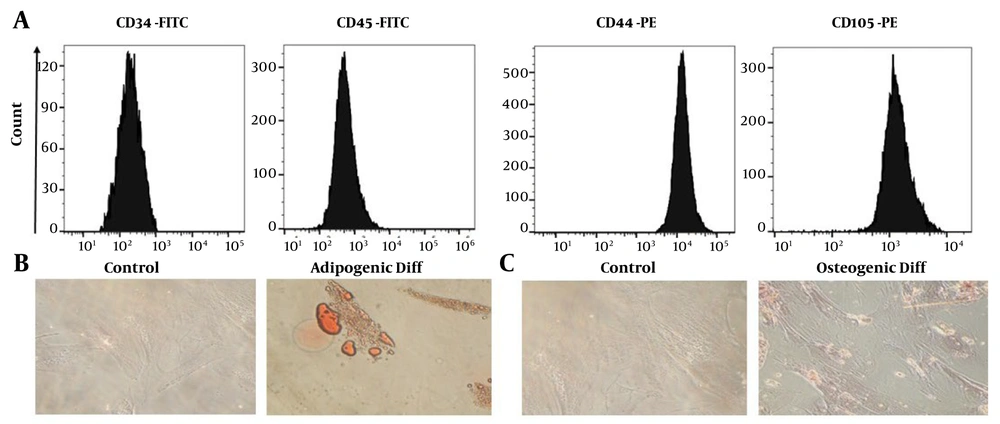
Figure 1.
Characterization of ADSCs. (A) Flow cytometric analysis demonstrated positive expression of CD44 and CD105, while CD34 and CD45 were not detected. (B) Successful adipogenic differentiation was evidenced by Oil Red O staining after 21 days of induction. (C) Osteogenic differentiation was confirmed through Alizarin Red staining, highlighting calcium mineral deposition.
4.2. Characterization of Isolated Exosomes
Exosome morphology was evaluated by TEM, which demonstrated predominantly spherical vesicles with diameters ranging from approximately 50 - 200 nm (Figure 2A). Western blot analysis further confirmed the exosomal identity of the isolated vesicles by demonstrating positive expression of the exosomal markers CD9 and CD81 (Figure 2B). In addition, particle size distribution analysis by dynamic light scattering revealed that most vesicles had a mean diameter of approximately 74 nm (Figure 2C).
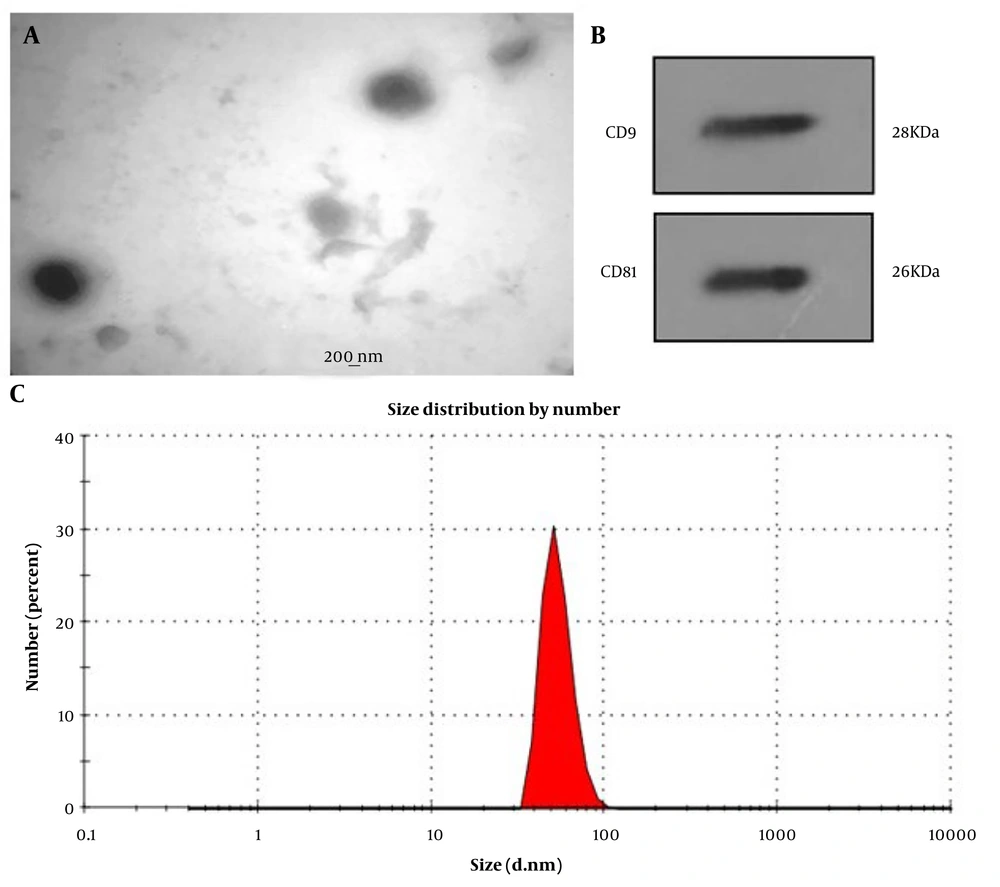
Figure 2.
Characterization of ADSC-derived exosomes. (A) Transmission electron microscopy (TEM) revealed the typical spherical morphology of isolated exosomes. (B) Western blot analysis confirmed the expression of the exosomal markers CD9 and CD81. (C) Dynamic light scattering (DLS) analysis demonstrated that the majority of isolated vesicles had a mean particle diameter of approximately 74 nm.
4.3. Effects of Treatments on Body and Liver Parameters
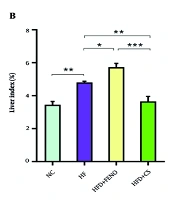
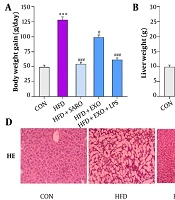
At baseline, body weight was comparable among all experimental groups. Following 8 weeks of HF emulsion feeding, HF rats exhibited significant increases in body weight (Figure 3A), liver weight (Figure 3B), and hepatic triglyceride content (Figure 3C) compared with the control group. During the subsequent six-week treatment period, administration of saroglitazar (Saro), MSC-derived exosomes, or LPS-primed MSC-derived exosomes attenuated body weight gain, reduced liver mass and hepatic triglyceride accumulation, and improved hepatic histopathological features, as demonstrated by H&E staining (Figure 3D).
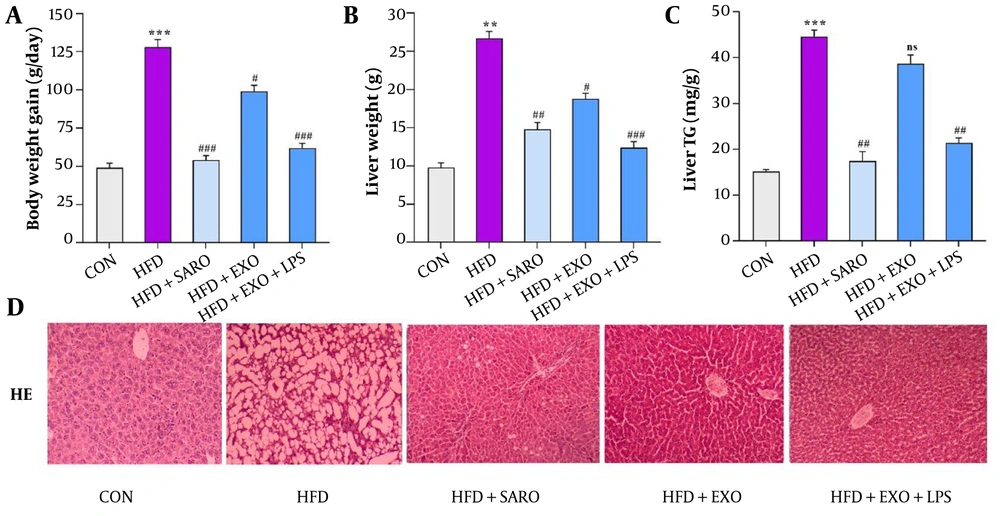
Figure 3.
Impact of treatments on body weight, liver function, and histology in HFD-induced NASH. (A–C) Body weight, liver weight, and hepatic triglyceride levels after HFD and treatments with SARO, EXO, or LPS-EXO. Data are mean ± SD (n = 8). Statistical significance: ** P < 0.001, *** P < 0.0001 vs. control; # P < 0.05, ## P < 0.01, ### P < 0.001 vs. HFD. (D) Representative H&E-stained liver sections (×100) showing histological changes in each group.
4.4. Impact of Treatments on Liver Function and Lipid Parameters
HF emulsion feeding significantly increased serum AST and ALT levels (P < 0.001), elevated LDL-C, and reduced HDL-C compared with the control group (P < 0.01) (Figure 4A-D). Treatment with saroglitazar significantly decreased ALT, AST, and LDL-C levels while increasing HDL-C concentrations (P < 0.01) relative to the HF group. Administration of MSC-derived exosomes also reduced ALT, AST, and LDL-C levels (P < 0.05); however, the increase in HDL-C did not reach statistical significance. In contrast, treatment with LPS-primed MSC-derived exosomes produced more pronounced effects, significantly lowering ALT, AST, and LDL-C levels (P < 0.001 and P < 0.01, respectively) and increasing HDL-C levels (P < 0.01) compared with the HF group.
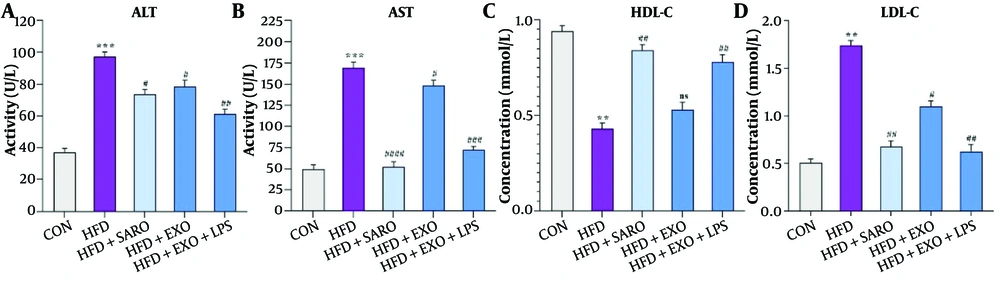
Figure 4.
Serum liver enzymes and lipid levels after treatments in HFD-induced NASH. Data are mean ± SD (n = 7). Statistical significance: * P < 0.01, ** P < 0.001, *** P < 0.0001 vs. control; # P < 0.05, ## P < 0.01, ### P < 0.001 vs. HFD. Abbreviations: CON, control; HFD, high-fat diet; SARO, saroglitazar; EXO, MSC-derived exosomes; LPS-EXO, LPS-primed MSC exosomes.
4.5. Hepatic Lipid Gene Modulation
High-fat feeding markedly increased hepatic transcript levels of SREBP-1c (Figure 5A), FAS (Figure 5B), ACC1 (Figure 5C), PPAR-γ (Figure 5D), PPAR-α (Figure 5E), and CPT-1α (Figure 5F) compared with controls (P < 0.01 - 0.0001). Administration of saroglitazar significantly downregulated SREBP-1c, FAS, ACC, and PPAR-γ (P < 0.01 - 0.001) while enhancing PPAR-α and CPT-1α expression (P < 0.001 - 0.01). MSC exosomes moderately reduced FAS (Figure 5B) and PPAR-γ (Figure 5D), with minimal effects on SREBP-1c (Figure 5A) and ACC (Figure 5C), whereas LPS-primed MSC exosomes strongly suppressed SREBP-1c, FAS, ACC, and PPAR-γ and enhanced PPAR-α (Figure 5E) and CPT-1α (Figure 5F) (P < 0.05 - 0.001).
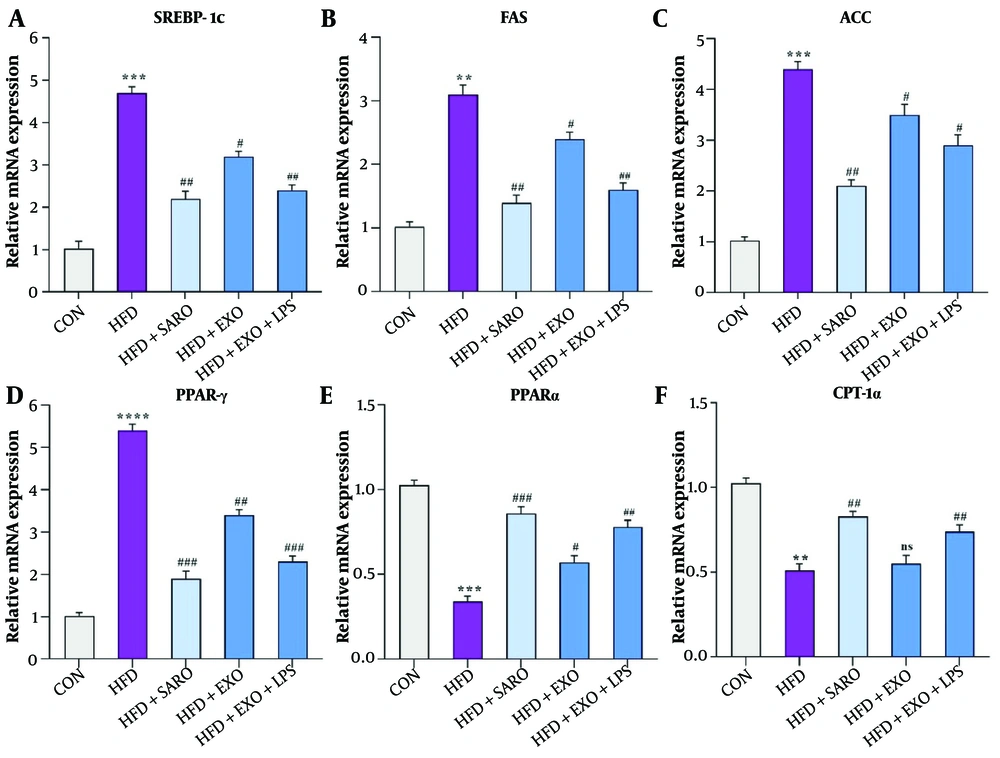
Figure 5.
Hepatic mRNA levels of genes involved in lipid metabolism. Fold changes relative to control are shown as mean ± SD. Panels: (A) SREBP-1c, (B) FAS, (C) ACC, (D) PPAR-γ, (E) PPAR-α, (F) CPT-1α. Statistical significance: * P < 0.01, ** P < 0.001, *** P < 0.0001 vs. control; # P < 0.05, ## P < 0.01, ### P < 0.001 vs. HFD.
4.6. Modulation of Hepatic Inflammatory Genes
A high-fat diet significantly elevated hepatic mRNA levels of IL-1β and IL-6 (Figure 6A-B), as well as TNF-α and TGF-β (Figure 6C-D), relative to the control group (P = 0.01 - 0.001). Treatment with saroglitazar significantly suppressed TNF-α, IL-1β, and IL-6 (P < 0.01), as well as TGF-β (P < 0.001). Administration of MSC-EXO selectively reduced IL-1β, IL-6, and TNF-α (P < 0.01), whereas TGF-β was minimally affected. Notably, LPS-primed MSC exosomes produced the most pronounced anti-inflammatory response, significantly lowering IL-1β, IL-6, TGF-β, and TNF-α (P < 0.01) relative to the HF group, highlighting their superior efficacy in attenuating hepatic inflammation.
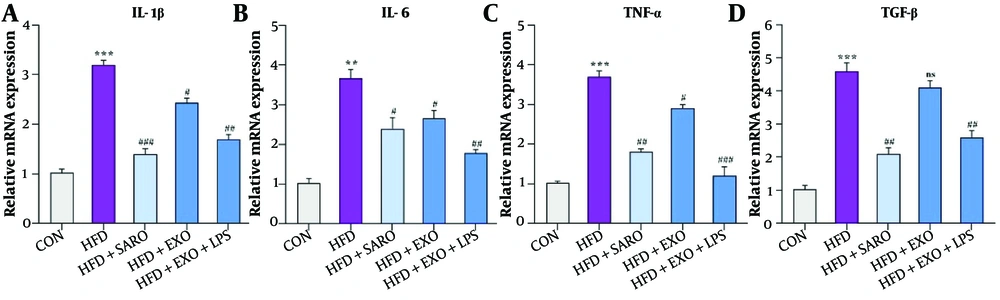
Figure 6.
Effects of treatments on hepatic inflammatory gene expression. mRNA levels in liver samples were quantified by qPCR, normalized to GAPDH, and expressed as fold change relative to control (mean ± SD). Panels show: (A) IL-1β, (B) IL-6, (C) TNF-α, (D) TGF-β. Statistical analysis: * P < 0.01, ** P < 0.001, *** P < 0.0001 vs. control; # P < 0.05, ## P < 0.01, ### P < 0.001 vs. HFD.
4.7. Effects of Treatments on Hepatic Fibrosis Markers
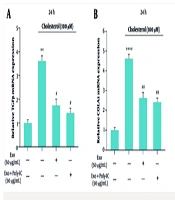
High-fat diet feeding markedly upregulated hepatic expression of fibrosis-associated genes, including COL1A1, COL3A1, and α-SMA, compared with the control group (Figure 7A-C), indicating activation of fibrogenic pathways during NASH progression. Treatment with saroglitazar significantly reduced the expression of these profibrotic markers. Administration of MSC-derived exosomes also attenuated COL1A1, COL3A1, and α-SMA expression, although the suppressive effects were more pronounced in rats treated with exosomes derived from LPS-primed MSCs. Histopathological examination using Masson’s trichrome staining further demonstrated increased collagen accumulation in the livers of HFD-fed rats, whereas treatment with SARO, EXO, and particularly LPS-EXO markedly alleviated hepatic collagen deposition and fibrotic alterations (Figure 7D).
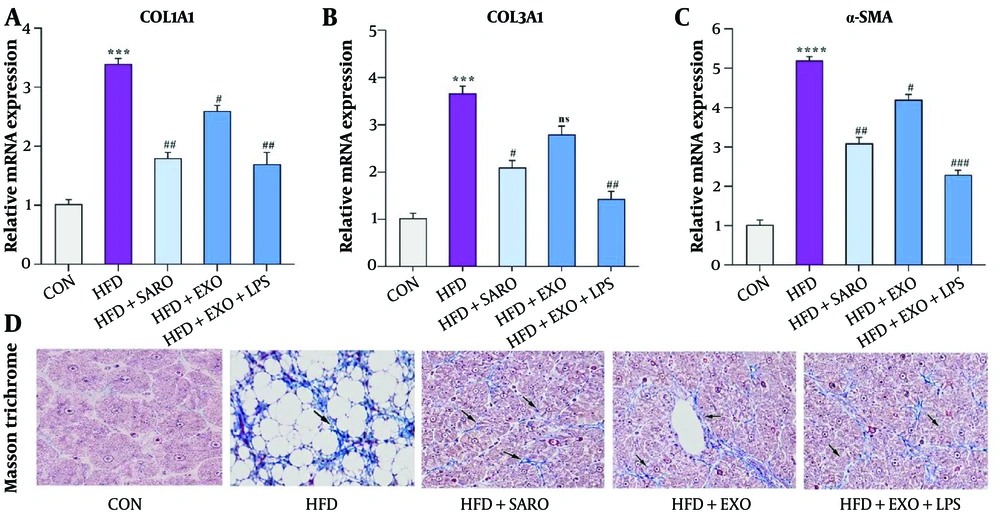
Figure 7.
Effects of different treatments on hepatic fibrosis-related markers in HFD-induced NASH. Relative mRNA expression levels of COL1A1 (A), COL3A1 (B), and α-SMA (C) were quantified by qRT-PCR. HFD markedly increased the expression of fibrogenic genes, whereas treatment with saroglitazar (SARO), MSC-derived exosomes (EXO), and LPS-primed MSC-derived exosomes (LPS-EXO) significantly attenuated their expression. Gene expression levels were calculated using the 2−ΔΔCt method. Data are presented as mean ± SEM, *** P < 0.001, and **** P < 0.0001 versus the control group; # P < 0.05, ## P < 0.01, and ### P < 0.001 versus the HF group. (D) Representative Masson’s trichrome–stained liver sections (100× magnification) showing collagen deposition and fibrotic changes in different experimental groups.
4.8. Western Blot Assessment of p-AMPK and p-ACC
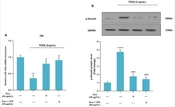
Western blot analysis was performed to evaluate hepatic p-AMPK and p-ACC expression. Compared with the control group, rats fed a high-fat diet exhibited markedly reduced phosphorylation levels of AMPK and ACC, indicating disruption of the AMPK/ACC signaling pathway in NASH (Figure 8A–C). Treatment with saroglitazar and MSC-derived exosomes partially restored p-AMPK (Figure 8A, B) and p-ACC expression (Figure 8A, C). Notably, exosomes derived from LPS-primed MSCs produced a more pronounced increase in phosphorylated AMPK and ACC levels than in both untreated HF rats and the MSC-EXO-treated group.
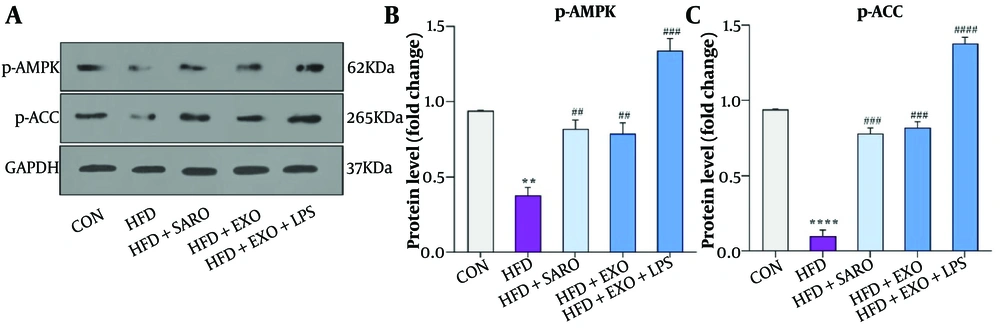
Figure 8.
Liver AMPK and ACC phosphorylation after treatments. Phosphorylation levels were assessed by Western blot and normalized to GAPDH. Panels: (A) representative blots, (B) p-AMPK quantification, (C) p-ACC quantification. Data are mean ± SD. Significance: * P < 0.01, **** P < 0.0001 vs. control; ## P < 0.01, ### P < 0.001, #### P < 0.0001 vs. HFD.
5. Discussion
Nonalcoholic fatty liver disease (NAFLD) is a chronic metabolic liver disorder driven by multiple interacting factors and characterized by complex pathogenic mechanisms (33). The disease is strongly associated with lipid accumulation in hepatocytes, which sensitizes the liver to metabolic and inflammatory stress (34). Despite extensive research, there is still no approved pharmacological treatment that can reliably halt disease progression, and current management is mainly based on lifestyle modification (35). Oxidative stress and persistent inflammation contribute to progression from steatosis to nonalcoholic steatohepatitis (NASH), and eventually to fibrosis (36), in close association with dysregulated lipid metabolism (37).
MSCs have attracted considerable attention as a viable therapeutic option for metabolic liver diseases because of their immunomodulatory and tissue-repair properties (38). However, MSC-mediated restorative effects are increasingly attributed to paracrine activity rather than direct cell replacement (39). In this context, MSC-derived exosomes offer a cell-free alternative that may overcome the safety and logistical challenges associated with cell therapy. Priming MSCs with lipopolysaccharide (LPS) has been reported to alter their secretome, enhancing the release of anti-inflammatory and cytoprotective factors (23). Based on this premise, we investigated the therapeutic potential of LPS-primed MSC-derived exosomes in a HFD-induced NASH model and compared their effects with those of saroglitazar, a clinically used PPAR-α agonist.
In our study, HFD-fed rats developed characteristic features of NASH, including significant body weight gain, hepatic steatosis, elevated liver triglyceride accumulation, increased serum ALT and AST levels, and early fibrotic alterations. These findings confirm the successful establishment of metabolic liver injury consistent with experimental NASH models (40). Treatment with saroglitazar significantly attenuated hepatic lipid accumulation and improved metabolic abnormalities, reflecting its established role in enhancing fatty acid oxidation and improving dyslipidemia. Notably, exosomes derived from LPS-primed MSCs produced effects comparable to, and for some parameters greater than, those observed with naïve MSC-derived exosomes in reducing liver weight, hepatic triglyceride content, and body weight gain, supporting the therapeutic potential of this cell-free strategy. In addition, Masson’s trichrome staining and fibrosis-related gene expression analyses demonstrated that LPS-primed MSC exosomes effectively reduced collagen deposition and suppressed the expression of profibrotic markers, including COL1A1, COL3A1, and α-SMA, suggesting attenuation of hepatic stellate cell activation and early fibrogenesis. These observations are consistent with previous reports indicating that MSC-derived exosomes can improve hepatic lipid metabolism and alleviate steatosis (41), and further support the concept that inflammatory priming enhances exosomal therapeutic efficacy under metabolic stress conditions.
The molecular data from this study provide insight into the underlying mechanisms. The AMPK/ACC pathway is a key regulator of hepatic lipid metabolism, controlling the balance between lipogenesis and fatty acid oxidation (42). Activation of AMPK inhibits ACC via phosphorylation, thereby reducing malonyl-CoA synthesis and favoring mitochondrial fatty acid uptake and oxidation. In parallel, inhibition of lipogenesis-related transcription factors, including SREBP-1c, and downstream enzymes, including FAS and ACC, limits de novo lipogenesis. Our results show that HFD significantly suppressed p-AMPK and p-ACC expression, consistent with impaired metabolic signaling in NASH. Treatment with saroglitazar partially restored AMPK/ACC phosphorylation and normalized the expression of key lipid-related genes, including downregulation of SREBP-1c, ACC, and PPAR-γ, alongside upregulation of CPT-1α. Importantly, LPS-primed MSC exosomes were associated with greater activation of AMPK/ACC signaling and more pronounced modulation of lipogenic and β-oxidation genes than naïve MSC-EXO treatment. These findings suggest that LPS priming may enhance the ability of MSC-derived exosomes to restore metabolic balance by targeting upstream energy-sensing pathways, in addition to their anti-inflammatory effects.
Inflammatory processes are pivotal in the advancement of NASH, with the surrounding cytokine milieu critically influencing the extent of liver damage (34). In HFD-fed rats, liver mRNA levels of IL-1β and TGF-β were markedly elevated, reflecting the inflammatory shift associated with lipotoxicity and oxidative stress. Saroglitazar effectively reduced these inflammatory mediators, consistent with its known anti-inflammatory effects in metabolic disease models. MSC-EXO treatment also suppressed pro-inflammatory cytokines, but to a lesser extent than LPS-primed MSC exosomes. Notably, LPS-primed MSC exosomes were associated with the greatest reduction in inflammatory gene expression among the treatment groups, with significant downregulation of TNF-α and TGF-β, key mediators of inflammation and fibrogenesis. This enhanced anti-inflammatory effect may be attributed to altered exosomal cargo induced by LPS priming, which likely contains immunoregulatory miRNAs and proteins capable of more effectively suppressing pro-inflammatory signaling cascades, including NF-κB (43).
Our findings align with earlier research demonstrating that MSC-based therapies can modulate immune and metabolic regulatory pathways in NAFLD models. For example, MSC treatment has been reported to reduce IL-6 and TGF-β levels and improve liver histology in HFD-fed animals (44). Similarly, combined therapy approaches, such as liraglutide with MSCs, have demonstrated synergistic effects on inflammation and oxidative stress (45). However, our findings suggest that LPS priming of MSCs may further enhance exosomal therapeutic efficacy, supporting its potential as a strategy to improve MSC-derived exosome-based interventions. While other studies have emphasized the Nrf2/HO-1 antioxidant axis as a key mechanism of MSC action (46), our data indicate that modulation of the AMPK/ACC pathway and suppression of NF-κB–driven inflammation may play a more dominant role in the context of NASH. This distinction is important because targeting energy-sensing pathways could simultaneously address lipid accumulation and inflammation, providing a more comprehensive therapeutic approach.
Although the present findings are promising, several limitations should be acknowledged. The molecular composition of the exosomal cargo, including miRNAs and protein constituents, was not analyzed, which limits deeper mechanistic interpretation. In addition, exosome dosing was based on total protein content rather than particle number, and potential variations among preparations cannot be excluded. Although fibrosis-related markers and collagen deposition were assessed, the experimental model mainly reflects early-stage NASH. Furthermore, endotoxin levels in the final exosome preparations were not quantified, and the possible contribution of residual LPS cannot be fully ruled out. Importantly, the relatively small sample size and the absence of dose–response experiments warrant cautious interpretation of the comparative efficacy between naïve and LPS-primed MSC-derived exosomes. Future studies should include comprehensive exosomal cargo profiling, particle-based dose standardization, endotoxin assessment, and evaluation in advanced fibrotic NASH models.
5.1. Conclusions
In summary, our findings suggest that exosomes derived from LPS-primed MSCs may attenuate high-fat diet–induced NASH through modulation of the AMPK/ACC signaling pathway, accompanied by reductions in hepatic lipid accumulation, inflammatory responses, and early fibrotic changes. These results indicate the therapeutic and anti-fibrotic potential of this cell-free strategy for NASH management. Moreover, LPS priming may represent a practical approach to enhance the therapeutic efficacy of MSC-derived exosomes in metabolic liver diseases. However, these findings should be interpreted with caution given the limited sample size and the absence of dose–response and exosomal cargo analyses.