


1. Background
2. Objectives
3. Methods
3.1. Chemicals and Cell Culture
3.2. Water-Soluble Tetrazolium Salt-1 Assay
3.3. Lactate Dehydrogenase Leakage Assay
3.4. Western Blot Analysis
| Antigen | Host | Dilution | Manufacturer (Cat. Number) |
|---|---|---|---|
| β-Actin | Mouse | 1:1000 | Santa Cruz (#sc-47778) |
| Cleaved Caspase-3 | Rabbit | 1:1000 | CST (#9664) |
| Cleaved PARP | Rabbit | 1:1000 | CST (#5625) |
| BCL-2 | Rabbit | 1:1000 | Abcam (#59348) |
| BAX | Rabbit | 1:1000 | CST (#5023) |
| p65 | Rabbit | 1:1000 | CST (#8242) |
| p-p65 (Ser468) | Rabbit | 1:1000 | CST (#3039) |
| p-ATR (Ser428) | Rabbit | 1:1000 | CST (#2853) |
| ATR | Rabbit | 1:1000 | CST (#13934) |
| p-p53 (Ser9) | Rabbit | 1:1000 | CST (#9288) |
| p-p53 (Ser15) | Rabbit | 1:1000 | CST (#9284) |
| p-p53 (Ser46) | Rabbit | 1:1000 | CST (#2521) |
| p-p53 (Ser392) | Rabbit | 1:1000 | CST (#9281) |
| p53 | Mouse | 1:200 | Santa Cruz (#sc-126) |
| p-p38 (Thr180/Tyr182) | Rabbit | 1:1000 | CST (#9211) |
| p38 | Rabbit | 1:1000 | CST (#54470) |
| p-JNK (Thr183/Tyr185) | Rabbit | 1:1000 | CST (#9251) |
| JNK | Rabbit | 1:1000 | CST (#9252) |
| p-ERK (Thr202/Tyr204) | Rabbit | 1:1000 | CST (#9101) |
| ERK | Rabbit | 1:1000 | CST (#9102) |
| PUMA | Rabbit | 1:1000 | Abcam (#9643) |
| Cytochrome c | Mouse | 1:1000 | BD Biosciences (#556432) |
| p-STAT3 (Ser727) | Rabbit | 1:1000 | CST (#94994) |
| STAT3 | Rabbit | 1:1000 | CST (#4904) |
| IκB-α | Rabbit | 1:1000 | CST (#9242) |
| p-IκB-α (Ser32) | Rabbit | 1:1000 | CST (#2859) |
Abbreviations: PARP, poly (ADP-ribose) polymerase; BCL-2, B-cell lymphoma 2; BAX, B-cell lymphoma 2-associated X protein; ATR, ataxia telangiectasia and Rad3 related protein; JNK, c-Jun N-terminal kinases; ERK, extracellular signal-regulated kinases; PUMA, p53 upregulated modulator of apoptosis; STAT3, signal transducer and activator of transcription 3; IκB-α, NF-kappa-B inhibitor alpha.
3.5. Reverse Transcriptase-Polymerase Chain Reaction
| Target mRNA | Primer Sequences | Product Size (bp) |
|---|---|---|
| β-Actin | F: 5′-CATCGTCCACCGCAAATGCTTC-3′ | 240 |
| R: 5′-TCCTCGGCCACATTGTGAACTT-3′ | ||
| IL-1α | F: 5′-GAGGCCATCGCCAATGACTCAG-3′ | 183 |
| R: 5′-ATGTAATGCAGCAGCCGTGAGG-3′ | ||
| IL-1β | F: 5′-TTCCCTGCCCACAGACCTTCC-3′ | 116 |
| R: 5′-TGCATCGTGCACATAAGCCTCG-3′ | ||
| IL-6 | F: 5′-GTAGCCGCCCCACACAGA-3′ | 101 |
| R: 5′-CATGTCTCCTTTCTCAGGGCTG-3′ | ||
| TNF-α | F: 5′-CTCTTCTGCCTGCTGCACTTTG-3′ | 135 |
| R: 5′-ATGGGCTACAGGCTTGTCACTC-3′ | ||
| IL-24 | F: 5’-GGACGTAGAAGCAGCTCTGACCA-3’ | 184 |
| R: 5’-AAGGGCGTGAAGTGTCCAGTGA-3’ | ||
| CCL5/RANTES | F: 5’-CCTGCTGCTTTGCCTACATTGC-3’ | 125, 207 |
| R: 5’-ACACACTTGGCGGTTCTTTCGG-3’ | ||
| CCL20/MIP-3 | F: 5’-CCAAGAGTTTGCTCCTGGCT-3’ | 75 |
| R: 5’-TGCTTGCTGCTTCTGATTCG-3’ | ||
| CCL26/eotaxin-3 | F: 5’-CCAATACAGCCACAAGCCCCTT-3’ | 263 |
| R: 5’-CAGAAAAGATTCCGCAGGCTCCC-3’ | ||
| CXCL1/GRO-α | F: 5’-AGGCCACCTGGATTGTGCCTAA-3’ | 281 |
| R: 5’-GCATGTTGCAGGCTCCTCAGAA-3’ | ||
| CXCL8/IL-8 | F: 5’-TCTCTTGGCAGCCTTCCTGA-3’ | 172 |
| R: 5’-TTCTGTGTTGGCGCAGTGTG-3’ |
Abbreviations: IL, interleukin; TNF, tumor necrosis factor; CCL, C-C motif chemokine ligand; CXCL, C-X-C motif chemokine ligand.
3.6. Statistical Analysis
4. Results
4.1. Establishment of a Para-phenylenediamine-induced Toxicity Model in HaCaT Cells
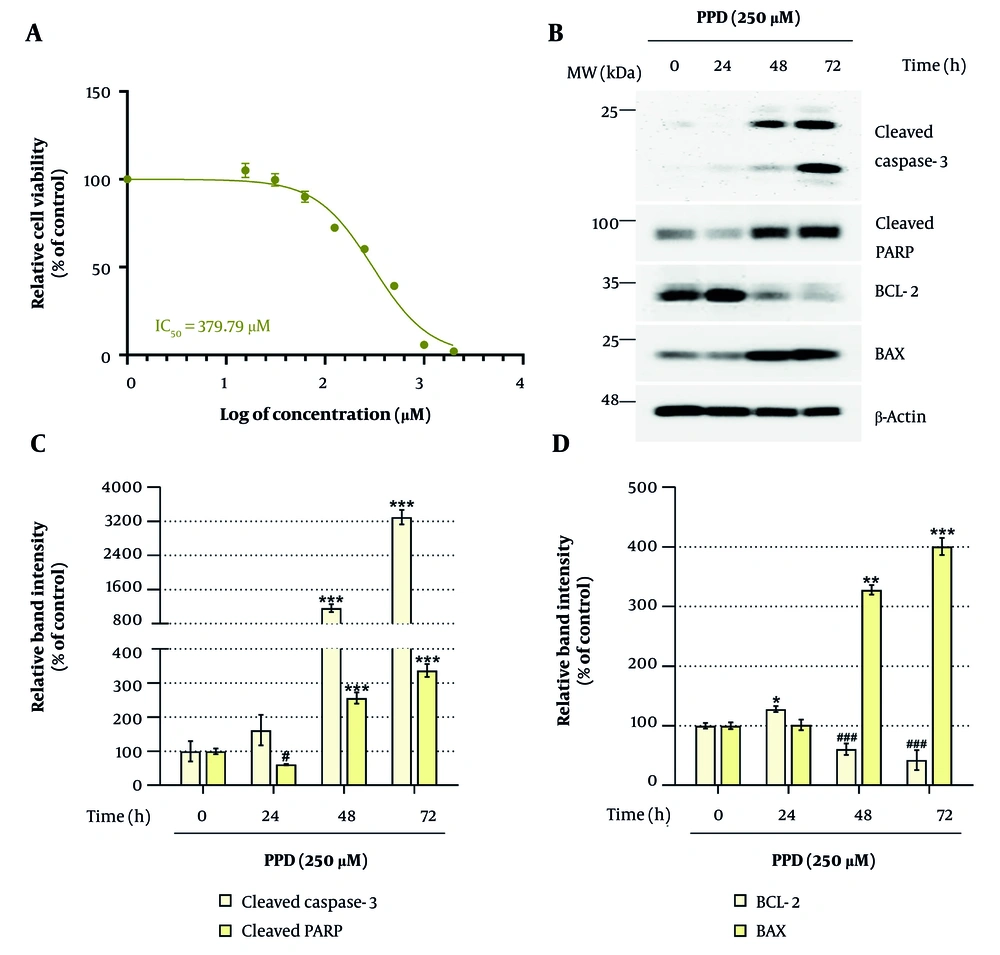
Determination of para-phenylenediamine (PPD)-induced cytotoxicity and apoptosis in HaCaT cells: A, HaCaT cells were seeded in 96-well plates (3 × 10³ cells/well) and incubated for 24 hours. The cells were treated with various concentrations of PPD (0 - 1,000 μM) for 48 hours. Cell viability was assessed using the water-soluble tetrazolium salt-1 (WST-1) assay. B – D, Cells were seeded in 100 mm dishes (2 × 10⁵ cells/dish) and incubated for 24 hours. The cells were treated with 250 μM PPD for up to 72 hours. Expression levels of apoptosis-related proteins, including cleaved Caspase-3, cleaved poly (ADP-ribose) polymerase (PARP), B-cell lymphoma 2 (BCL-2), and B-cell lymphoma 2-associated X protein (BAX), were analyzed by Western blotting. The β-Actin was used as a loading control, and protein band intensities were quantified using ImageJ software (version 1.53t). Data are presented as mean ± standard deviation (SD, n = 3). Statistical significance was determined by one-way analysis of variance (ANOVA) followed by Tukey’s post-hoc test (abbreviation: LDH, lactate dehydrogenase. #,* P < 0.05, ** P < 0.01, and ###,*** P < 0.001 compared with the solvent-treated vehicle control group).
4.2. Geranyl Acetate Confers Cytoprotective Effects Against Para-phenylenediamine-induced Toxicity in HaCaT Cells
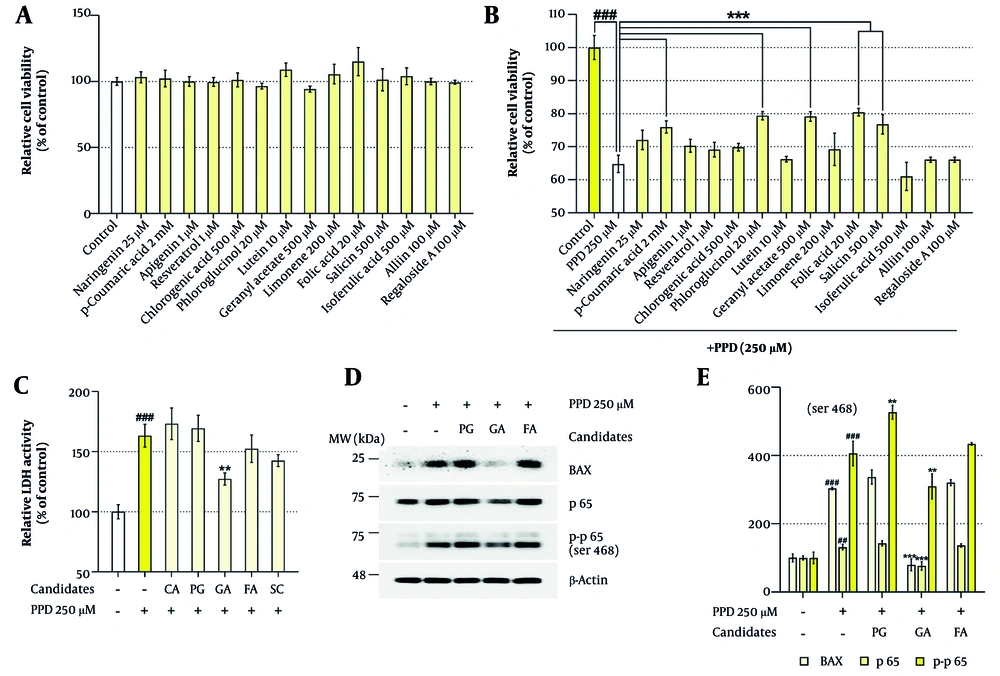
Screening of 14 plant metabolites for mitigating para-phenylenediamine (PPD)-induced cytotoxicity in HaCaT cells: A, HaCaT cells were seeded in 96-well plates (3 × 10³ cells/well) and incubated for 24 hours. The cells were treated with indicated concentrations of phytochemical candidates for 48 hours. Cell viability was assessed using the water-soluble tetrazolium salt-1 (WST-1) assay. B and C, To evaluate the protective effects of the plant metabolites against PPD-induced cytotoxicity, HaCaT cells were treated with various concentrations of candidate compounds, in the presence or absence of PPD (250 μM) for 48 hours. Cytotoxicity was assessed by (B) the WST-1 assay and (C) the lactate dehydrogenase (LDH) release assay. D and E, Cells were seeded in 100 mm dishes (2 × 10⁵ cells/dish) and incubated for 24 hours, followed by treatment with phloroglucinol (PG, 20 μM), geranyl acetate (GA, 500 μM), or folic acid (FA, 20 μM), in the presence or absence of PPD (250 μM) for 48 hours. Protein expression levels of the pro-apoptotic marker B-cell lymphoma 2-associated X protein (BAX) and inflammation-associated proteins p65 and p-p65 were analyzed by Western blotting. The β-Actin was used as a loading control. Protein band intensities were quantified using ImageJ software (version 1.53t). Data are presented as mean ± standard deviation (SD, n = 3). Statistical significance was determined by one-way analysis of variance (ANOVA) followed by Tukey’s post-hoc test (## P < 0.01 and ### P < 0.001 compared with the solvent-treated vehicle control group. ** P < 0.01 and *** P < 0.001 compared with the PPD-treated negative control group).
4.3. Geranyl Acetate Attenuates DNA Damage Response in Para-phenylenediamine-treated HaCaT Cells
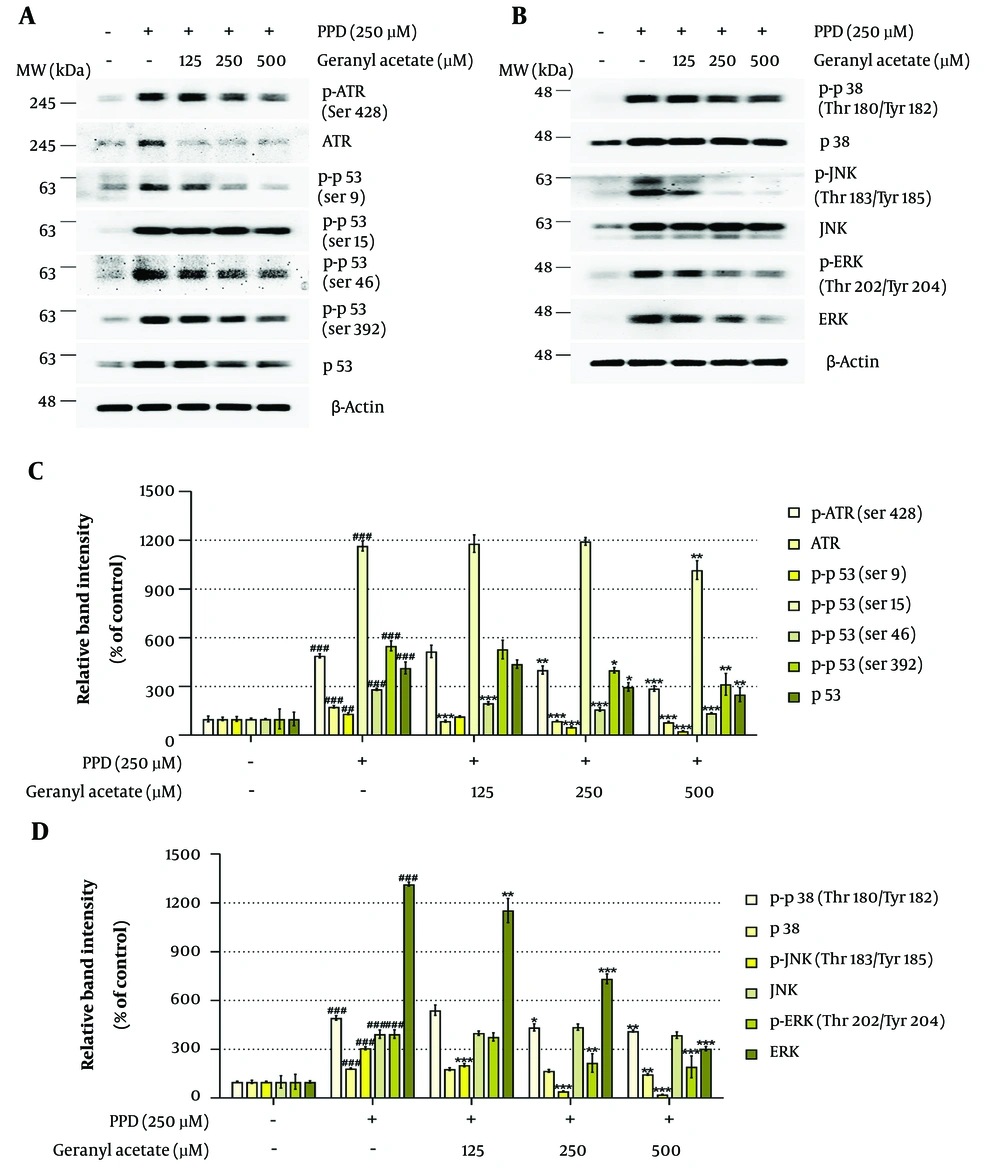
Geranyl acetate (GA) mitigates para-phenylenediamine (PPD)-induced DNA damage response (DDR) signaling in HaCaT cells: A – D, HaCaT cells were seeded in 100 mm dishes (2 × 10⁵ cells/dish) and incubated for 24 hours, followed by treatment with GA (0 - 500 μM), in the presence or absence of PPD (250 μM) for 48 hours. Protein expression levels of the DDR-related proteins, including ataxia telangiectasia and Rad3 related protein (ATR), p-ATR, p53, p-p53, p38, p-p38, c-Jun N-terminal kinases (JNK), p-JNK, extracellular signal-regulated kinases (ERK), and p-ERK, were analyzed by Western blotting. The β-Actin was used as a loading control. Protein band intensities were quantified using ImageJ software (version 1.53t). Data are presented as mean ± standard deviation (SD, n = 3). Statistical significance was determined by one-way analysis of variance (ANOVA) followed by Tukey’s post-hoc test (## P < 0.01 and ### P < 0.001 compared with the solvent-treated vehicle control group. * P < 0.05, ** P < 0.01, and *** P < 0.001 compared with the PPD-treated negative control group).
4.4. Geranyl Acetate Exerts Anti-apoptotic Effects in Para-phenylenediamine-treated HaCaT Cells
![Geranyl acetate (GA) improves para-phenylenediamine (PPD)-induced apoptosis and inflammation signaling in HaCaT cells: A and B, HaCaT cells were seeded in 100 mm dishes (2 × 10<sup>5</sup> cells/dish) and incubated for 24 hours, followed by treatment with GA (0 - 500 μM), in the presence or absence of PPD (250 μM) for 48 hours. Protein expression levels of the (A) apoptosis-related proteins [BAX, p53 upregulated modulator of apoptosis (PUMA), cytochrome c, and cleaved PARP] and (B) inflammation-related proteins [signal transducer and activator of transcription 3 (STAT3), p-STAT3, p65, p-p65, NF-kappa-B inhibitor alpha (IκB-α), and p-IκB-α] were analyzed by Western blotting. The β-Actin was used as a loading control. Protein band intensities were quantified using ImageJ software (version 1.53t). Data are presented as mean ± standard deviation (SD, n = 3). Statistical significance was determined by one-way analysis of variance (ANOVA) followed by Tukey’s post-hoc test (### P < 0.001 compared with the solvent-treated vehicle control group. * P < 0.05, ** P < 0.01, and *** P < 0.001 compared with the PPD-treated negative control group).](https://brieflands.com/journals/ijpr/articles/164379/figures/ijpr-24-1-164379-i004-preview.webp "Geranyl acetate (GA) improves para-phenylenediamine (PPD)-induced apoptosis and inflammation signaling in HaCaT cells: A and B, HaCaT cells were seeded in 100 mm dishes (2 × 10<sup>5</sup> cells/dish) and incubated for 24 hours, followed by treatment with GA (0 - 500 μM), in the presence or absence of PPD (250 μM) for 48 hours. Protein expression levels of the (A) apoptosis-related proteins [BAX, p53 upregulated modulator of apoptosis (PUMA), cytochrome c, and cleaved PARP] and (B) inflammation-related proteins [signal transducer and activator of transcription 3 (STAT3), p-STAT3, p65, p-p65, NF-kappa-B inhibitor alpha (IκB-α), and p-IκB-α] were analyzed by Western blotting. The β-Actin was used as a loading control. Protein band intensities were quantified using ImageJ software (version 1.53t). Data are presented as mean ± standard deviation (SD, n = 3). Statistical significance was determined by one-way analysis of variance (ANOVA) followed by Tukey’s post-hoc test (### P < 0.001 compared with the solvent-treated vehicle control group. * P < 0.05, ** P < 0.01, and *** P < 0.001 compared with the PPD-treated negative control group).")
Geranyl acetate (GA) improves para-phenylenediamine (PPD)-induced apoptosis and inflammation signaling in HaCaT cells: A and B, HaCaT cells were seeded in 100 mm dishes (2 × 10⁵ cells/dish) and incubated for 24 hours, followed by treatment with GA (0 - 500 μM), in the presence or absence of PPD (250 μM) for 48 hours. Protein expression levels of the (A) apoptosis-related proteins [BAX, p53 upregulated modulator of apoptosis (PUMA), cytochrome c, and cleaved PARP] and (B) inflammation-related proteins [signal transducer and activator of transcription 3 (STAT3), p-STAT3, p65, p-p65, NF-kappa-B inhibitor alpha (IκB-α), and p-IκB-α] were analyzed by Western blotting. The β-Actin was used as a loading control. Protein band intensities were quantified using ImageJ software (version 1.53t). Data are presented as mean ± standard deviation (SD, n = 3). Statistical significance was determined by one-way analysis of variance (ANOVA) followed by Tukey’s post-hoc test (### P < 0.001 compared with the solvent-treated vehicle control group. * P < 0.05, ** P < 0.01, and *** P < 0.001 compared with the PPD-treated negative control group).
4.5. Geranyl Acetate Suppresses Inflammatory Signaling in Para-phenylenediamine-induced HaCaT Cells
![Geranyl acetate (GA) downregulates the mRNA expression level of cytokines and chemokines in para-phenylenediamine (PPD)-stimulated HaCaT cells: A – D, HaCaT cells were seeded in 100 mm dishes (2 × 10<sup>5</sup> cells/dish) and incubated for 24 hours, followed by treatment with GA (0 - 500 μM), in the presence or absence of PPD (250 μM) for 48 hours. The mRNA expression levels of (A and B) cytokines [interleukin (IL)-1α, IL-1β, IL-6, tumor necrosis factor (TNF)-α, and IL-24] and (C and D) chemokines [C-C motif chemokine ligand (CCL) 5, CCL20, CCL26, C-X-C motif chemokine ligand (CXCL) 1, and CXCL8] were analyzed using reverse transcriptase-polymerase chain reaction (RT-PCR). The β-Actin was used as a loading control. The mRNA band intensities were quantified using ImageJ software (version 1.53t). Data are presented as mean ± standard deviation (SD, n = 3). Statistical significance was determined by one-way analysis of variance (ANOVA) followed by Tukey’s post-hoc test (# P < 0.05, ## P < 0.01, and ### P < 0.001 compared with the solvent-treated vehicle control group. * P < 0.05, ** P < 0.01, and *** P < 0.001 compared with the PPD-treated negative control group).](https://brieflands.com/journals/ijpr/articles/164379/figures/ijpr-24-1-164379-i005-preview.webp "Geranyl acetate (GA) downregulates the mRNA expression level of cytokines and chemokines in para-phenylenediamine (PPD)-stimulated HaCaT cells: A – D, HaCaT cells were seeded in 100 mm dishes (2 × 10<sup>5</sup> cells/dish) and incubated for 24 hours, followed by treatment with GA (0 - 500 μM), in the presence or absence of PPD (250 μM) for 48 hours. The mRNA expression levels of (A and B) cytokines [interleukin (IL)-1α, IL-1β, IL-6, tumor necrosis factor (TNF)-α, and IL-24] and (C and D) chemokines [C-C motif chemokine ligand (CCL) 5, CCL20, CCL26, C-X-C motif chemokine ligand (CXCL) 1, and CXCL8] were analyzed using reverse transcriptase-polymerase chain reaction (RT-PCR). The β-Actin was used as a loading control. The mRNA band intensities were quantified using ImageJ software (version 1.53t). Data are presented as mean ± standard deviation (SD, n = 3). Statistical significance was determined by one-way analysis of variance (ANOVA) followed by Tukey’s post-hoc test (# P < 0.05, ## P < 0.01, and ### P < 0.001 compared with the solvent-treated vehicle control group. * P < 0.05, ** P < 0.01, and *** P < 0.001 compared with the PPD-treated negative control group).")
Geranyl acetate (GA) downregulates the mRNA expression level of cytokines and chemokines in para-phenylenediamine (PPD)-stimulated HaCaT cells: A – D, HaCaT cells were seeded in 100 mm dishes (2 × 10⁵ cells/dish) and incubated for 24 hours, followed by treatment with GA (0 - 500 μM), in the presence or absence of PPD (250 μM) for 48 hours. The mRNA expression levels of (A and B) cytokines [interleukin (IL)-1α, IL-1β, IL-6, tumor necrosis factor (TNF)-α, and IL-24] and (C and D) chemokines [C-C motif chemokine ligand (CCL) 5, CCL20, CCL26, C-X-C motif chemokine ligand (CXCL) 1, and CXCL8] were analyzed using reverse transcriptase-polymerase chain reaction (RT-PCR). The β-Actin was used as a loading control. The mRNA band intensities were quantified using ImageJ software (version 1.53t). Data are presented as mean ± standard deviation (SD, n = 3). Statistical significance was determined by one-way analysis of variance (ANOVA) followed by Tukey’s post-hoc test (# P < 0.05, ## P < 0.01, and ### P < 0.001 compared with the solvent-treated vehicle control group. * P < 0.05, ** P < 0.01, and *** P < 0.001 compared with the PPD-treated negative control group).





