1. Background
Arthritis is a prevalent chronic degenerative joint disease that substantially impairs the quality of life of middle-aged and older adults worldwide. Its hallmark manifestations, including persistent pain, restricted joint function, and mobility impairment, impose considerable physical and psychological burdens on patients (1, 2). As the global population ages, the prevalence of arthritis has risen markedly, making it a critical public health concern. In addition to physical symptoms, patients with arthritis frequently experience mental health comorbidities, among which depression is particularly prominent. The incidence of depressive symptoms in individuals with arthritis is considerably higher than that in the general population (3). This comorbidity not only amplifies pain perception and functional impairment but also reduces treatment adherence and overall quality of life (4, 5).
The increased prevalence of depression among patients with arthritis may result from chronic pain, restricted activity, and reduced social engagement. Pain, the cardinal symptom of arthritis, causes physical discomfort and may dysregulate the neuroendocrine system through persistent stress responses, thereby triggering or exacerbating depressive symptoms (6, 7). Functional impairment and changes in body image can further compromise daily social and occupational functioning, and these shifts in social roles may intensify feelings of helplessness and isolation (8, 9). Notably, multiple arthritis subtypes, including rheumatoid arthritis, osteoarthritis, and spondyloarthritis, are each significantly correlated with an increased risk of depression, suggesting that depression is a shared mental health concern across arthritis subtypes (10, 11).
Depression in patients with arthritis is multifactorial and cannot be adequately explained by any single domain of risk factors. The biopsychosocial model provides a comprehensive framework for understanding this comorbidity, positing that depression arises from the interplay of biological factors, such as pain, chronic inflammation, and sleep disruption; psychological factors, such as life satisfaction and cognitive appraisal of illness; and social factors, such as social support, marital status, and living environment. Accordingly, guided by the biopsychosocial framework, this study adopted a multidimensional indicator system spanning demographic characteristics, behavioral and lifestyle factors, clinical comorbidities, functional status, and psychosocial conditions. This conceptual grounding not only supports the inclusion of diverse predictors but also justifies the use of a nonlinear, interactive modeling approach (XGBoost) rather than traditional additive models, because the relationships between these biopsychosocial factors and depression likely involve threshold effects, interactions, and nonlinear patterns that linear models cannot capture.
Recent advances in medical data acquisition and processing have positioned machine learning as a promising approach for predicting and identifying depression risk (12). These algorithms can efficiently handle high-dimensional data and construct predictive models that account for complex variable interactions, facilitating early intervention. Among breast cancer patients, for example, machine learning models incorporating psychological resilience, social support, and personal recovery processes have demonstrated substantially greater predictive efficacy for depressive and anxious states than traditional statistical methods (13). Similarly, studies of older adults in China have shown that machine learning algorithms can effectively identify key predictors of depression, including self-rated health, nighttime sleep duration, and cognitive function (14).
Despite these advances, research specifically targeting depression risk prediction among patients with arthritis remains limited. Prior studies have predominantly relied on traditional logistic regression models, which, although capable of identifying individual risk factors, are constrained in generalizability and predictive accuracy (15). Moreover, most investigations have focused on a single categorical variable related to sociodemographic or clinical characteristics without integrating multidimensional indicators spanning behavioral, psychological, and health-related factors, thereby limiting explanatory power and practical applicability. In this context, machine learning analyses leveraging large-scale prospective cohort data are particularly valuable. The XGBoost (eXtreme Gradient Boosting) algorithm, recognized for its efficiency in handling structured data and complex feature interactions, has been widely adopted in medical prediction tasks (16). Compared with algorithms such as random forest and support vector machines, XGBoost offers superior predictive accuracy and robustness, particularly in the presence of missing values and imbalanced data (17).
When integrated with SHAP (SHapley Additive exPlanations), the XGBoost model provides an intuitive ranking of feature importance and facilitates the interpretation of individual-level predictions, thereby enhancing clinical usability and acceptability (18). To date, no study has comprehensively applied XGBoost and SHAP to systematically analyze depressive symptoms among patients with arthritis using multidimensional indicators encompassing behavioral, health, psychological, and sociodemographic characteristics.
2. Objectives
This study aimed to develop a machine learning-based prediction model for depressive symptoms using retrospective cohort data from CHARLS and to identify key factors influencing depression onset. The findings are expected to provide data-driven support for early identification and personalized interventions to mitigate depression risk in patients with arthritis, ultimately improving their overall health and quality of life.
3. Methods
3.1. Data Sources
Data were obtained from the 2020 Wave 5 China Health and Retirement Longitudinal Survey (CHARLS) database. CHARLS uses a household-based survey design, with face-to-face computer-assisted personal interviews conducted by uniformly trained interviewers. All CHARLS data collection was approved by the Ethics Review Committee of Peking University (Approval Numbers: IRB00001052 - 11015 and IRB00001052 - 11014), and written informed consent was obtained from all participants before data collection. The following exclusion criteria were applied: 1) age < 45 years or > 85 years; 2) inability to self-report physician-diagnosed arthritis in Wave 5; and 3) implausible outliers in sleep duration, defined as daily sleep duration ≤ 1 hour or ≥ 15 hours. After rigorous screening, 6,030 participants were included in the final analysis (Figure 1).
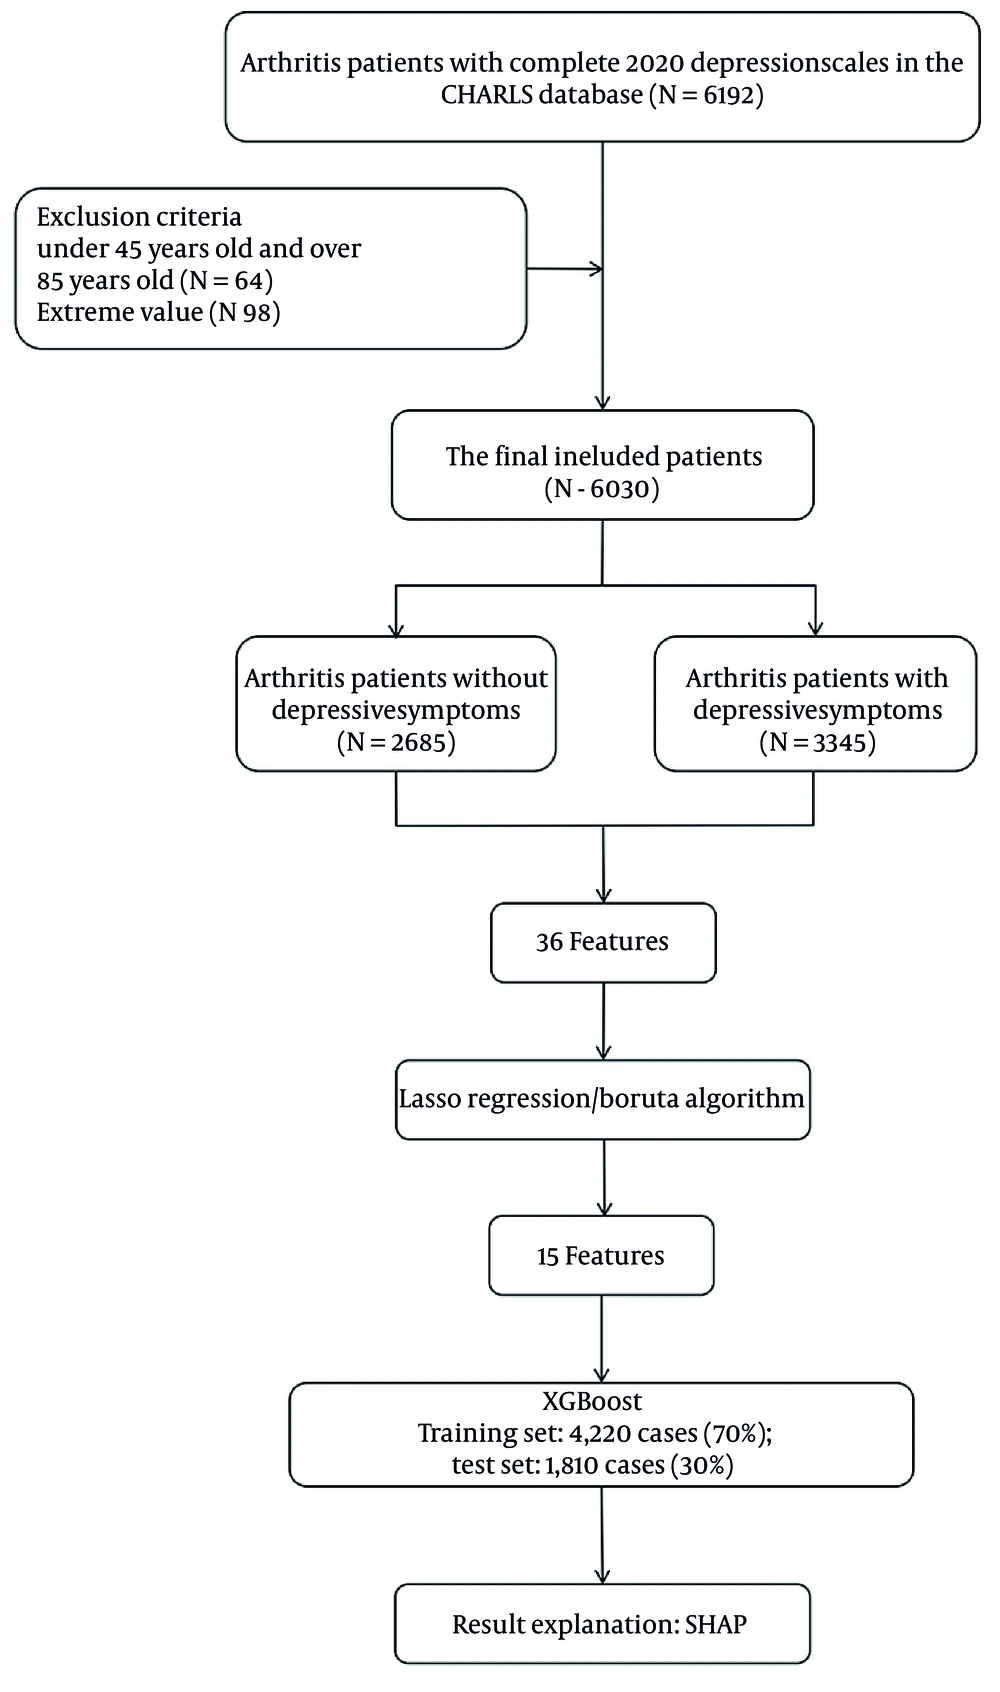
Figure 1.
Flow chart
3.2. Depression
Depressive symptoms were assessed using the 10-item Center for Epidemiological Studies Depression Scale (CES-D-10). This scale has demonstrated good reliability and validity in Chinese adult populations (19). Each item is scored from 0 to 3 according to symptom frequency, ranging from "rarely or none of the time" to "most or all of the time." Total scores range from 0 to 30, with higher scores indicating more severe depressive symptoms. A cutoff of ≥ 10 points was used to define clinically significant depressive symptoms, consistent with prior validation studies (20). For brevity, the term "depression" is used throughout to refer to depressive symptoms of varying severity.
3.3. Sociodemographic and Behavioral Characteristics
The following sociodemographic characteristics were analyzed: age, sex, marital status, permanent residence type, educational level, medical insurance coverage, and employment or retirement status. Sex was classified as male or female. Marital status was dichotomized based on the presence of a living spouse. Residence type was categorized as urban or rural. Educational attainment was categorized as below high school or high school or above. Insurance coverage, including both old-age and medical insurance, was classified as present or absent. Employment and retirement status were coded as yes or no. Behavioral factors included smoking history, alcohol consumption, participation in social activities, and average nighttime sleep duration. Smoking, alcohol use, and social activity participation were each classified as present or absent. Nighttime sleep duration was assessed using the question, "How many actual hours did you sleep on average each night in the past month?"
3.4. State of Health
Based on prior literature and clinical expertise, we identified indicators potentially associated with depression, including chronic conditions (hypertension, cancer, dyslipidemia, heart disease, stroke, arthritis, mental illness, liver disease, kidney disease, digestive system disorders, and asthma), life satisfaction, Activities of Daily Living (ADL) score, pain status, and cognitive function. Life satisfaction was rated as poor, average, or good. Pain was defined as persistent discomfort in any of the following sites: head, shoulder, arm, wrist, finger, chest, stomach, back, lumbar region, hip, leg, knee, ankle, or toe, as well as in the neck. ADL was evaluated based on the level of independence in completing daily activities (21).
3.5. Data Preprocessing
The final sample included 2,685 arthritis patients without depressive symptoms and 3,345 with depressive symptoms. The relatively balanced distribution of the outcome variable enabled the machine learning models to learn class distinctions without requiring data-balancing techniques such as SMOTE (22), thereby reducing the risk of overpredicting the majority class.
To prevent data leakage and ensure unbiased performance estimation, feature selection was conducted exclusively in the training set. Irrelevant and redundant variables were removed before model training to reduce noise and mitigate overfitting (23). Variables were excluded based on two criteria: 1) missingness > 20% and 2) no established association with depression based on prior literature and clinical expertise. For variables with missingness < 20%, multiple imputation was performed using the mice package in R (m = 5 imputed datasets) to minimize bias rather than excluding participants with incomplete data (24). Imputation was conducted before data partitioning to prevent information leakage. Model fit indices showed high stability across imputations: log-likelihood ranged from -2,903.83 to -2,903.32, AIC from 5,895.64 to 5,898.02, and BIC from 6,180.77 to 6,188.89. Null deviance (6,475.30) and residual degrees of freedom (4, 543) remained consistent, supporting the reliability of the pooled estimates.
This process retained 36 candidate features covering demographic characteristics (sex, marital status, residence type, educational level, family size), clinical comorbidities (hypertension, lung disease, diabetes, cancer, heart disease, stroke, arthritis, mental illness, dyslipidemia, liver disease, kidney disease, digestive system disease, asthma, stomach disease, memory disorder, and number of chronic diseases), functional status (ADL rating, disability status), lifestyle factors (alcohol consumption, smoking, sleep duration), socioeconomic variables (endowment insurance, retirement, work status), and environmental factors (water access, electricity access, social activities, life satisfaction, fall history, hip fracture history, and age).
3.6. Variable Selection and Model Development
Variable selection was performed using the Boruta algorithm and LASSO regression with 10-fold cross-validation, applied exclusively to the training set. The intersection of variables identified by both methods was retained. Using the selected variables, an XGBoost model was developed with hyperparameter optimization via randomized search with 5-fold cross-validation (25). To prevent overfitting and evaluate generalizability, the sample was randomly split into a training set (70%) and a test set (30%) (26). The model was trained in the training set using 10-fold cross-validation for internal validation. Model performance was evaluated in terms of discrimination, calibration, and clinical utility. Discrimination was assessed using the receiver operating characteristic (ROC) curve. Calibration was evaluated using calibration curves and the Brier score, which reflects the mean squared difference between predicted probabilities and observed outcomes. Clinical utility was assessed using decision curve analysis (DCA), which estimates net benefit across probability thresholds. Additional performance metrics, including accuracy, sensitivity, specificity, precision, and F1 score, were derived from confusion matrices. Finally, SHAP was applied to interpret model predictions and quantify feature importance.
3.7. XGBoost-SHAP
XGBoost (eXtreme Gradient Boosting) was selected as the primary prediction algorithm because of its well-documented advantages for structured medical data. As a gradient-boosted tree ensemble, XGBoost builds sequentially additive decision trees, with each tree correcting the residual errors of its predecessors. This architecture offers several advantages over traditional logistic regression: 1) it naturally captures nonlinear dose-response relationships without requiring prespecified polynomial or spline terms; 2) it automatically models complex interactions among predictors without explicit interaction-term specification; and 3) its built-in regularization (L1 and L2 penalties), column subsampling, and shrinkage mechanisms provide robust protection against overfitting. To interpret the XGBoost model, we applied SHAP (SHapley Additive exPlanations), a game-theoretic framework that decomposes each individual prediction into additive feature contributions. SHAP provides both global feature-importance ranking (mean absolute SHAP value) and local, individual-level explanations, and it indicates the direction of each feature effect for every observation. Its game-theoretic foundation ensures consistency and local accuracy, properties not guaranteed by other interpretability methods. This XGBoost-SHAP approach balances predictive accuracy with clinical interpretability and has been widely adopted in recent clinical prediction modeling studies.
3.8. Temporal External Validation
To evaluate temporal generalizability, external validation was performed using CHARLS Wave 4 data collected in 2015. This temporal validation set comprised 5,918 participants with self-reported physician-diagnosed arthritis, using the same exclusion criteria as in the primary analysis. The model trained on the Wave 5 training set was applied directly, without retraining or parameter updating. Performance was evaluated using AUC, accuracy, sensitivity, specificity, F1 score, Brier score, calibration curves, and decision curve analysis.
4. Results
4.1. Screening Variables
In this study, the LASSO regression model and the Boruta algorithm were used to examine factors influencing depression, and the optimal regularization parameters were determined using 10-fold cross-validation. The analysis identified 15 relevant variables (Figure 2). The 15 optimal predictor variables were pain, mental illness, rural/urban residence, memory disorders, marital status, electricity availability, stomach disease, number of chronic diseases, falls, ADL (activities of daily living), gender, life satisfaction, retirement status, nocturnal sleep duration, and medical insurance. The values of these 15 selected variables, along with the number of missing values, are presented in Table 1. Under the lambda.min condition, corresponding to the λ value that minimized the mean squared error, multiple variables were identified as significant predictors of depression. Notably, gender (β = -0.48), life satisfaction (β = -0.33), presence of pain (β = 0.63), and retirement status (β = -0.39) demonstrated strong associations with depression. Under the lambda.1se condition, corresponding to the λ value within 1 standard error of the minimum error, the model was simplified, retaining only the core variables of gender, life satisfaction, presence of pain, and retirement status, while the coefficients of several health-related variables were shrunk to zero. These findings suggest that the occurrence of depression is closely associated with demographic characteristics, health status, and socioeconomic factors (Figure 2).
Table 1.
Variable Assignment, Missing Values, and Regression Coefficients of LASSO Regression
| Variables | Assignment Explanation | Missing values (number) | β | Variable | Assignment Explanation | Missing values (number) | β |
|---|---|---|---|---|---|---|---|
| Gender | Male = 0, Female = 1 | 0 | -0.48 | ADL | 0 items requiring reliance on others = 0 | 0 | 0.14 |
| Digestive system disease | No = 0, Yes = 1 | 0 | 0.12 | ADL | 1 item requiring reliance on others = 1 | 0 | 0.14 |
| Psychiatric disorder | No = 0, Yes = 1 | 0 | 0.24 | ADL | 2 items requiring reliance on others = 2 | 0 | 0.14 |
| Memory disorder | No = 0, Yes = 1 | 0 | 0.20 | ADL | 3 items requiring reliance on others = 3 | 0 | 0.14 |
| Pain | No = 0, Yes = 1 | 0 | 0.63 | ADL | 4 items requiring reliance on others = 4 | 0 | 0.14 |
| Sleep duration at night | Continuous variable | 0 | -0.14 | ADL | 5 items requiring reliance on others = 5 | 0 | 0.14 |
| Fall history | No = 0, Yes = 1 | 0 | 0.18 | ADL | 6 items requiring reliance on others = 6 | 0 | 0.14 |
| Access to electricity | No = 0, Yes = 1 | 7 | 0.12 | Life satisfaction | Not satisfied = 1 | 82 | -0.33 |
| Retirement status | No = 0, Yes = 1 | 0 | -0.39 | Life satisfaction | Average = 2 | 82 | -0.33 |
| Place of residence | Rural = 0, Urban = 1 | 0 | 0.23 | Life satisfaction | Satisfied = 3 | 82 | -0.33 |
| Marital status | No spouse = 0, spouse present = 1 | 0 | 0.20 | Health insurance | No = 0, Yes = 1 | 0 | -0.23 |
| Number of chronic diseases | Continuous variable | 0 | 0.12 | - | - | - | - |
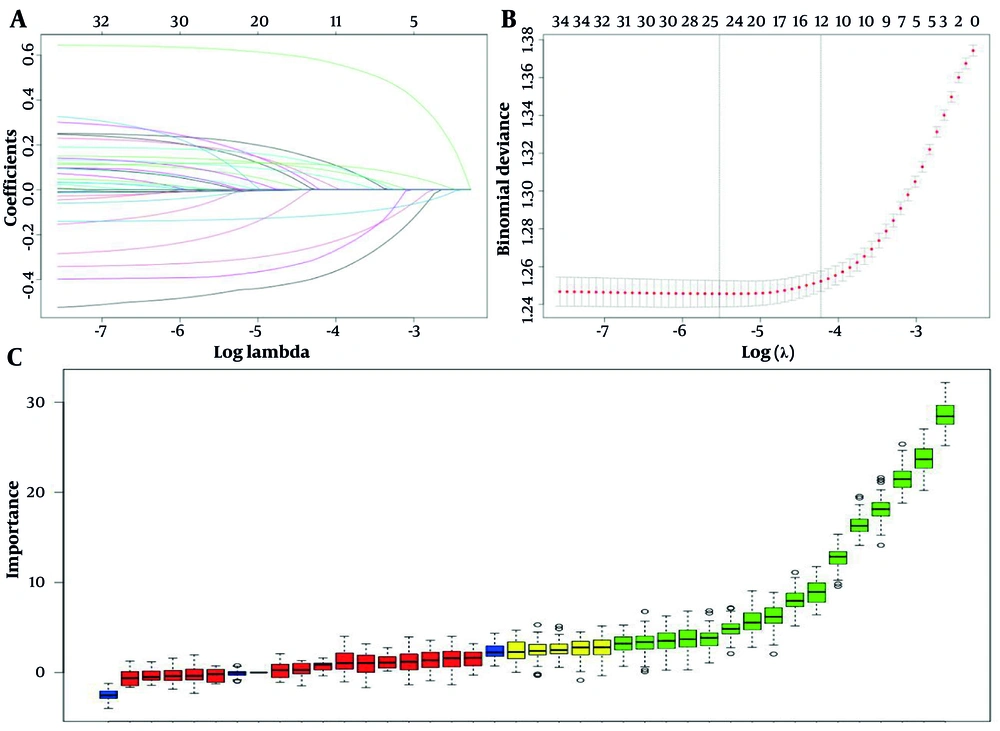
Figure 2.
Variable selection. A and B show variables selected by LASSO regression. C shows variables screened by the Boruta algorithm.
4.2. Baseline Characteristics of the Screened Variables
This study used data from Wave 5 of the CHARLS survey, encompassing 19,395 individuals. After preprocessing, 6,030 arthritis cases were included, accounting for 81.35% of all arthritis patients in Wave 5. Among these, 58.6% were female, and 3,345 (55.5%) had a CES-D-10 score ≥ 10, indicating clinically significant depressive symptoms. Table 2 presents the baseline characteristics of the selected variables. Statistically significant differences between the depressed and non-depressed groups were observed for most demographic and health-related variables.
Table 2.
Baseline Characteristics of the Study Population by Depressive Status a
| Variables | Description (n = 6030) | Non-depression (n = 2685) | Depression (n = 3345) | P-Value |
|---|---|---|---|---|
| No. | 6,030 | 2,685 | 3,345 | |
| Age | 63.50 ± 8.70 | 63.63 ± 8.79 | 63.40 ± 8.62 | 0.30 |
| Gender | < 0.01 | |||
| Male | 3,533 (58.6) | 1,355 (50.5) | 2,178 (65.1) | |
| Female | 2,497 (41.4) | 1,330 (49.5) | 1,167 (34.9) | |
| Life satisfaction | < 0.01 | |||
| Poor | 376 (6.2) | 85 (3.1) | 291 (8.7) | |
| General | 5,258 (87.2) | 2,363 (88.0) | 2,895 (86.6) | |
| Good | 396 (6.6) | 237 (8.9) | 159 (4.7) | |
| Gastric disease | < 0.01 | |||
| No | 3,340 (55.4) | 1,681 (62.6) | 1,659 (49.6) | |
| Yes | 2,690 (44.6) | 1,004 (37.4) | 1,686 (50.4) | |
| Psychiatric disorder | < 0.01 | |||
| No | 5,808 (96.3) | 2,632 (98.0) | 3,176 (94.9) | |
| Yes | 222 (3.7) | 53 (2.0) | 169 (5.1) | |
| Memory disorder | < 0.01 | |||
| No | 5,658 (93.8) | 2,579 (96.0) | 3,079 (92.1) | |
| Yes | 372 (6.2) | 106 (4.0) | 266 (7.9) | |
| Pain | < 0.01 | |||
| No | 1,380 (22.9) | 876 (32.6) | 504 (15.1) | |
| Yes | 4,650 (77.1) | 1,809 (67.4) | 2,841 (84.9) | |
| Retirement status | < 0.01 | |||
| No | 5,085 (84.3) | 2,166 (80.7) | 2,919 (87.3) | |
| Yes | 945 (15.7) | 519 (19.3) | 426 (12.7) | |
| Place of residence | < 0.01 | |||
| Rural areas | 2,118 (35.1) | 1,055 (39.3) | 1,063 (31.8) | |
| Cities | 3,912 (64.9) | 1,630 (60.7) | 2,282 (68.2) | |
| Marital status | < 0.01 | |||
| Unmarried | 5,065 (84.0) | 2,327 (86.7) | 2,738 (81.9) | |
| Have a spouse | 965 (16.0) | 358 (13.3) | 607 (18.1) | |
| Health insurance | 0.03 | |||
| No | 245 (4.1) | 92 (3.4) | 153 (4.6) | |
| Yes | 5,785 (95.9) | 2,593 (96.6) | 3,192 (95.4) | |
| Fall history | < 0.01 | |||
| No | 2,869 (47.6) | 1,446 (53.9) | 1,423 (42.5) | |
| Yes | 3,161 (52.4) | 1,239 (46.1) | 1,922 (57.5) | |
| Access to electricity | 0.54 | |||
| No | 48 (0.8) | 24 (0.9) | 24 (0.7) | |
| Yes | 5,982 (99.2) | 2,661 (99.1) | 3,321 (99.3) | |
| Sleep duration at night | 5.84 ± 1.83 | 6.21 ± 1.72 | 5.54 ± 1.87 | < 0.01 |
| ADL | 0 (0 - 1) | 0 (0 - 0) | 0 (0 - 1) | < 0.01 |
| Number of chronic diseases | 3 (2 - 5) | 3 (2 - 4) | 3 (2 - 5) | < 0.01 |
a Values are expressed as mean ± SD, median (interquartile range), or No. (%). P values were derived from Student t test, Mann-Whitney U test, or χ2 test, as appropriate.
Additionally, 5,918 arthritis patients from the 2015 Wave 4 CHARLS cohort were included as a temporal validation group. Table 3 presents the demographic comparison between the Wave 4 and Wave 5 samples; significant differences were observed for several characteristics (P < 0.05).
Table 3.
Comparison of Characteristics Between Wave 4 and Wave 5 a
| Variables | Total (n = 11,948) | Wave 4 (n = 5,918) | Wave 5 (n = 6,030) | P-Value |
|---|---|---|---|---|
| Age | 62.21 ± 8.89 | 62.21 ± 8.89 | 63.50 ± 8.70 | < 0.01 |
| Gender | 0.73 | |||
| Male | 6,958 (58.2) | 3,425 (57.9) | 3,533 (58.6) | |
| Female | 4,990 (41.8) | 2,493 (42.1) | 2,497 (41.4) | |
| Life satisfaction | < 0.01 | |||
| Poor | 1,208 (10.1) | 832 (14.1) | 376 (6.2) | |
| General | 8,577 (71.8) | 3,319 (56.1) | 5,258 (87.2) | |
| Good | 2,163 (18.1) | 1,767 (29.9) | 396 (6.6) | |
| Gastric disease | 0.15 | |||
| No | 6,722 (56.3) | 3,382 (57.1) | 3,340 (55.4) | |
| Yes | 5,226 (43.7) | 2,536 (42.9) | 2,690 (44.6) | |
| Psychiatric disorder | 0.38 | |||
| No | 11,490 (96.2) | 5,682 (96) | 5,808 (96.3) | |
| Yes | 458 (3.8) | 236 (4) | 222 (3.7) | |
| Memory disorder | < 0.01 | |||
| No | 11,321 (94.8) | 5,663 (95.7) | 5,658 (93.8) | |
| Yes | 627 (5.2) | 255 (4.3) | 372 (6.2) | |
| Pain | 0.49 | |||
| No | 2,789 (23.3) | 1,409 (23.8) | 1,380 (22.9) | |
| Yes | 9,159 (76.7) | 4,509 (76.2) | 4,650 (77.1) | |
| Retirement status | < 0.01 | |||
| No | 10,231 (85.6) | 5,146 (87) | 5,085 (84.3) | |
| Yes | 1,717 (14.4) | 772 (13) | 945 (15.7) | |
| Place of residence | 0.95 | |||
| Rural areas | 4,213 (35.3) | 2,095 (35.4) | 2,118 (35.1) | |
| Cities | 7,735 (64.7) | 3,823 (64.6) | 3,912 (64.9) | |
| Marital status | < 0.01 | |||
| Have a spouse | 9,755 (81.6) | 4,690 (79.2) | 5,065 (84) | |
| Unmarried | 2,193 (18.4) | 1,228 (20.8) | 965 (16) | |
| Health insurance | 0.01 | |||
| No | 413 (3.5) | 168 (2.8) | 245 (4.1) | |
| Yes | 11,535 (96.5) | 5,750 (97.2) | 5,785 (95.9) | |
| Fall history | < 0.01 | |||
| No | 5,981 (50.1) | 3,112 (52.6) | 2,869 (47.6) | |
| Yes | 5,967 (49.9) | 2,806 (47.4) | 3,161 (52.4) | |
| Access to electricity | 0.996 | |||
| No | 96 (0.8) | 48 (0.8) | 48 (0.8) | |
| Yes | 11,842 (99.2) | 5,860 (99.2) | 5,982 (99.2) | |
| Sleep duration at night | 5.96 ± 1.95 | 5.96 ± 1.95 | 5.84 ± 1.83 | < 0.01 |
| ADL | 0 (0 - 1) | 0 (0 - 1) | 0 (0 - 1) | < 0.01 |
| Number of chronic diseases | 3 (2 - 4) | 3 (2 - 4) | 3 (2 - 5) | < 0.01 |
a Values are expressed as mean ± SD, median (interquartile range), or No. (%).
4.3. Model Performance
Based on 15 clinical and sociodemographic features, the XGBoost prediction model achieved moderate-to-good discriminative performance in the training set (AUC = 0.752; 95% CI: 0.738 - 0.767), with an accuracy of 0.689, sensitivity of 0.769, and specificity of 0.589. In the test set, the model yielded an AUC of 0.687 (95% CI: 0.662 - 0.712), accuracy of 0.640, sensitivity of 0.745, and specificity of 0.510. The AUC difference between the training and test sets was 0.065, indicating some overfitting that remained within an acceptable range (Table 4). In the Wave 4 temporal external validation set, the model demonstrated an AUC of 0.712 (95% CI: 0.699 - 0.725), accuracy of 0.661, sensitivity of 0.686, and specificity of 0.630. These results were highly consistent with those of the test set, suggesting favorable temporal generalizability (Figure 3D).
Table 4.
Detailed Indicators of the Training Set, Test Set, and Temporal Validation Set in the Model
| Indicators | Train | Test | Wave 4 validation |
|---|---|---|---|
| AUC | 0.752 | 0.687 | 0.712 |
| AUC 95% CI | (0.738 - 0.767) | (0.662 - 0.712) | (0.699 - 0.725) |
| Accuracy | 0.689 | 0.640 | 0.661 |
| Precision | 0.700 | 0.653 | 0.694 |
| Recall (sensitivity) | 0.769 | 0.745 | 0.686 |
| Specificity | 0.589 | 0.510 | 0.630 |
| F1 score | 0.733 | 0.696 | 0.690 |
| Brier score | 0.202 | 0.222 | 0.215 |
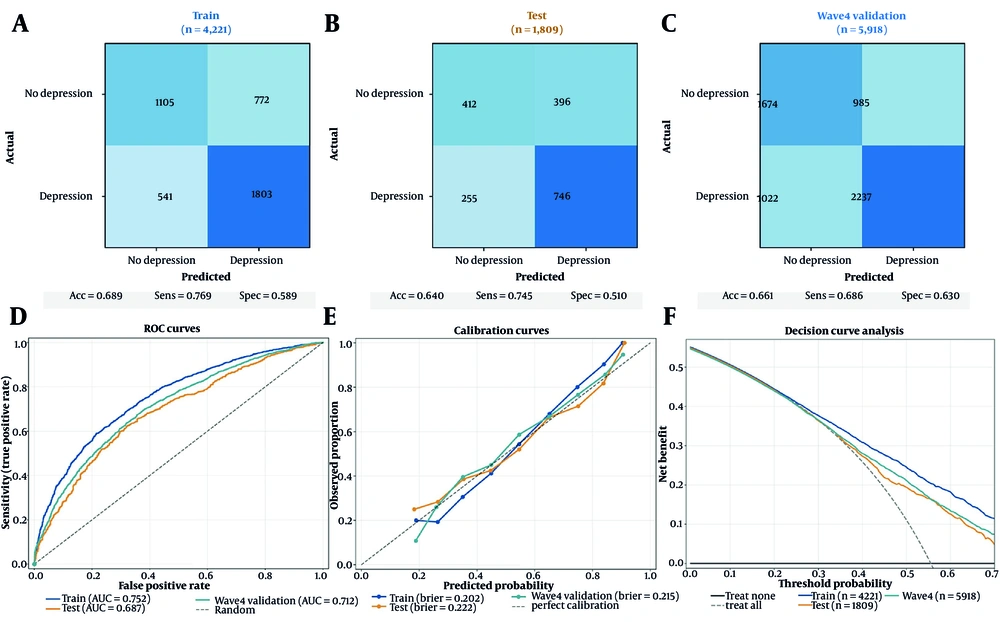
Figure 3.
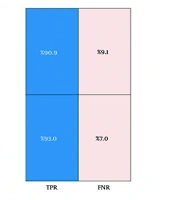
Model performance. A - C, Confusion matrices; D, receiver operating characteristic (ROC) curves; E, calibration curves; F, decision curve analysis (DCA).
Model performance was also evaluated using the Brier score. The Brier score was 0.202 in the training set, 0.222 in the test set, and 0.215 in the Wave 4 validation set, indicating acceptable predictive accuracy with minimal overfitting. Decision curve analysis showed that within the clinically relevant threshold probability range of 0.15 to 0.50, the model yielded a net benefit superior to both "treat all" and "treat none" strategies across all three datasets, suggesting potential clinical applicability (Figure 3F). Confusion matrices and corresponding performance metrics are presented in Figure 3A - C and Table 4.
4.4. Feature Importance
Figure 4A presents the SHAP swarm plot illustrating the contribution of each feature to depression prediction across the full sample. Features are ranked on the vertical axis by mean absolute SHAP value, reflecting global importance. The horizontal axis represents the SHAP value for each individual observation, indicating the direction and magnitude of local effects. Color denotes the original feature value, with blue representing lower values and purple representing higher values.
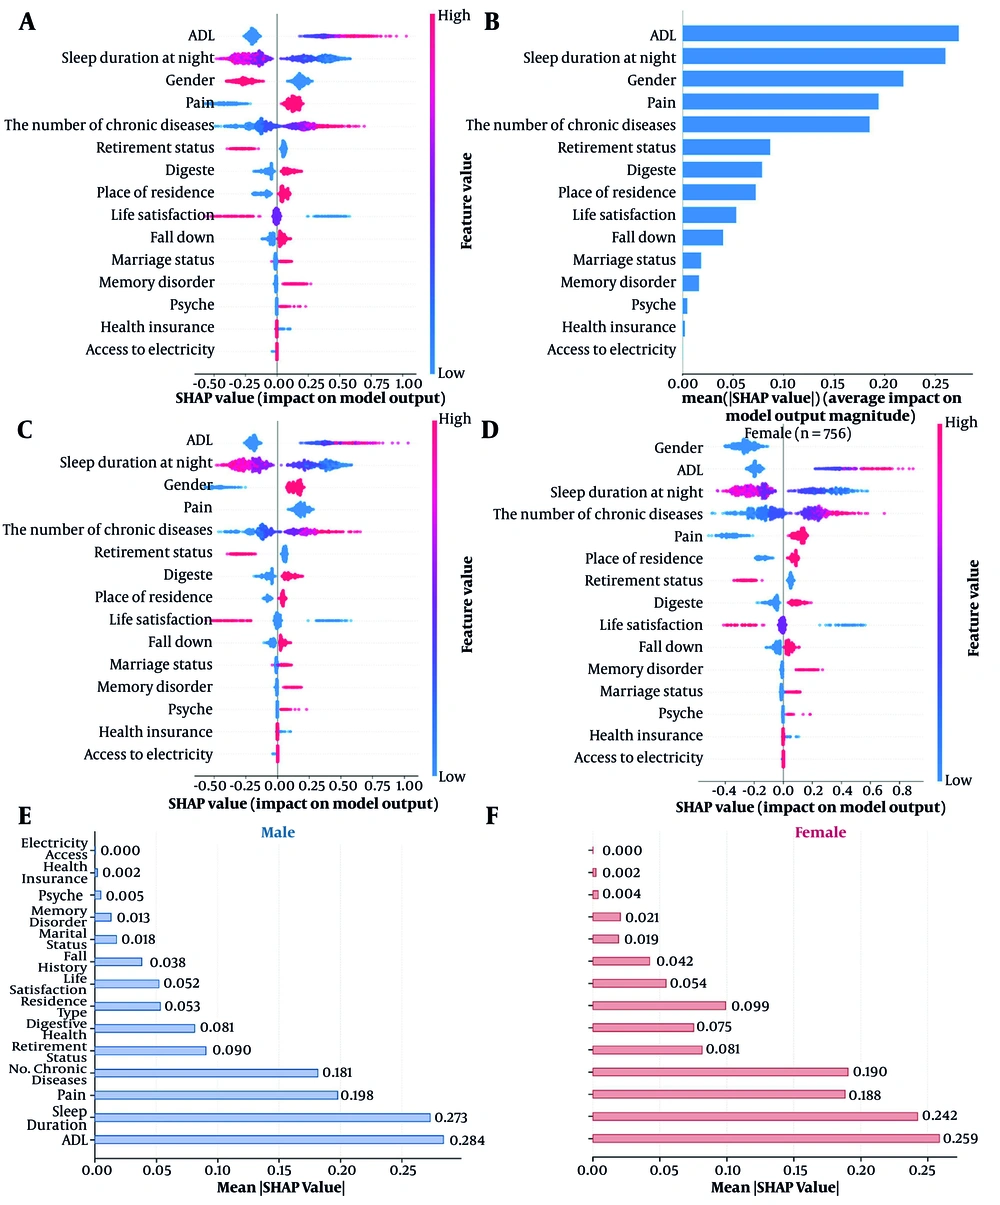
Figure 4.
Characteristic attributes in SHAP. A, SHAP beeswarm plot (overall); B, SHAP bar chart (overall); C, SHAP beeswarm plot (male); D, SHAP beeswarm plot (female); E, SHAP bar chart (male); F, SHAP bar chart (female).
ADL limitation ranked highest in global importance (Mean |SHAP| = 0.273), followed by nighttime sleep duration (Mean |SHAP| = 0.260), sex (Mean |SHAP| = 0.218), pain (Mean |SHAP| = 0.194), and number of chronic diseases (Mean |SHAP| = 0.185). Greater ADL limitation and shorter nighttime sleep duration were associated with an increased risk of depression, whereas longer sleep duration and better ADL function were protective. Frequent pain was positively associated with depressive mood, whereas the absence of pain was associated with lower risk. An increasing burden of chronic diseases was consistently associated with a higher risk of depression. Female sex (gender = 1) was a risk factor, whereas male sex (gender = 0) was protective. Retirement status (Mean |SHAP| = 0.087), digestive system health (Mean |SHAP| = 0.079), and residence type (Mean |SHAP| = 0.073) demonstrated moderate contributions. Life satisfaction (Mean |SHAP| = 0.053) and fall history (Mean |SHAP| = 0.040) showed relatively smaller effects; higher life satisfaction was protective, whereas a history of falls increased risk. The remaining features, including marital status (Mean |SHAP| = 0.018) and memory impairment (Mean |SHAP| = 0.016), contributed in descending order (Figure 4B).
4.5. Sex-Stratified SHAP Analysis
Sex-stratified analyses (Figure 4C - F) revealed notable differences in risk factor profiles. ADL limitation was the strongest predictor in both sexes, but its importance was higher in males (Mean |SHAP| = 0.284) than in females (Mean |SHAP| = 0.259). Nighttime sleep duration followed a similar pattern, with greater importance in males (Mean |SHAP| = 0.273) than in females (Mean |SHAP| = 0.242). Chronic disease burden exerted a larger effect in females (Mean |SHAP| = 0.190) than in males (Mean |SHAP| = 0.181). Residence type was substantially more important in females (Mean |SHAP| = 0.099) than in males (Mean |SHAP| = 0.053). Memory impairment (females: 0.021 vs males: 0.013) and marital status (females: 0.019 vs males: 0.018) were also more prominent in females, suggesting that psychosocial and cognitive factors play a greater role in depression risk among women. In contrast, sex differences were modest for digestive system disease (males: 0.081 vs females: 0.075), fall history (males: 0.038 vs females: 0.042), and life satisfaction (males: 0.052 vs females: 0.055). Retirement status was slightly higher in males (0.090) than in females.
5. Discussion
Leveraging the nationally representative CHARLS database, this study used the XGBoost algorithm combined with SHAP interpretability analysis (27) to systematically evaluate predictors of comorbid depression and sex-based differences among middle-aged and older Chinese adults with arthritis. The model demonstrated stable and acceptable discriminative performance in both the training set and the temporal validation set, indicating good generalizability and temporal stability.
5.1. Core Predictors and Clinical Implications
SHAP analysis identified five core predictors: ADL limitation, nighttime sleep duration, sex, pain, and number of chronic diseases. Among these predictors, nighttime sleep duration showed a pronounced inverted J-shaped dose-response relationship with depression risk. Short sleep (≤5 hours/night) was associated with a sharp increase in depression probability, whereas moderate sleep (approximately 6 - 8 hours/night) corresponded to the lowest risk. Beyond this range, longer sleep duration conferred no additional protective benefit and showed a slight upward trend. This nonlinear pattern has direct clinical relevance: the sleep-depression association in patients with arthritis is not linear, and interventions aimed at extending sleep in already sufficient sleepers are unlikely to yield additional mood benefits (27, 28). Instead, clinical efforts should prioritize identifying and addressing short sleep, which confers the most pronounced risk.
This nonlinear pattern is particularly relevant to the pathophysiology of depression in patients with arthritis. Short sleep may exacerbate depression through multiple pathways: it amplifies pain perception by lowering the pain threshold, disrupts emotion regulation via hypothalamic-pituitary-adrenal (HPA) axis hyperactivity, and reduces daytime physical activity (28), creating a downstream cascade that further degrades mood. The lack of additional benefit beyond moderate sleep suggests that sleep extension alone, without addressing the underlying pain and inflammatory burden of arthritis, is unlikely to alleviate depressive symptoms, a clinically important distinction for treatment prioritization.
ADL limitation, the most globally important predictor, exhibited a distinct threshold pattern: the transition from full functional independence (ADL = 0) to any degree of dependence (ADL ≥ 1) was associated with a marked increase in depression risk, with diminishing incremental effects at higher ADL levels. This pattern suggests a functional "tipping point," whereby even mild loss of independence carries disproportionate psychological consequences. Among patients with arthritis, declining capacity for daily activities due to joint pain and stiffness may trigger loss of self-efficacy and reduced social participation, creating a vicious cycle in which functional impairment increases depression risk and depression, in turn, accelerates functional decline. This threshold effect was particularly pronounced in males, who may more strongly associate physical autonomy with self-worth, such that even mild functional dependence could precipitate a rapid loss of role identity and subsequent mood disturbance.
5.2. Mechanistic Interpretation of Sex Differences
Stratified analyses revealed a notable "crossed" pattern: depression risk in males was predominantly driven by ADL limitation and sleep duration (the "physical capacity" dimension), whereas females were more strongly influenced by psychosocial factors, including chronic disease burden, residence type, digestive system conditions, and marital status (the "psychosocial environment" dimension). The relative importance of residence type in females was approximately twice that observed in males, suggesting that rural living conditions exert a particularly pronounced impact on female mental health. Mechanistically, these findings align with the differential stress model (29, 30), which posits that women are more vulnerable to interpersonal and environmental stressors, whereas men respond primarily to threats to capability.
Female pathway: Residence in rural areas, widowhood, or marital dissolution may lead to weakened social support networks, heightened economic insecurity, and increased caregiving burden, all of which are associated with elevated depression scores in women. Digestive system diseases, often accompanied by chronic pain and dietary restrictions, may further impede social participation in cultural contexts characterized by a gendered division of domestic roles.
Male pathway: Depression in males was primarily driven by functional dependence. In many sociocultural contexts, men may equate physical autonomy with self-worth; consequently, even mild ADL limitation could precipitate a rapid loss of role identity and subsequent mood disturbance. The negligible contributions of residence type and marital status in males further reinforce this physical-capacity perspective.
5.3. Clinical Implications
These findings suggest that sex-stratified screening algorithms should apply differentiated weighting schemes rather than a uniform set of predictive criteria. For female patients, interventions such as strengthening community support networks, improving access to rural health care services, and managing digestive comorbidities may yield substantial mental health benefits. For male patients, treatment priorities should focus on active functional rehabilitation and interventions aimed at preserving activities of daily living.
5.4. Limitations and Future Directions
Several limitations should be acknowledged. CHARLS data are based on self-reported questionnaires and are subject to recall bias. Arthritis diagnosis relied on self-report rather than medical record review, which may introduce classification bias. Somatic symptom overlap between arthritis and depression, such as fatigue, sleep disturbance, and reduced activity captured by the CES-D-10, may also introduce measurement confounding, potentially inflating the apparent association between physical health predictors and depressive symptom classification. The model's specificity in females (0.510) remains suboptimal, suggesting that additional female-specific factors may need to be incorporated. Although SHAP provides intuitive feature-importance rankings, these values reflect model-level associations rather than causal effects. Given the moderate discriminative performance (AUC = 0.687 - 0.752), the identified predictors should be interpreted as screening indicators for risk stratification rather than definitive diagnostic markers, warranting future longitudinal studies to validate clinical utility and the use of depression assessment tools that distinguish somatic from cognitive-affective symptoms.
5.5. Conclusions
Machine learning analysis based on XGBoost and SHAP identified ADL limitation, nighttime sleep duration, sex, pain, and number of chronic diseases as core predictors of comorbid depression in middle-aged and older Chinese adults with arthritis. The model demonstrated moderate discriminative performance and a degree of clinical net benefit. Sex-stratified analyses revealed differential risk factor profiles: Psychosocial factors, including residence type, memory function, and marital status, were more prominent in females, whereas physical function factors, including ADL and sleep, predominated in males. These findings suggest that personalized depression screening strategies should be tailored by sex, with an emphasis on functional status and sleep quality in males and on social support and cognitive function in females.