


1. Background
2. Objectives
3. Patients and Methods
3.1. Patients

The flowchart of patient enrollment
3.2. CMR T1 Mapping and LV Short-Axis Cine Sequence Imaging
3.3. Segmentation
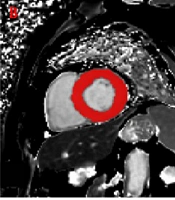
 drawn manually on the same image: B, ROI and T1 mapping image at the basal level; E, ROI and T1 mapping image at the mid-chamber level; and H, ROI and T1 mapping image at the apical level. The right panels only show the corresponding ROIs: C, ROI in the base; F, ROI in the mid-chamber; and I, ROI in the apex.")
The left panels show a set of cardiac MRI T1 mapping images in a 54-year-old patient diagnosed with HCM: A, Short-axis T1 mapping image at the basal level; D, Short-axis T1 mapping image at the mid-chamber level; and G, Short-axis T1 mapping image at the apical level. The middle panels show a set of regions of interest (ROIs) drawn manually on the same image: B, ROI and T1 mapping image at the basal level; E, ROI and T1 mapping image at the mid-chamber level; and H, ROI and T1 mapping image at the apical level. The right panels only show the corresponding ROIs: C, ROI in the base; F, ROI in the mid-chamber; and I, ROI in the apex.
3.4. Extraction of Radiomic Features
3.5. feature Selection
3.6. Classification and Evaluation of the Models
3.7. Statistical Analysis
4. Results
| Total (N = 91) | HCM (N = 28) | HHD (N = 22) | AC (N = 27) | Controls (N = 14) | P Value | |
|---|---|---|---|---|---|---|
| Age (years), mean ± SD | 48 ± 13 | 42 ± 13 a | 47 ± 14 a | 57 ± 11 | 45 ± 10 a | 0.001 |
| Sex (male), No. (%) | 68 (75%) | 19 (68%) a | 20 (91%) a | 20 (74%) | 9 (64%) a | < 0.001 |
| Heart rate (beats/min), mean ± SD | 84 ± 14 | 90 ± 13 bc | 82 ± 12 | 84 ± 16 | 80 ± 9 | 0.088 |
| Systolic blood pressure (mmHg), mean ± SD | 137 ± 32 | 141 ± 24 bac | 175 ± 26 c | 117 ± 21 b | 114 ± 13 | < 0.001 |
| Diastolic blood pressure (mmHg), mean ± SD | 88 ± 19 | 88 ± 12 ba | 110 ± 20 c | 74 ± 12 bc | 83 ± 10 | < 0.001 |
| CMR | < 0.001 | |||||
| LV end-diastolic volume (mL), , mean ± SD | 143 ± 46 | 133 ± 26 b | 177 ± 45 c | 125 ± 57 b | 145 ± 21 | |
| LV ejection fraction (%),, mean ± SD | 55 ± 14 | 64 ± 8 ba | 48 ± 15 c | 47 ± 13 c | 65 ± 10 | |
| Native T1 (ms), mean ± SD | 1340 ± 93 | 1304 ± 42 ac | 1309 ± 62 ac | 1449 ± 68 c | 1243 ± 42 |
Abbreviations: CMR, Cardiac magnetic resonance; HCM, Hypertrophic cardiomyopathy; HHD, Hypertensive heart disease; AC, Amyloid cardiomyopathy; LV, Left ventricular; P value is calculated for the four groups; MRI, magnetic resonance imaging.
a Significant difference versus AC.
b Significant difference versus HHD.
c Significant difference versus the controls.
| Model | Features | No. |
|---|---|---|
| Basal T1 mapping | Original_shape2D_MajorAxisLength, original_shape2D_MinorAxisLength, original_shape2D_MaximumDiameter, squareroot_firstorder_10Percentile, exponential_glcm_ClusterTendency, bp-2D_glcm_JointEntropy, exponential_glrlm_GrayLevelNonUniformity, exponential_glszm_SizeZoneNonUniformity lbp-2D_glrlm_RunLengthNonUniformity, wavelet-HH_firstorder_Kurtosis, original_glszm_ZoneEntropy | 11 |
| Mid-chamber T1 mapping | Original_shape2D_MajorAxisLength, original_shape2D_MinorAxisLength, gradient_glcm_Imc2 squareroot_gldm_LargeDependenceHighGrayLevelEmphasis, squareroot_glrlm_GrayLevelNonUniformity, square_glszm_LargeAreaHighGrayLevelEmphasis gradient_glszm_SmallAreaLowGrayLevelEmphasis, square_glszm_GrayLevelVariance square_glcm_Idmn, logarithm_ngtdm_Contrast, squareroot_glcm_InverseVariance, square_ngtdm_Contrast, gradient_ngtdm_Coarseness, square_firstorder_Skewness, square_firstorder_Range, gradient_glrlm_HighGrayLevelRunEmphasis, gradient_gldm_GrayLevelVariance, wavelet-HL_firstorder_Median, wavelet-HL_glcm_Imc1, wavelet-HL_firstorder_Mean, lbp-2D_firstorder_10Percentile, wavelet-LL_firstorder_Median, wavelet-LL_firstorder_Minimum, wavelet-LL_gldm_SmallDependenceLowGrayLevelEmphasis, wavelet-LH_glcm_Correlation, wavelet-LH_glrlm_RunEntropy, wavelet-LL_glszm_SmallAreaLowGrayLevelEmphasis, original_glszm_GrayLevelNonUniformityNormalized | 28 |
| Apical T1 mapping | Gradient_firstorder_Kurtosis, original_shape2D_MajorAxisLength, logarithm_firstorder_Uniformity, logarithm_glcm_JointEnergy, lbp-2D_glcm_JointEntropy, lbp-2D_glcm_DifferenceEntropy, lbp-2D_glcm_SumEntropy, gradient_glcm_Idmn, gradient_firstorder_RobustMeanAbsoluteDeviation, wavelet-LL_firstorder_10Percentile, lbp-2D_firstorder_Variance, wavelet-LL_glszm_GrayLevelNonUniformity, wavelet-LH_glcm_Imc1, wavelet-LL_ngtdm_Coarseness, lbp-2D_firstorder_Entropy, wavelet-LH_glcm_Idn, wavelet-LH_firstorder_Kurtosis, wavelet-HL_firstorder_Median, wavelet-HH_glcm_MaximumProbability | 19 |
| Multi-module conjoint | Gradient_firstorder_Kurtosis, original_shape2D_MinorAxisLength, original_shape2D_MajorAxisLength, squareroot_firstorder_Maximum, original_shape2D_MaximumDiameter, squareroot_firstorder_90Percentile, wavelet-LH_glcm_Idn, lbp-2D_glrlm_RunLengthNonUniformity | 8 |
| Model | AUC (95% CI) | Precision | Recall | F1 score |
|---|---|---|---|---|
| Conventional T1 value | 0.72 (0.618-0.825) | 0.61 | 0.63 | 0.62 |
| Basal T1 mapping | ||||
| Training | 1 (0.998-1.000) | 0.98 | 0.98 | 0.98 |
| Test | 0.96 (0.851-1.000) | 0.84 | 0.82 | 0.83 |
| Mid-chamber T1 mapping | ||||
| Training | 1 (0.991-1.000) | 0.99 | 0.98 | 0.98 |
| Test | 0.96 (0.894-1.000) | 0.90 | 0.89 | 0.88 |
| Apical T1 mapping | ||||
| Training | 0.99 (0.986-1.000) | 0.94 | 0.93 | 0.93 |
| Test | 0.86 (0.660-0.997) | 0.71 | 0.70 | 0.70 |
| Multi-module conjoint | ||||
| Training | 1 (0.983-1.000) | 0.95 | 0.95 | 0.95 |
| Test | 0.90 (0.696-1.000) | 0.77 | 0.77 | 0.77 |
Abbreviations: AUC, area under curve; CI, confidence interval.
 curve for diagnosis of three diseases associated with left ventricular hypertrophy (LVH) based on the native T1 value. The micro-average ROC refers to the diagnostic ability of the multi-module model, calculated by the micro-average method. The macro-average ROC refers to the ROC curve analysis of the multi-module model, calculated by the macro-average method. Class 0 in the ROC curve analysis refers to the diagnostic ability of the multi-module model for hypertensive heart disease (HHD). Class 1 in the ROC curve analysis refers to the diagnostic ability of amyloid cardiomyopathy (AC) in the multi-module model. Class 2 in the ROC curve analysis refers to the diagnostic ability of the multi-module model for hypertrophic cardiomyopathy (HCM).")
The receiver operating characteristic (ROC) curve for diagnosis of three diseases associated with left ventricular hypertrophy (LVH) based on the native T1 value. The micro-average ROC refers to the diagnostic ability of the multi-module model, calculated by the micro-average method. The macro-average ROC refers to the ROC curve analysis of the multi-module model, calculated by the macro-average method. Class 0 in the ROC curve analysis refers to the diagnostic ability of the multi-module model for hypertensive heart disease (HHD). Class 1 in the ROC curve analysis refers to the diagnostic ability of amyloid cardiomyopathy (AC) in the multi-module model. Class 2 in the ROC curve analysis refers to the diagnostic ability of the multi-module model for hypertrophic cardiomyopathy (HCM).
 curve of four radiomic models for the differential diagnosis of three left ventricular hypertrophy (LVH)-associated diseases in the test dataset. The micro-average ROC refers to the diagnostic ability of the multi-module model, calculated by the micro-average method. The macro-average ROC refers to the ROC curve of the multi-module model, calculated by the macro-average method. Class 0 in the ROC curve analysis refers to the ROC curve of the multi-module model for hypertensive heart disease (HHD). Class 1 in the ROC curve analysis refers to the ROC curve of the multi-module model for amyloid cardiomyopathy (AC). Class 2 in the ROC curve analysis refers to the diagnostic ability of the multi-module model for hypertrophic cardiomyopathy (HCM).")
The receiver operating characteristic (ROC) curve of four radiomic models for the differential diagnosis of three left ventricular hypertrophy (LVH)-associated diseases in the test dataset. The micro-average ROC refers to the diagnostic ability of the multi-module model, calculated by the micro-average method. The macro-average ROC refers to the ROC curve of the multi-module model, calculated by the macro-average method. Class 0 in the ROC curve analysis refers to the ROC curve of the multi-module model for hypertensive heart disease (HHD). Class 1 in the ROC curve analysis refers to the ROC curve of the multi-module model for amyloid cardiomyopathy (AC). Class 2 in the ROC curve analysis refers to the diagnostic ability of the multi-module model for hypertrophic cardiomyopathy (HCM).
