

1. Background
2. Objectives
3. Patients and Methods
3.1. Coronary CT Evaluation
 artery.")
A 74-year-old man with multiple vulnerable plaques. Stenosis of 50 - 70% and > 70% can be seen in the proximal and middle portions of the left anterior descending (LAD) artery.
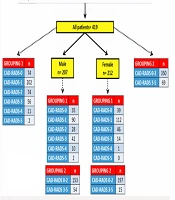
3.2. CAD-RADS
| Classification | Percentage | Interpretation |
|---|---|---|
| CAD-RADS classification | ||
| 0 | 0 | No plaque or stenosis |
| 1 | 1 - 24 | Minimal stenosis or plaque with no stenosis |
| 2 | 25 - 49 | Mild stenosis |
| 3 | 50 - 69 | Moderate stenosis |
| 4 | 70 - 99 | Severe stenosis |
| N | Non-diagnostic study | |
| LVM classification | ||
| 0 | ||
| Female | 43 - 95 | Normal range |
| Male | 49 - 115 | |
| 1 | ||
| Female | 96 - 108 | Mildly abnormal |
| Male | 116 - 131 | |
| 2 | Moderately abnormal | |
| Female | 109 - 121 | |
| Male | 132 - 148 | |
| 3 | Severely abnormal | |
| Female | ≥ 122 | |
| Male | ≥ 149 | |
Abbreviations: CAD-RADS, coronary artery disease-reporting and data system; LVM, left ventricular mass.
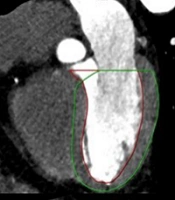
3.3. LVM and LVM Index (LVMI)
 cavity and myocardium are identified automatically. The epicardial and endocardial contours are confirmed manually. The papillary muscles are excluded in the calculation of left ventricular mass (LVM).")
The left ventricular function analysis of a 73-year-old man. A trace of the left ventricular myocardium using end-diastolic contrast-enhanced CT angiography. The boundaries of the left ventricular (LV) cavity and myocardium are identified automatically. The epicardial and endocardial contours are confirmed manually. The papillary muscles are excluded in the calculation of left ventricular mass (LVM).
3.4. Biochemical Parameters
3.5. Ethical Considerations
3.6. Statistical Methods
4. Results
| Variables | All patients (n = 160) | CAD-RADS-0 (n = 27) | CAD-RADS-1 (n = 37) | CAD-RADS-2 (n = 28) | CAD-RADS-3 (n = 28) | CAD-RADS-4 (n = 40) | P-value |
|---|---|---|---|---|---|---|---|
| Age (y) | 56.4 ± 12.2 | 47.5 ± 9.8 | 54.9 ± 10.2 | 50.4 ± 10.6 b | 59.4 ± 10.6 c, d | 66.2 ± 10.1 c, e, f, g | < 0.001 h |
| Sex (M) | 92 (57.5) | 10 (37.0) | 13 (35.1) | 22 (78.5) | 19 (67.8) | 28 (70.0) | < 0.001 i |
| BMI (kg/m2) | 28.5 ± 4.0 | 26.8 ± 4.5 | 27.9 ± 2.9 | 28.5 ± 4.2 | 29.6 ± 3.2 | 29.6 ± 4.3 b | 0.025 h |
| HT | 62 (38.7) | 6 (22.2) | 10 (27.0) | 9 (32.1) | 13 (46.3) | 24 (60.0) | < 0.001 i |
| DM | 31 (19.3) | 3 (11.1) | 4 (10.8) | 4 (14.2) | 7 (25.0) | 13 (32.5) | 0.006 i |
| Lipid-lowering therapy | 146 (91.2) | 21 (77.7) | 33 (89.1) | 25 (89.2) | 27 (96.4) | 40 (100) | < 0.001 i |
| Smoking | 30 (18.7) | 3 (22.2) | 7 (18.9) | 6 (21.4) | 3 (10.7) | 11 (27.5) | 0.214 i |
| LVM (g) | 108.4 (41.4 - 202.8) | 101.1 (41.4 - 137.6) | 95.6 (58.8 - 159.7) | 112.3 (72.3 - 180.6) b, k | 118.3 (56.9 - 194.7) b, k | 128.3 (62.1 - 202.8) b, k | < 0.001 j |
| LVM-0 | 80 (50.0) | 16 (59.2) | 22 (59.5) | 14 (50.0) | 11 (39.2) | 17 (42.5) | 0.014 i |
| LVM-1 | 33 (20.6) | 5 (18.5) | 5 (13.5) | 9 (32.1) | 6 (21.5) | 8 (20.0) | |
| LVM-2 | 27 (16.9) | 6 (22.3) | 6 (16.2) | 3 (10.7) | 6 (21.5) | 6 (15.0) | |
| LVM-3 | 20 (12.5) | 0 | 4 (10.8) | 2 (7.2) | 5 (17.8) | 9 (22.5) | |
| LVMI (g/m2) | 53.8 (25.1 - 103.1) | 50.2 (25.1 - 73.4) | 48.3 (31.8 - 79.4) | 54.0 (35.3 - 100.1) k | 58.6 (31.5 - 100.4) b, k | 62.6 (36.3 - 103.1) b, k | 0.006 j |
| EF (%) | 57.6 ± 14.1 | 58.8 ± 12.3 | 56.1 ± 17.3 | 56.0 ± 15.4 | 59.8 ± 11.2 | 57.7 ± 12.9 | 0.796 h |
| SV (mL) | 72.6 ± 23.8 | 75.0 ± 24.4 | 67.2 ± 26.4 | 73.6 ± 28.1 | 75.4 ± 17.8 | 73.4 ± 21.6 | 0.630 h |
| ESV (mL) | 50.4 (15.1 - 195.9) | 52.1 (20.7 - 112.3) | 52.1 (19.9 - 115.2) | 55.5 (28.9 - 136.3) | 44.4 (17.5 - 88.4) | 47.0 (15.1 - 195.9) | 0.751 j |
| EDV (mL) | 123.3 (55.1 - 301.2) | 122.7 (81.2 - 188.6) | 117.6 (65.0 - 180.8) | 135.0 (65.9 - 207.3) | 127.3 (55.1 - 168.2) | 116.6 (71.1 - 301.2) | 0.619 j |
| CO (l/min) | 4.5 ± 1.6 | 4.5 ± 1.4 | 4.1 ± 1.7 | 4.3 ± 1.7 | 4.7 ± 1.5 | 4.6 ± 1.6 | 0.632 h |
| Vulnerable plaque | 25 (15.6) | 0 (0) | 1 (4.0) | 2 (8.0) | 2 (8.0) | 20 (80.0) | 0.001 i |
Abbreviations: CAD-RADS, coronary artery disease-reporting and data system; M, male; BMI, body mass index; HT, hypertension; DM, diabetes mellitus; LVM, left ventricular mass; LVMI, left ventricular mass index; EF, ejection fraction; SV, stroke volume; ESV, end-systolic volume; EDV, end-diastolic volume; CO, cardiac output.
a Values are expressed as No. (%), mean ± SD or value (range).
b P < 0.05 vs. CAD-RADS-0.
c P < 0.001.
d P < 0.05 vs. CAD-RADS-2.
e P < 0.001.
f P < 0.001.
g P < 0.05 vs. CAD-RADS-3.
h ANOVA.
i Chi-square test.
j Kruskal-Wallis test.
k P < 0.05 vs. CAD-RADS-1.
| Variables | All patients (n = 160) | CAD-RADS-0 (n = 27) | CAD-RADS-1 (n = 37) | CAD-RADS-2 (n = 28) | CAD-RADS-3 (n = 28) | CAD-RADS-4 (n = 40) | P-value |
|---|---|---|---|---|---|---|---|
| FPG (mg/dL) | 109.8 ± 26.8 | 98.0 (78.0 - 172.9) | 102.0 (81.2 - 204.2) | 97.0 (75.8 - 133.1) | 108.2 (74.0 - 196.1) a, b | 105.8 (74.3 - 193.1) a, b | 0.030 c |
| Hs-CRP (mg/dL) | 14.7 (0.4 - 99.7) | 3.1 (0.4 - 10.5) | 3.5 (1.0 - 38.0) | 12.0 (1.9 - 52.8) d, e | 27.2 (2.4 - 93.5) d, e, f | 35.3 (11.2 - 99.7) d, e, f, g | < 0.001 c |
| Monocytes (x109/μL) | 0.53 (0.13 - 1.10) | 0.40 (0.13 - 0.64) | 0.48 (0.28 - 0.70) d | 0.57 (0.41 - 0.87) d, h | 0.63 (0.28 - 0.099) d, e | 0.65 (0.39 - 1.10) d, e, b | < 0.001 c |
| TC (mg/dL) | 187.8 ± 43.6 | 188.3 ± 34.5 | 202.5 ± 37.2 | 185.8 ± 52.6 | 203.9 ± 52.2 | 172.5 ± 49.5 h, g | 0.025 i |
| Triglyceride (mg/dL) | 155.0 ± 66.8 | 146.5 ± 64.4 | 151.3 ± 49.8 | 150.1 ± 86.6 | 179.8 ± 65.2 | 150.3 ± 66.1 | 0.314 i |
| LDL (mg/dL) | 112.7 ± 35.4 | 106.9 ± 29.5 | 123.9 ± 31.5 | 114.2 ± 41.2 | 114.7 ± 30.6 | 103.5 ± 39.1 | 0.120 i |
| HDL (mg/dL) | 45.2 ± 11.1 | 52.0 ± 13.3 | 48.2 ± 13.0 | 41.5 ± 10.4 a | 41.2 ± 8.0 a | 43.1 ± 6.8 a | < 0.001 i |
| MHR | 12.2 (3.9 - 34.1) | 7.3 (3.9 - 17.9) | 10.2 (4.1 - 16.7) d | 13.6 (10.5 - 22.8) d, e | 15.9 (5.4 - 31.2) d, e | 15.8 (7.2 - 34.1) d, e | < 0.001 c |
Abbreviations: CAD-RADS, coronary artery disease-reporting and data system; FPG, fasting plasma glucose; Hs-CRP, high-sensitive C-reactive protein; TC, total cholesterol; LDL, low-density protein; HDL, high-density protein; MHR, monocyte-to-high-density protein ratio.
a P < 0.05 vs. CAD-RADS-0.
b P < 0.05 vs. CAD-RADS-2.
c Kruskal-Wallis test.
d P < 0.001.
e P < 0.001.
f P < 0.001.
g P < 0.05 vs. CAD-RADS-3.
h P < 0.05 vs. CAD-RADS-1.
i ANOVA.
| Parameters | MHR | LVM | ||
|---|---|---|---|---|
| r-value | P-value | r-value | P-value | |
| Age | 0.144 | 0.098 | 0.024 | 0.785 |
| BMI | 0.135 | 0.120 | 0.071 | 0.415 |
| FPG | 0.035 | 0.692 | 0.153 | 0.078 |
| Hs-CRP | 0.321 | < 0.001 | 0.247 | 0.004 |
| Monocytes | 0.737 | < 0.001 | 0.071 | 0.414 |
| TC | 0.214 | 0.013 | 0.165 | 0.057 |
| TG | 0.223 | < 0.001 | -0.271 | 0.002 |
| LDL | 0.199 | 0.021 | 0.178 | 0.039 |
| HDL | -0.532 | < 0.001 | 0.067 | 0.445 |
| LVM | 0.251 | 0.003 | 1.000 | 1.000 |
| LVMI | 0.232 | 0.007 | 0.251 | 0.003 |
| EF | 0.019 | 0.826 | 0.048 | 0.583 |
| SV | 0.109 | 0.209 | 0.486 | < 0.001 |
| ESV | 0.052 | 0.549 | 0.175 | 0.043 |
| EDV | 0.112 | 0.199 | 0.418 | < 0.001 |
| CO | 0.129 | 0.138 | 0.450 | < 0.001 |
Abbreviations: MHR, monocyte-to-high-density lipoprotein ratio; LVM, left ventricular mass; BMI, body mass index; FPG, fasting plasma glucose; Hs-CRP, high-sensitive C-reactive protein; TC, total cholesterol; TG, triglyceride; LDL, low-density lipoprotein; HDL, high-density lipoprotein; LVMI, left ventricular mass index; EF, ejection fraction; SV, stroke volume; ESV, end-systolic volume; EDV, end-diastolic volume; CO, cardiac output.
| Parameters | Vulnerable plaques (-) (n = 135) | Vulnerable plaques (+) (n = 25) | P-value |
|---|---|---|---|
| Age (y) | 54.5 ± 11.3 | 66.8 ± 11.5 | 0.001 |
| Sex (M) | 76 (56.3) | 16 (64.0) | 0.323 |
| BMI (kg/m2) | 28.4 ± 3.7 | 29.4 ± 5.1 | 0.345 |
| HT | 50 (37.0) | 12 (48.0) | 0.200 |
| DM | 26 (19.2) | 5 (20.0) | 0.553 |
| Lipid-lowering therapy | 121 (89.6) | 25 (100.0) | 0.056 |
| Smoking | 26 (19.2) | 4 (16.0) | 0.481 |
| LVM (g) | 108.6 ± 26.3 | 121.9 ± 38.3 | 0.107 |
| LVM-0 | 67 (49.6) | 13 (52.0) | 0.401 |
| LVM-1 | 30 (22.2) | 3 (12.0) | |
| LVM-2 | 24 (17.8) | 3 (12.0) | |
| LVM-3 | 14 (10.4) | 6 (24.0) | |
| LVMI (g/m2) | 55.5 ± 13.1 | 61.8 ± 19.3 | 0.130 |
| EF (%) | 58.6 ± 13.2 | 52.0 ± 17.0 | 0.077 |
| SV (mL) | 73.2 ± 23.7 | 69.3 ± 24.7 | 0.473 |
| ESV (mL) | 52.1 ± 22.6 | 68.8 ± 39.6 | 0.051 |
| EDV (mL) | 125.4 ± 33.5 | 138.2 ± 50.8 | 0.236 |
| CO (l/min) | 4.5 ± 1.6 | 4.5 ± 1.8 | 0.992 |
| FPG (mg/dL) | 108.5 ± 26.0 | 116.6 ± 30.4 | 0.221 |
| Hs-CRP (mg/dL) | 10.2 (0.42 - 93.5) | 35.5 (2.4 - 99.7) | 0.001 |
| Monocyte (× 109/μL) | 0.54 ± 0.17 | 0.67 ± 0.21 | 0.006 |
| Total cholesterol (mg/dL) | 188.9 ± 43.6 | 181.7 ± 43.8 | 0.452 |
| Triglyceride (mg/dL) | 154.0 ± 67.6 | 160.2 ± 63.1 | 0.661 |
| LDL (mg/dL) | 114.0 ± 35.0 | 105.4 ± 37.4 | 0.293 |
| HDL (mg/dL) | 45.3 ± 11.8 | 44.2 ± 6.7 | 0.521 |
| MHR | 12.6 ± 5.2 | 15.7 ± 5.1 | 0.010 |
| CAD-RADS-0 | 27 (20.0) | 0 (0.0) | 0.001 |
| CAD-RADS-1 | 36 (26.6) | 1 (4.0) | |
| CAD-RADS-2 | 26 (19.3) | 2 (8.0) | |
| CAD-RADS-3 | 26 (19.3) | 2 (8.0) | |
| CAD-RADS-4 | 20 (14.8) | 20 (80.0) |
Abbreviations: M, male; BMI, body mass index; HT, hypertension; DM, diabetes mellitus; LVM, left ventricular mass; LVMI, left ventricular mass index; EF, ejection fraction; SV, stroke volume; ESV, end-systolic volume; EDV, end-diastolic volume; CO, cardiac output; FPG, fasting plasma glucose; Hs-CRP, high-sensitive C-reactive protein; LDL, low-density lipoprotein; HDL, high-density lipoprotein; MHR, monocyte-to-high-density lipoprotein ratio; CAD-RADS, coronary artery disease-reporting and data system.
a Values are expressed as No. (%), mean ± SD or value (range).
| Variables | CAD-RADS (dependent variable) | Vulnerable plaque (dependent variable) | ||||||
|---|---|---|---|---|---|---|---|---|
| Univariate | Multivariate | Univariate | Multivariate | |||||
| Beta coefficient | P-value | Beta coefficient | P-value | Beta coefficient | P-value | Beta coefficient | P-value | |
| Age | 0.496 | < 0.001 | 0.254 | < 0.001 | 0.365 | < 0.001 | 0.189 | 0.017 |
| Male sex | 0.282 | < 0.001 | 0.179 | < 0.001 | 0.054 | 0.495 | ||
| BMI | 0.254 | 0.001 | 0.094 | 0.237 | ||||
| Current smoking | 0.098 | 0.215 | 0.029 | 0.715 | ||||
| HT | 0.289 | < 0.001 | 0.084 | 0.292 | ||||
| DM | 0.217 | 0.006 | 0.122 | 0.008 | 0.008 | 0.919 | ||
| HL | 0.299 | < 0.001 | 0.142 | 0.072 | ||||
| FPG | 0.228 | 0.004 | 0.110 | 0.166 | ||||
| Hs-CRP | 0.694 | < 0.001 | 0.407 | < 0.001 | 0.378 | < 0.001 | ||
| Monocytes | 0.581 | < 0.001 | 0.267 | 0.001 | ||||
| Total cholesterol | 0.128 | 0.107 | 0.060 | 0.446 | ||||
| Triglyceride | 0.101 | 0.204 | 0.033 | 0.674 | ||||
| LDL | 0.073 | 0.258 | 0.089 | 0.264 | ||||
| HDL | 0.284 | < 0.001 | 0.035 | 0.655 | ||||
| MHR | 0.613 | < 0.001 | 0.351 | < 0.001 | 0.211 | 0.007 | ||
| LVM | 0.354 | < 0.001 | 0.168 | 0.033 | ||||
| LVMI | 0.313 | < 0.001 | 0.158 | 0.045 | ||||
| EF | 0.020 | 0.800 | 0.170 | 0.031 | ||||
| SV | 0.038 | 0.632 | 0.059 | 0.455 | ||||
| ESV | 0.074 | 0.350 | 0.228 | 0.004 | ||||
| EDV | 0.078 | 0.324 | 0.126 | 0.111 | ||||
| CO | 0.069 | 0.385 | 0.001 | 0.991 | ||||
| CAD-RADS | 0.459 | < 0.001 | 0.350 | < 0.001 | ||||
Abbreviations: BMI, body mass index; HT, hypertension; DM, diabetes mellitus; HL, hyperlipidemia; FPG, fasting plasma glucose; Hs-CRP, high-sensitive C-reactive protein; LDL, low-density lipoprotein; HDL, high-density lipoprotein; MHR, monocyte-to-high-density lipoprotein ratio; LVM, left ventricular mass; LVMI, left ventricular mass index; EF, ejection fraction; SV, stroke volume; ESV, end-systolic volume; EDV, end-diastolic volume; CO, cardiac output; CAD-RADS, coronary artery disease-reporting and data system.
 curve of monocyte-to-HDL ratio (MHR) for predicting coronary artery disease-reporting and data system (CAD-RADS)-1; B, The ROC curve of MHR for predicting CAD-RADS-2; C, The ROC curve of MHR for predicting CAD-RADS-3; D, The ROC curve of MHR for predicting CAD-RADS-4.")
A, The receiver operating characteristic (ROC) curve of monocyte-to-HDL ratio (MHR) for predicting coronary artery disease-reporting and data system (CAD-RADS)-1; B, The ROC curve of MHR for predicting CAD-RADS-2; C, The ROC curve of MHR for predicting CAD-RADS-3; D, The ROC curve of MHR for predicting CAD-RADS-4.